

Harnessing the Power of NiFi: Building a Seamless Flow To Ingest PM2.5 Data From...
source link: https://dzone.com/articles/harnessing-the-power-of-nifi-building-a-seamless-f
Go to the source link to view the article. You can view the picture content, updated content and better typesetting reading experience. If the link is broken, please click the button below to view the snapshot at that time.

In an era where environmental awareness is paramount, the need for accurate and timely air quality data is crucial. One key pollutant that demands attention is PM2.5, referring to fine particulate matter with a diameter of 2.5 micrometers or smaller.
RPI3 with Enviro+ Sensors
Hardware (Enviro + Air Quality)
Raspberry Pi 4 Model B Rev 1.1 with 4GB RAM
PMS5003 Particulate Matter Sensor with Cable
- BME280
- LTR-559
- MICS6814
- ADS1015
- MEMS microphone
- 0.96" color LCD
- PMS5003
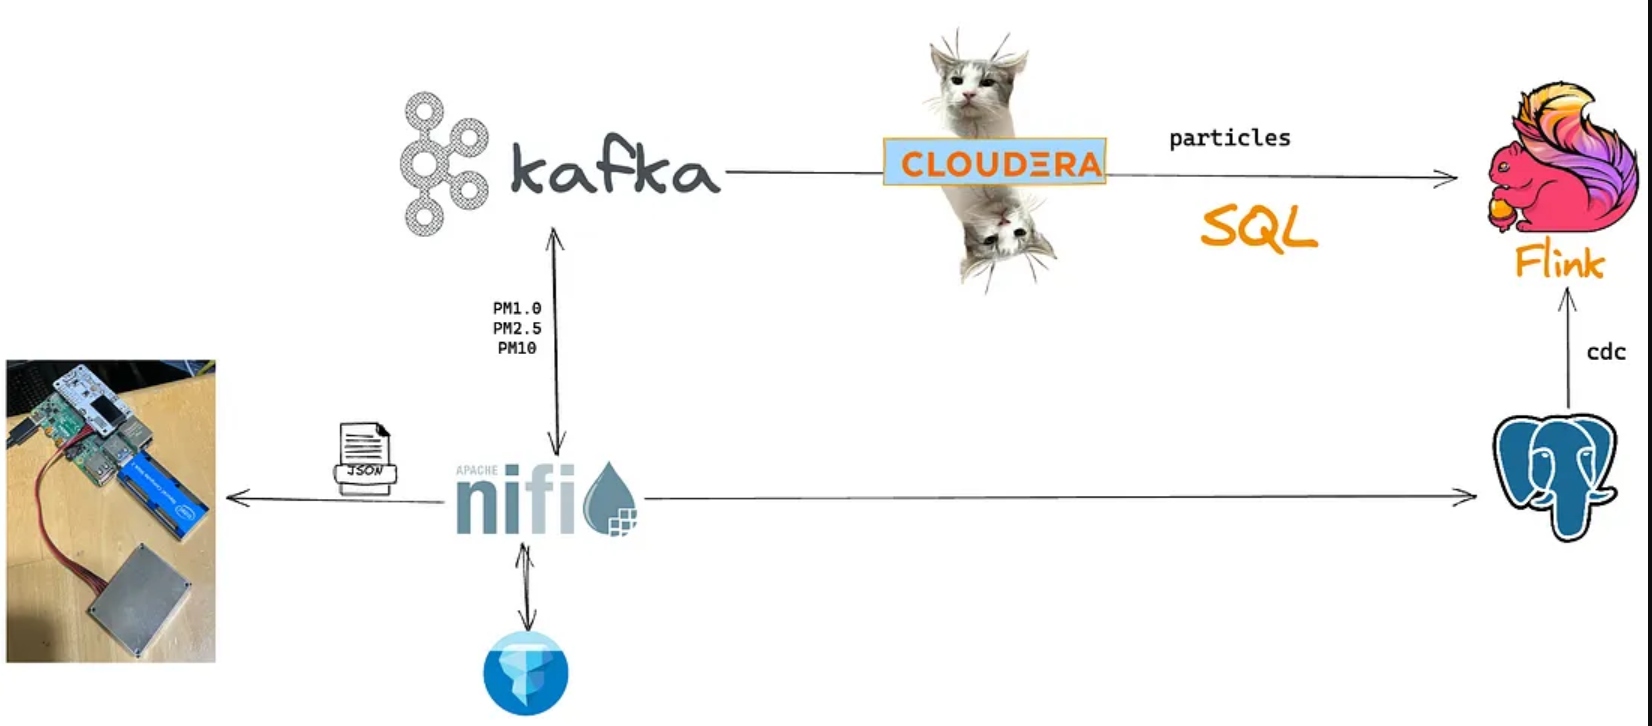
To efficiently gather and process PM2.5 data from a MiNiFi Java Agent equipped with a particle sensor, Apache NiFi offers an exceptional solution. This article explores the process of building a NiFi flow to seamlessly ingest PM2.5 data, empowering you to monitor and analyze air quality with ease.

We will also utilize Cloudera Edge Flow Manager (EFM) to develop, build, manage, deploy, monitor, enhance, backup, and maintain our flows for agents. In this case, I am prototyping with a single agent attached to this class of agents. We will deploy the one flow to one agent, the process is no different if there are 50,000 different devices receiving the same agent class.
Particle Sensor
Source Code
On the MiNiFi agent, we have a shell script that calls our Python 3 app.
cd /opt/demo/
python3 /opt/demo/enviroagent.py
Step 1: Setting Up the MiNiFi Agent and Particle Sensor
Before diving into NiFi, it is essential to have a functional MiniFi agent connected to a particle sensor.
The sensor is connected and basic reporting is successful. Notice how high those numbers are. This is not a good sign.
The MiNiFi agent is a lightweight data ingestion tool that runs on resource-constrained devices. By integrating a particle sensor, the agent can measure and transmit real-time PM2.5 data, acting as a valuable data source for our NiFi flow.
The Latest DZone Refcard
Mobile Database Essentials
After you add a new NAR, you have to refresh to see it.
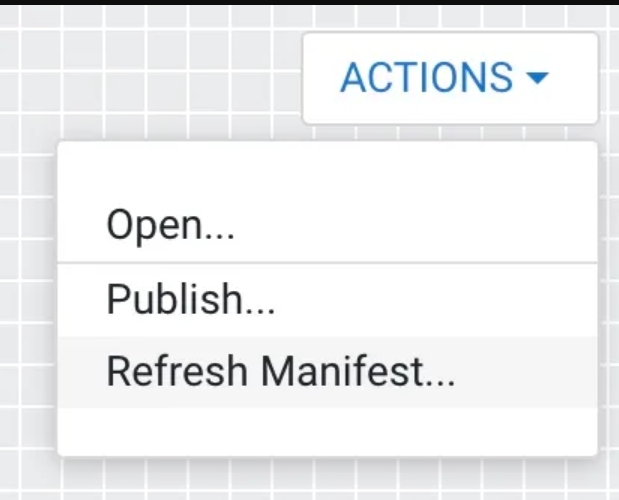
Click Refresh Manifest… to see any new processors available
Add the NAR for Kafka if you want it in your MiNiFi Java Agent
Refresh Complete
MLX Thermal Camera
CEM Monitor Dashboard
Edge Events
Open a Flow for each device agent class
Let’s build our flow by adding processors.
Run Shell Script
In the first step, we use ExecuteProcess to run a shell script that calls my Python application for sensor reading. This script returns the results as JSON via standard out (STDOUT) which we can read in MiNiFi.
Final MiNiFi Flow to Deploy
In our second step in the flow, we set the user agent so we know who is calling our NiFi HTTP REST listener.
A selection of processors available:
Publish MiNiFi Flow
Results from their agent
For DevOps stuff like backup, we can use EFM’s Swagger REST interface.
Swagger REST API
Step 2: Install and Configure Apache NiFi
Next, ensure that Apache NiFi is installed and ready to use. NiFi provides a graphical interface for constructing data flows, making it easier to design and manage the ingestion process. Once installed, configure NiFi to establish a connection with the MiniFi agent. This connection enables the flow of PM2.5 data from the sensor to NiFi for processing.

Step 3: Designing the NiFi Flow
The heart of our data ingestion solution lies in designing an efficient NiFi flow.
Apache NiFi
Start by creating a NiFi dataflow canvas and add relevant processors, controllers, and connections to construct the desired flow. In the case of PM2.5 data ingestion, key processors might include:
- ListenHTTP: Configured to receive data from the MiNiFi agent, this processor acts as the entry point for incoming PM2.5 measurements.
- ParseJSON: As the received data is likely in JSON format, this processor parses and extracts the relevant fields such as timestamp and PM2.5 concentration.
- RouteOnAttribute: With the extracted data, this processor allows for dynamic routing based on specific attributes. For example, you can route data to different branches based on PM2.5 concentration thresholds for further analysis.
- PutDatabaseRecord: This processor enables storing the PM2.5 data in a database for long-term storage and retrieval.
These are just a few examples of processors you can use. The flexibility of NiFi allows for customization based on your specific requirements.
NiFi — Received from MiNiFi Java Agent
For today’s flow, we do some processing on it via record processors.
Step 4: Enhancing the Flow With NiFi Features
To create a robust and efficient PM2.5 data ingestion flow, leverage NiFi’s processors.
For instance:
- Data validation: Implement data validation techniques to ensure the quality and integrity of the ingested PM2.5 data. You can utilize processors like ValidateRecord to enforce data integrity rules.
- Scalability and fault tolerance: NiFi offers the capability to scale horizontally, allowing you to distribute the workload across multiple NiFi instances. This enhances fault tolerance and ensures seamless data ingestion even in the face of failures.
- Data transformation and enrichment: Consider incorporating processors like UpdateAttribute, UpdateRecord, or MergeContent to enrich the PM2.5 data with additional information or transform it into a desired format before storage or further processing.
Step 5: Finalize Schemas
After enrichment, enhancement, cleaning, and validation, we can finalize our schemas for the incoming enviroplus data as well as the final cleaned-up particle stream.
The Cloudera Schema Registry provides a host for our data schemas and a REST endpoint to use from SQL Stream Builder, NiFi, Java, Scala, and anyone who can read REST endpoints.
Step 6: Data Streaming
Our data is streaming into Kafka to buffer and distribute to all consumers everywhere. We can also geo-replicate via Streams Replication to any other cluster, availability zone, cloud, or cluster with no code.
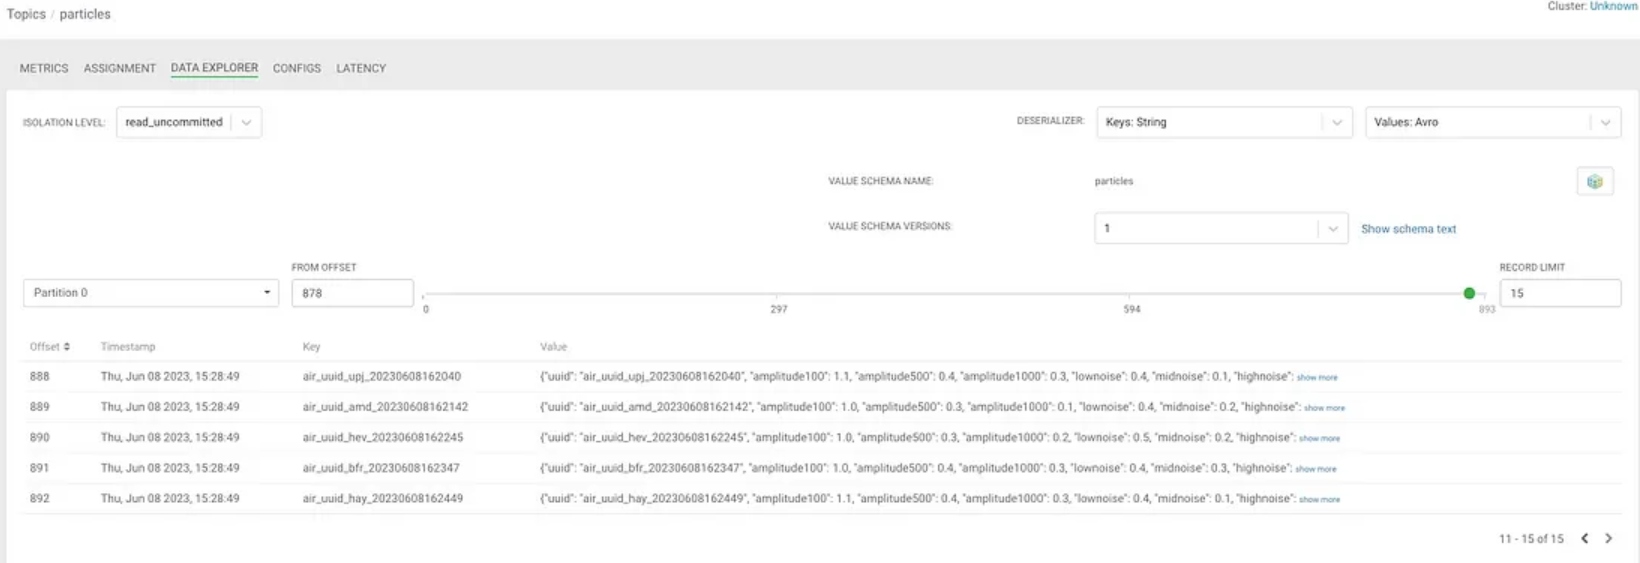
SMM View of our Topic: particles (data is avro with a schema)
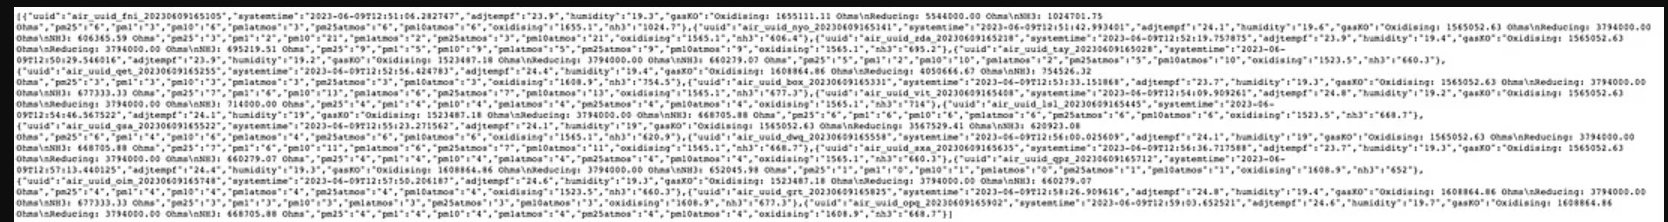
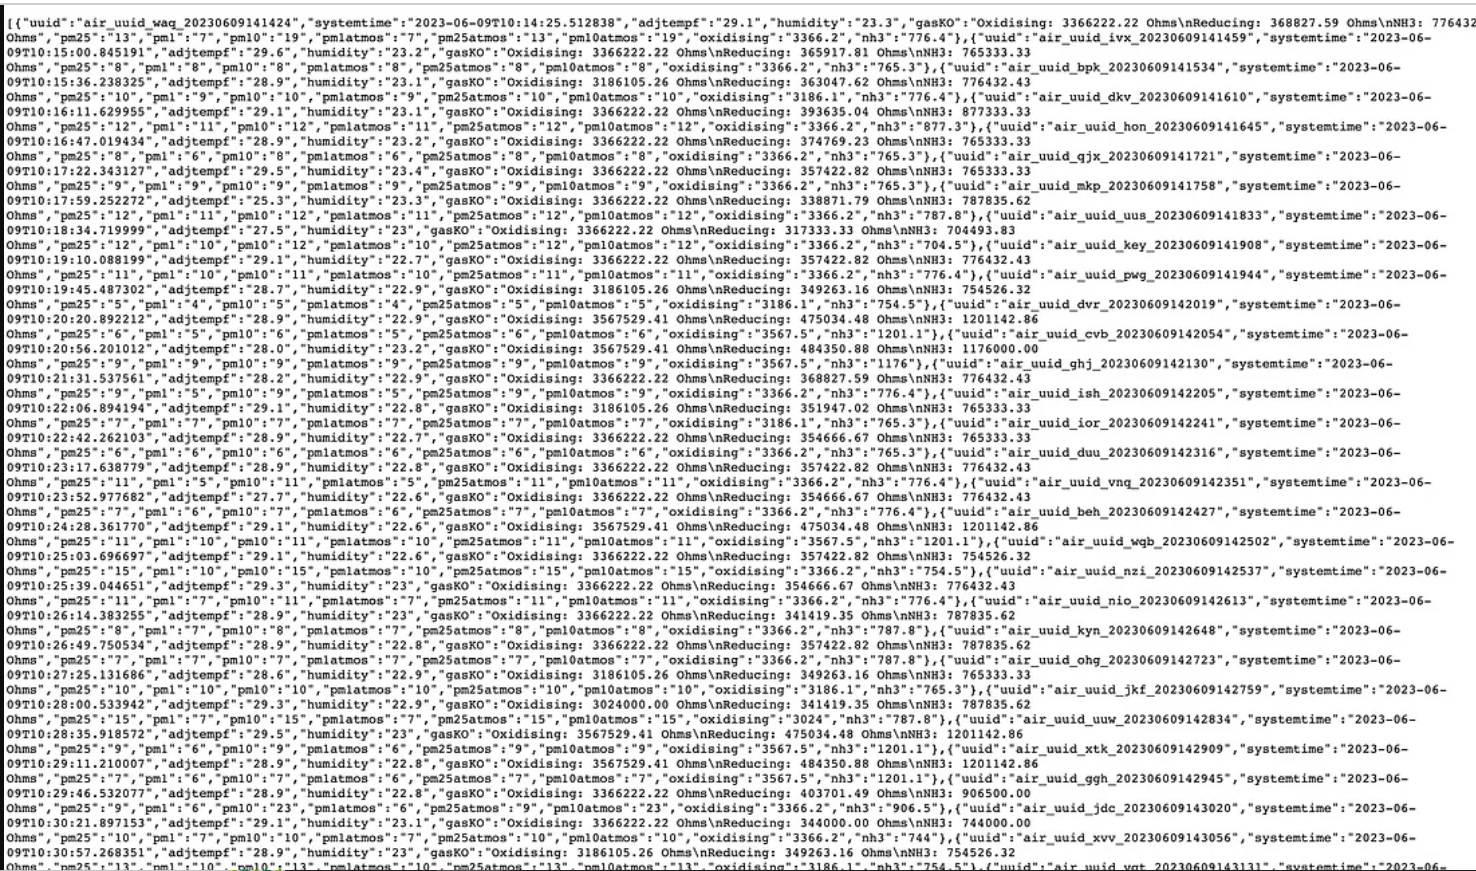
Below is a sample record we can peek at in the stream.
Step 7: Run Continuous SQL Analytics
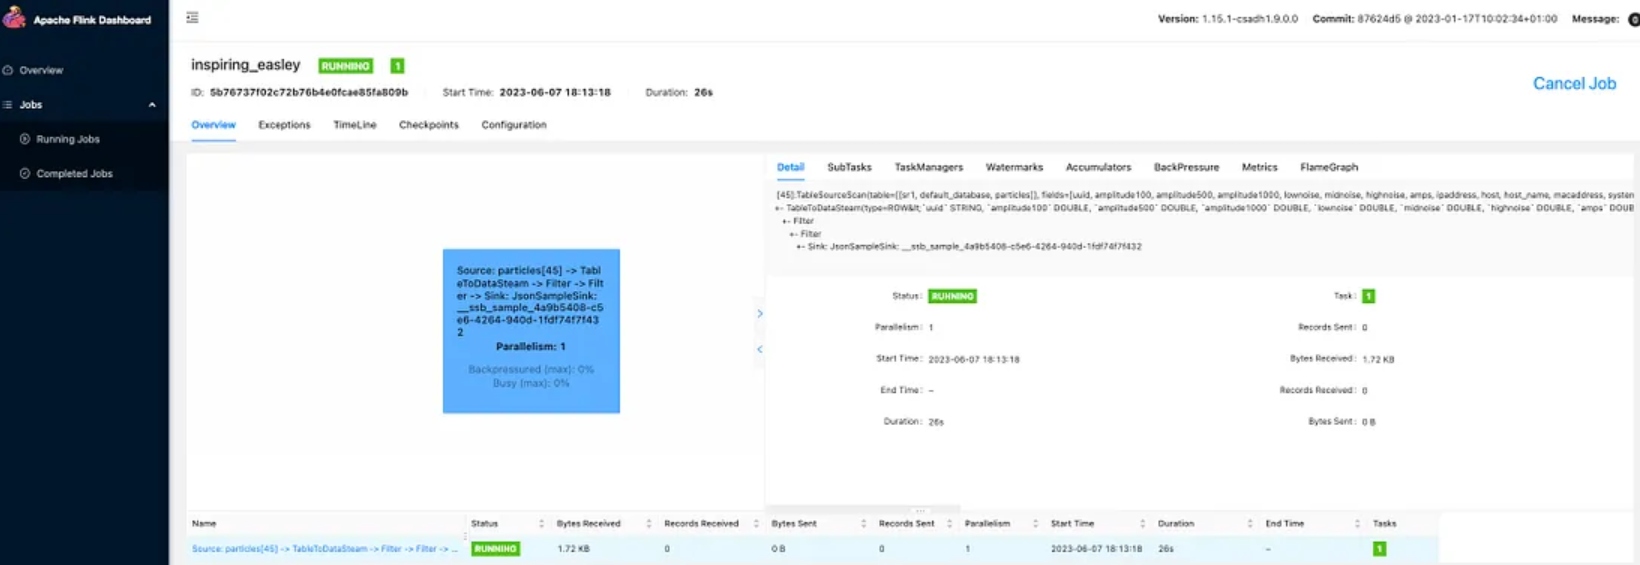
We now can run some continuous SQL analytics on this data stream. We use standard Flink SQL supercharged with the Cloudera SQL Stream Builder UI.
Let’s examine our “table” so we can do some queries.
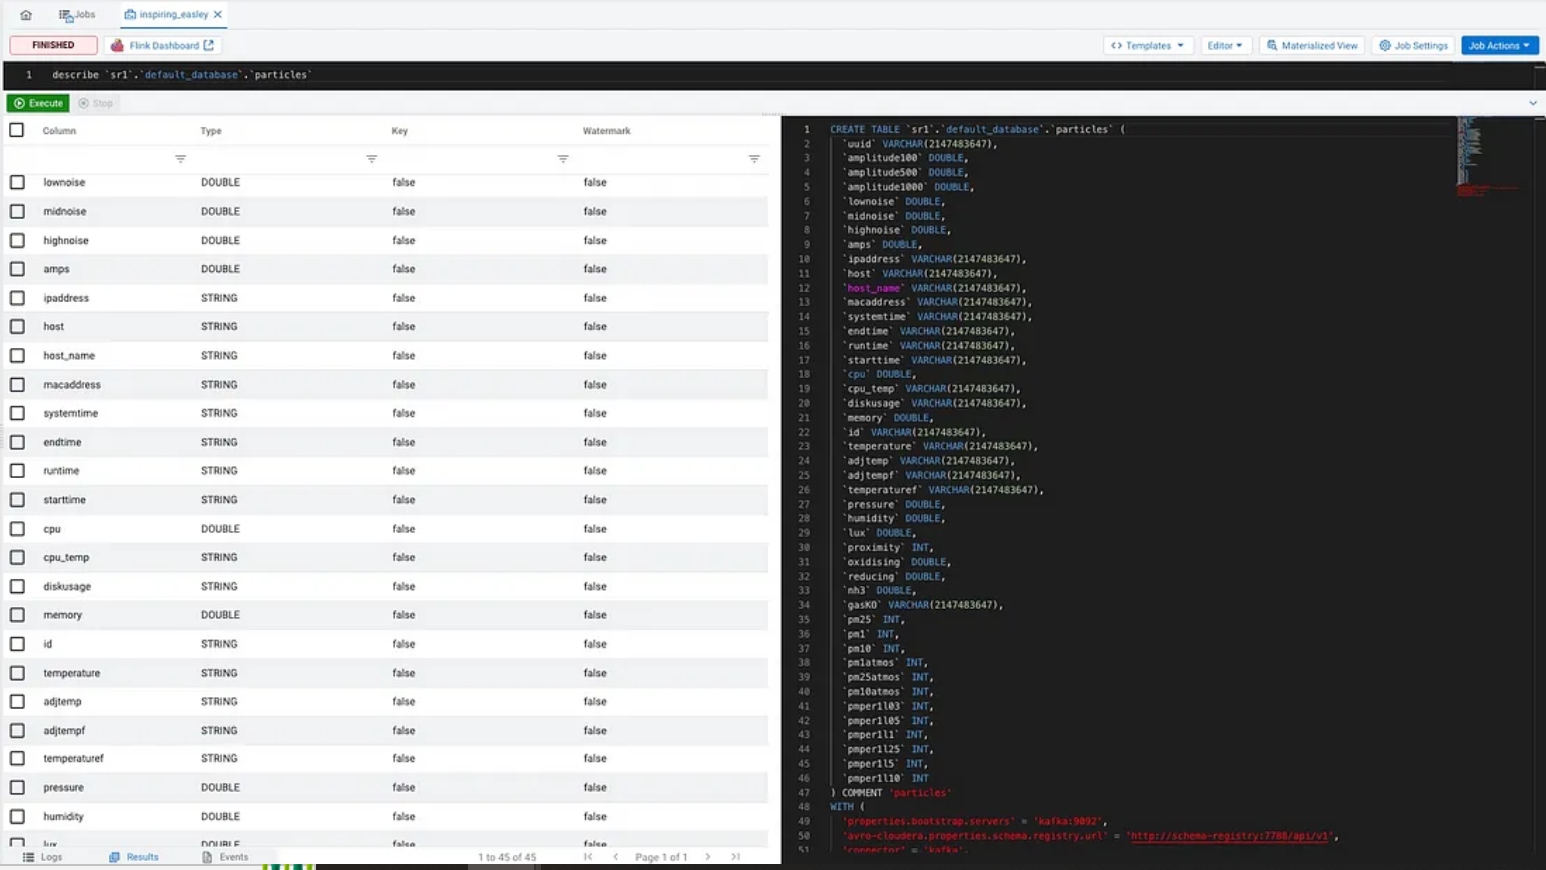
Schema Registry Schema connects to Kafka Topic
A simple select * and we have all of our topic data available.
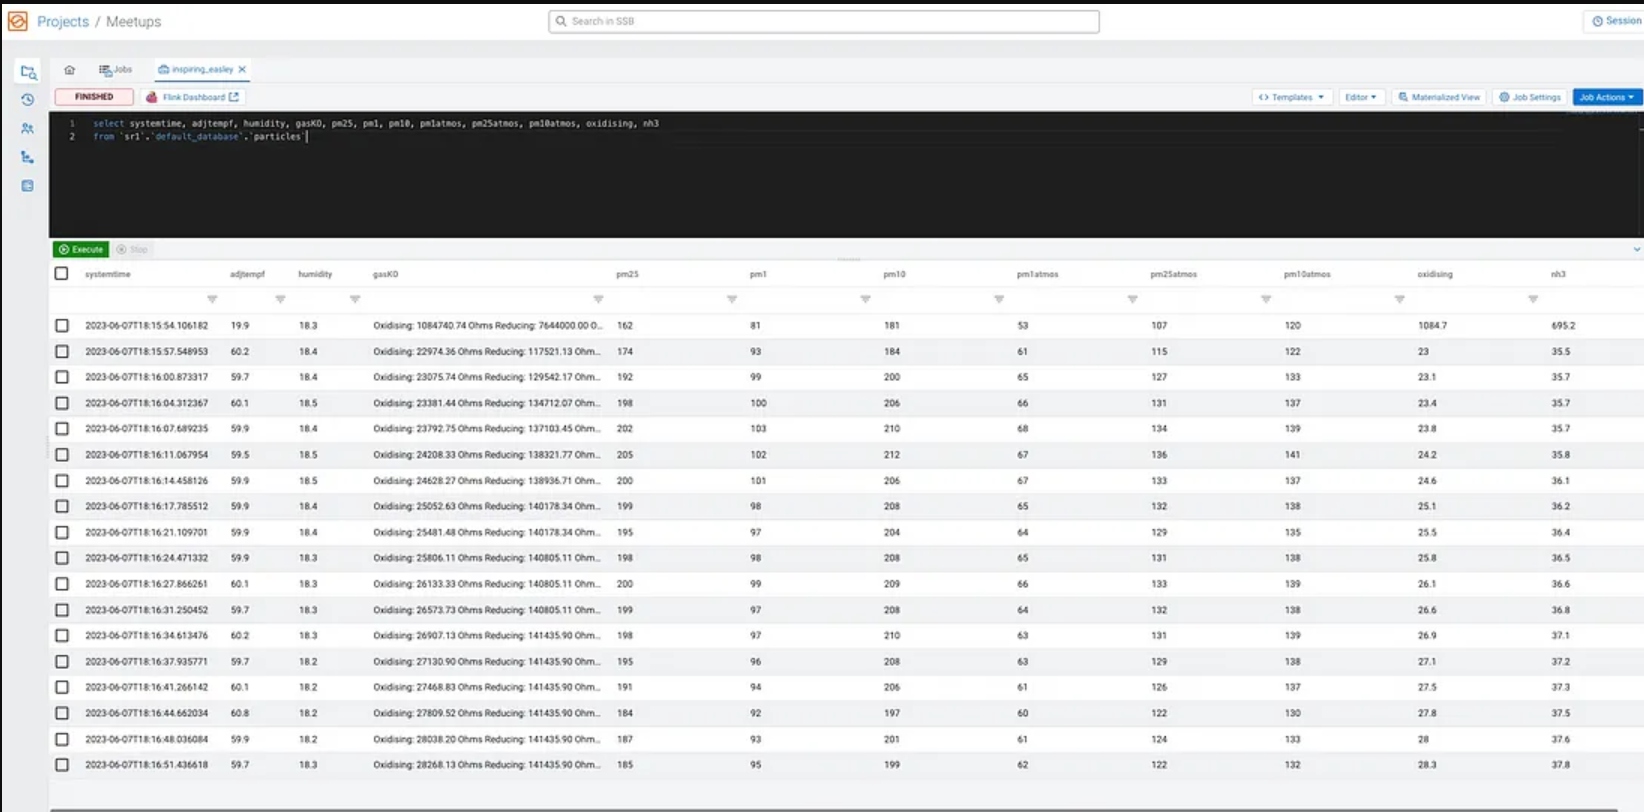
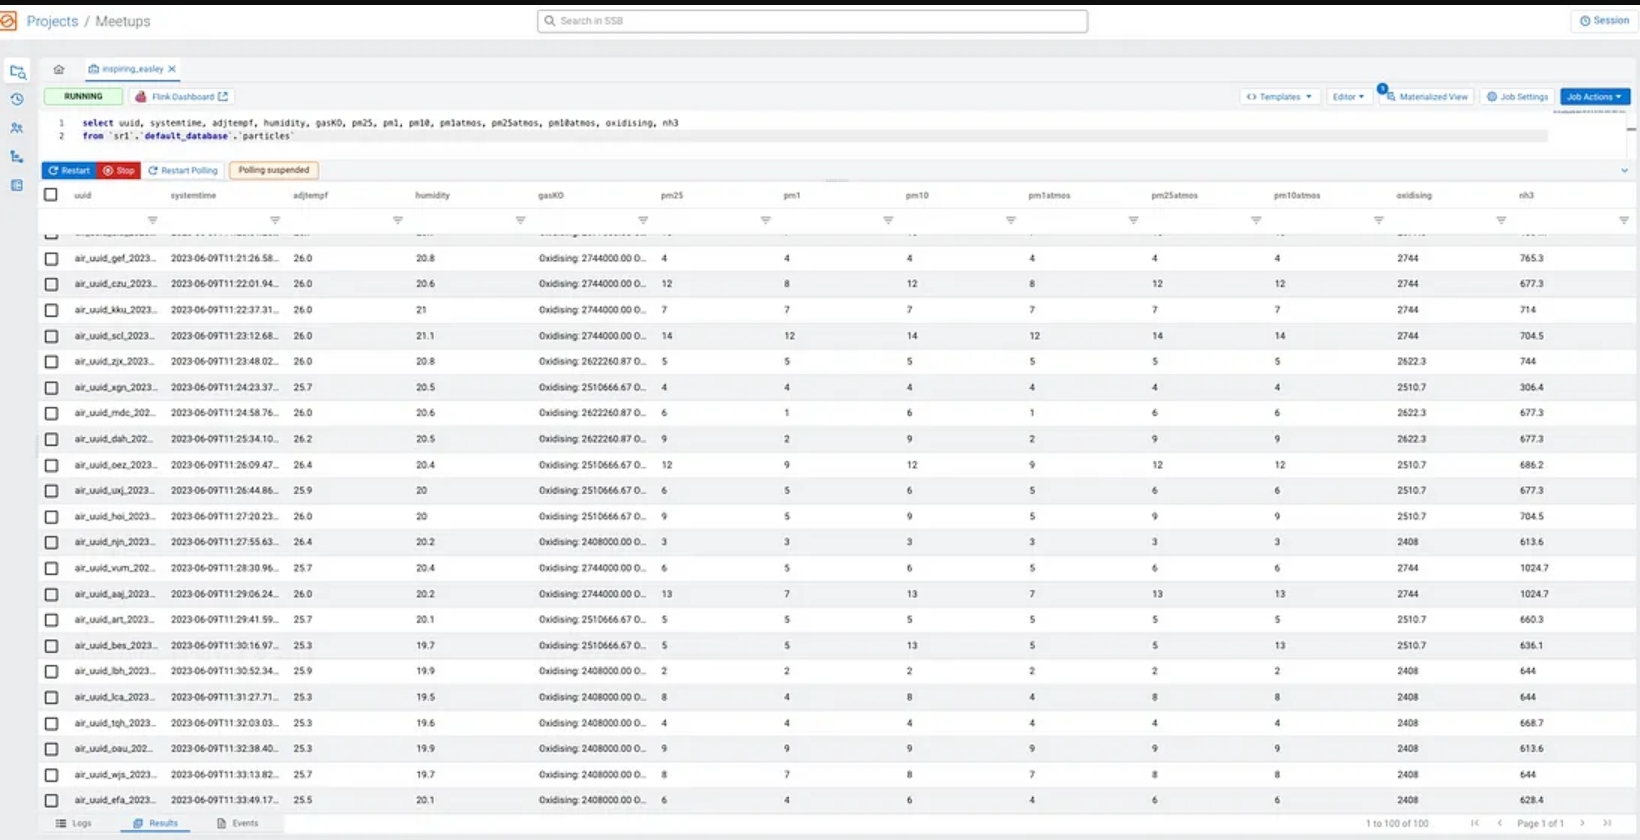
select systemtime, adjtempf, humidity, gasKO, pm25, pm1, pm10, pm1atmos, pm25atmos, pm10atmos, oxidising, nh3
from `sr1`.`default_database`.`particles`;

select systemtime,  max(pm25) as maxpm25, max(pm1) as maxpm1, max(pm10) as maxpm10, max(nh3) as maxnh3,
                    min(pm25) as minpm25, min(pm1) as minpm1, min(pm10) as minpm10, min(nh3) as minnh3,
                    count(pm25) as RowCount
from `sr1`.`default_database`.`particles`
group by systemtime;
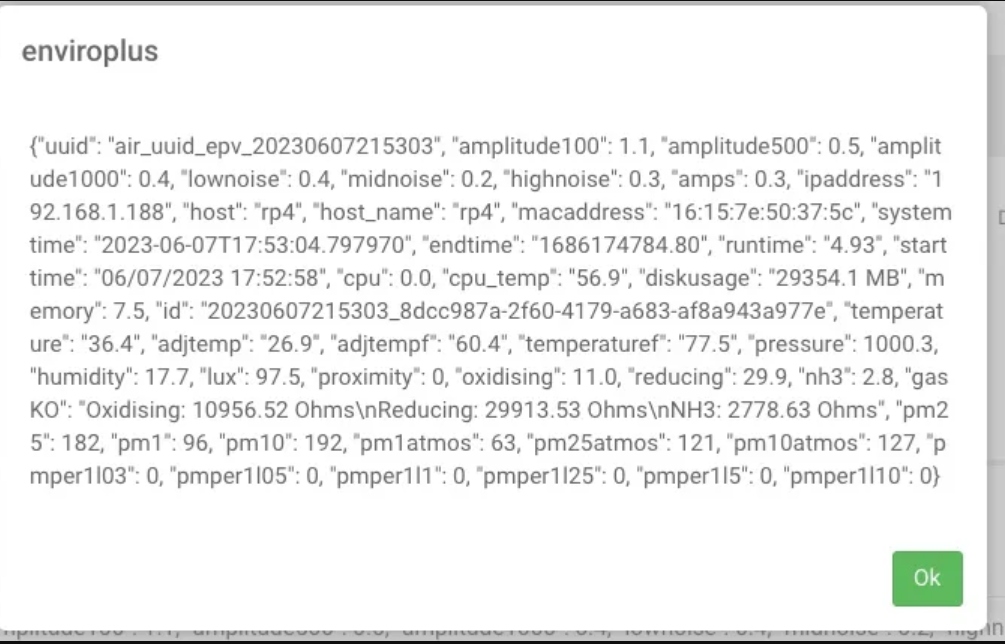
An example record in JSON.
{
  "uuid" : "air_uuid_kbr_20230608132527",
  "amplitude100" : 1.0,
  "amplitude500" : 0.3,
  "amplitude1000" : 0.2,
  "lownoise" : 0.4,
  "midnoise" : 0.2,
  "highnoise" : 0.3,
  "amps" : 0.3,
  "ipaddress" : "192.168.1.188",
  "host" : "rp4",
  "host_name" : "rp4",
  "macaddress" : "a6:e0:87:04:1a:75",
  "systemtime" : "2023-06-08T09:25:28.895187",
  "endtime" : "1686230728.89",
  "runtime" : "625.63",
  "starttime" : "06/08/2023 09:15:02",
  "cpu" : 0.3,
  "cpu_temp" : "53.5",
  "diskusage" : "29329.2 MB",
  "memory" : 5.8,
  "id" : "20230608132527_337aa313-278b-43d5-a4fd-6d39a8840822",
  "temperature" : "36.7",
  "adjtemp" : "29.4",
  "adjtempf" : "64.9",
  "temperaturef" : "78.1",
  "pressure" : 1003.2,
  "humidity" : 15.6,
  "lux" : 89.8,
  "proximity" : 0,
  "oxidising" : 76.2,
  "reducing" : 140.8,
  "nh3" : 50.9,
  "gasKO" : "Oxidising: 76188.84 Ohms\nReducing: 140805.11 Ohms\nNH3: 50944.44 Ohms",
  "pm25" : 183,
  "pm1" : 92,
  "pm10" : 195,
  "pm1atmos" : 60,
  "pm25atmos" : 121,
  "pm10atmos" : 129,
  "pmper1l03" : 15588,
  "pmper1l05" : 4565,
  "pmper1l1" : 1324,
  "pmper1l25" : 128,
  "pmper1l5" : 16,
  "pmper1l10" : 9
}
Step 8: Create Dashboard for Visualization
We can now create a basic dashboard for visualization. We could also use Jupyter Notebook hosted by Cloudera Machine Learning or use the Cloudera Data Visualization tool.
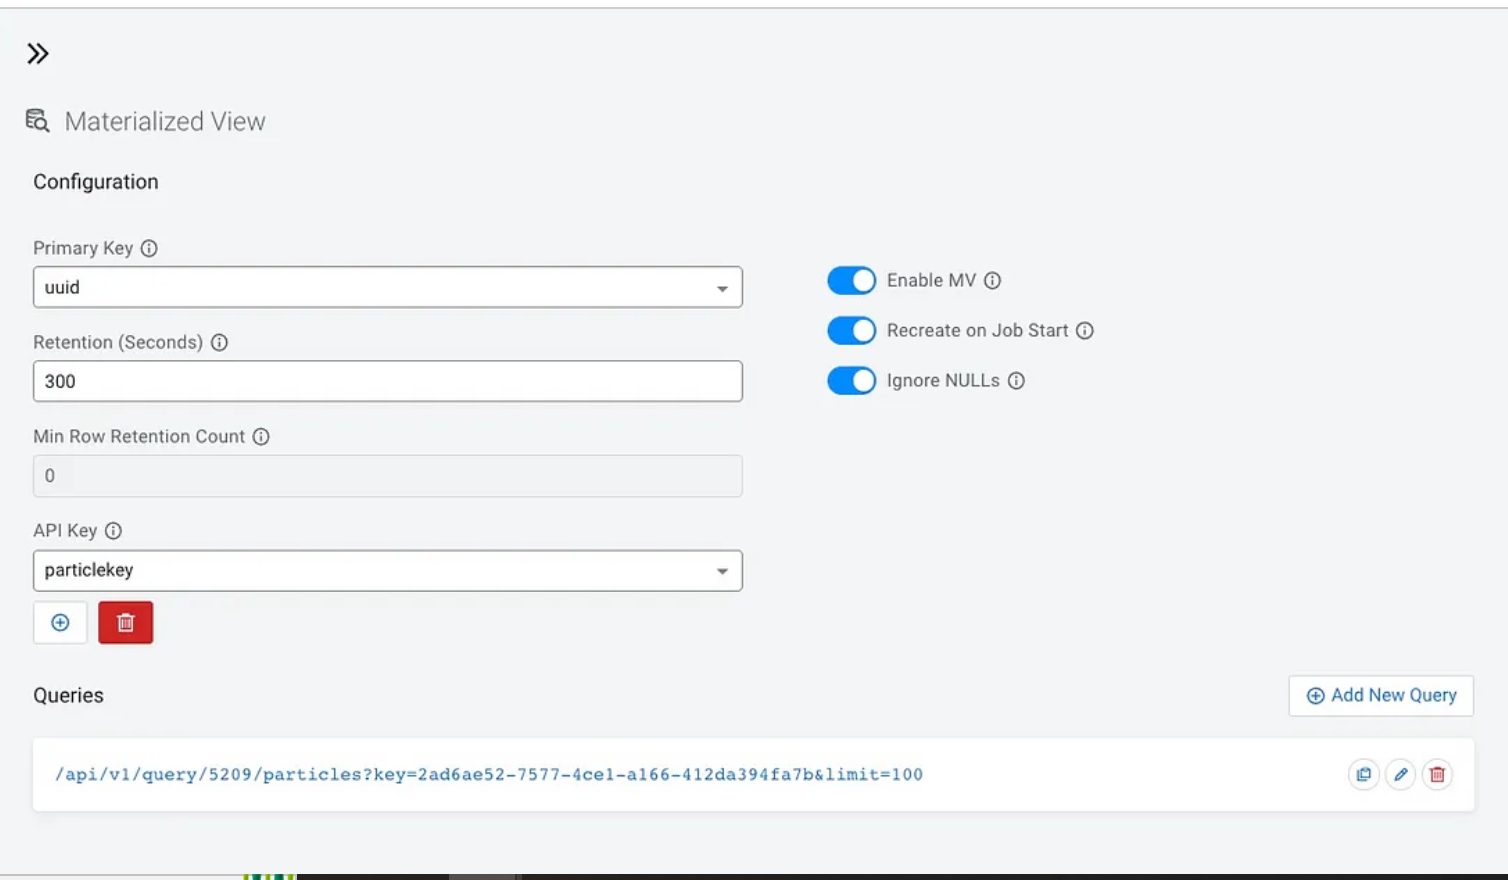
An easy way to power visualization is with a materialized view in SQL Stream Builder that provides a REST interface to JSON data which is super easy to read. We could also utilize Iceberg tables, Phoenix tables, or Hive tables; but for today, let’s try the cool REST interface supplied by SSB.
REST
REST Data
Once we have a query we like in SQL, you click Materialized View, and you can build a view. You need to click to create a new API key for security. Also, I recommend you Enable MV, Recreate on Job Start, and Ignore Nulls as options shown below. Also, pick a logical primary key from your query and set a retention time. Then you can click “Add New Query” to decide what fields and any parameters you want to pass.
SQL Stream Builder (SSB)
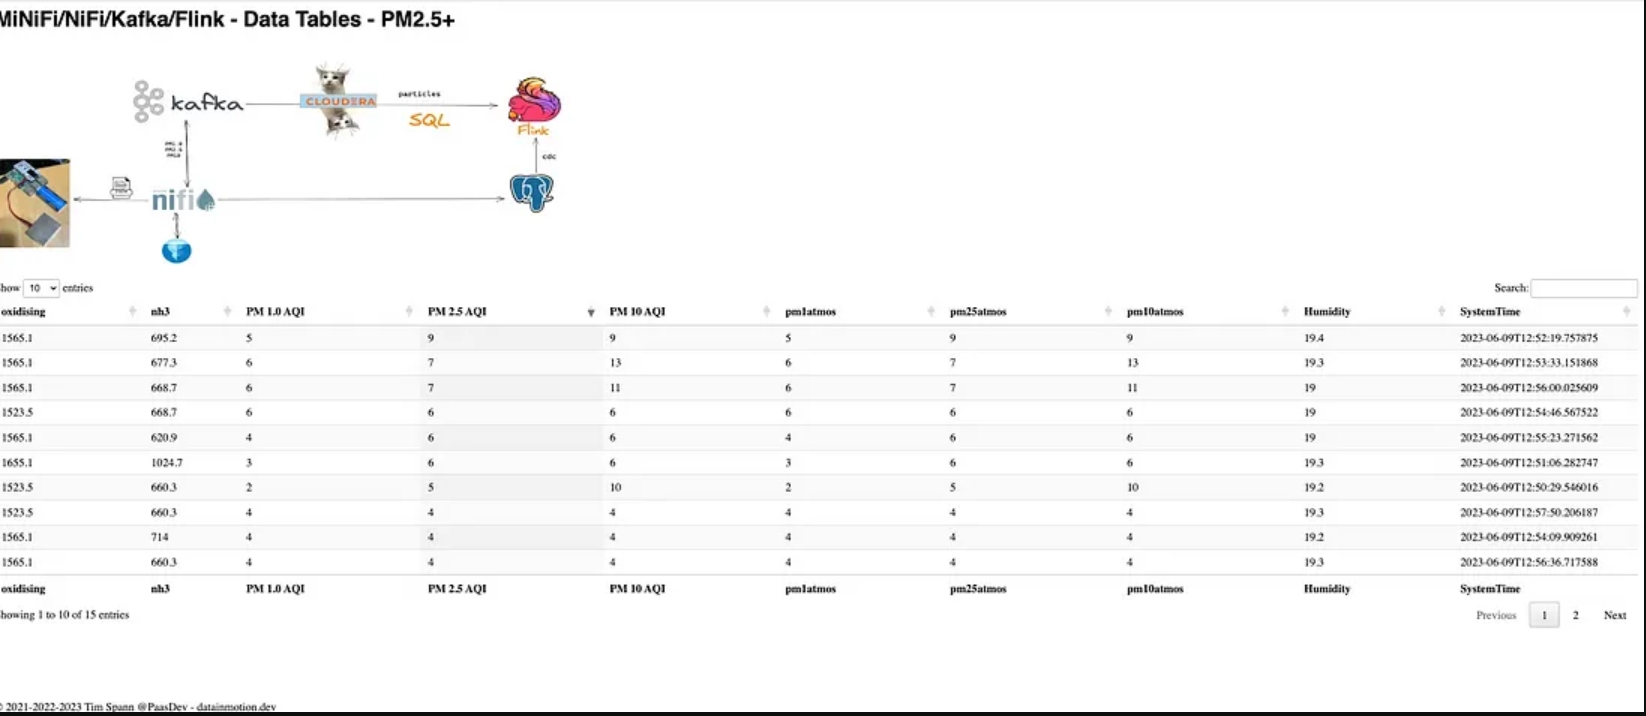
JQuery + Datatables.net + HTML5 + CSS Simple Display hosted by (python3 -m http.server 8000)
Step 9: Notifications
Let’s send some notifications and alerts to Slack. We can do this easily in Apache NiFi.

Conclusion
By leveraging the power of Apache NiFi, you can build a seamless flow for ingesting PM2.5 data from a MiniFi agent equipped with a particle sensor. This enables you to actively monitor and analyze air quality, empowering you to make informed decisions and take necessary actions. Deeper analytics and machine learning are enabled by other connected parts of the Data Platform.
Particle Schema
{"type":"record",
"name":"particles",
"namespace":"org.apache.nifi",
"fields":
[{"name":"uuid","type":["string","null"]},
{"name":"amplitude100","type":["double","null"]},
{"name":"amplitude500","type":["double","null"]},
{"name":"amplitude1000","type":["double","null"]},
{"name":"lownoise","type":["double","null"]},
{"name":"midnoise","type":["double","null"]},
{"name":"highnoise","type":["double","null"]},
{"name":"amps","type":["double","null"]},
{"name":"ipaddress","type":["string","null"]},
{"name":"host","type":["string","null"]},
{"name":"host_name","type":["string","null"]},
{"name":"macaddress","type":["string","null"]},
{"name":"systemtime","type":["string","null"]},
{"name":"endtime","type":["string","null"]},
{"name":"runtime","type":["string","null"]},
{"name":"starttime","type":["string","null"]},
{"name":"cpu","type":["double","null"]},
{"name":"cpu_temp","type":["string","null"]},
{"name":"diskusage","type":["string","null"]},
{"name":"memory","type":["double","null"]},
{"name":"id","type":["string","null"]},
{"name":"temperature","type":["string","null"]},
{"name":"adjtemp","type":["string","null"]},
{"name":"adjtempf","type":["string","null"]},
{"name":"temperaturef","type":["string","null"]},
{"name":"pressure","type":["double","null"]},
{"name":"humidity","type":["double","null"]},
{"name":"lux","type":["double","null"]},
{"name":"proximity","type":["int","null"]},
{"name":"oxidising","type":["double","null"]},
{"name":"reducing","type":["double","null"]},
{"name":"nh3","type":["double","null"]},
{"name":"gasKO","type":["string","null"]},
{"name":"pm25","type":["int","null"]},
{"name":"pm1","type":["int","null"]},
{"name":"pm10","type":["int","null"]},
{"name":"pm1atmos","type":["int","null"]},
{"name":"pm25atmos","type":["int","null"]},
{"name":"pm10atmos","type":["int","null"]},
{"name":"pmper1l03","type":["int","null"]},
{"name":"pmper1l05","type":["int","null"]},
{"name":"pmper1l1","type":["int","null"]},
{"name":"pmper1l25","type":["int","null"]},
{"name":"pmper1l5","type":["int","null"]},
{"name":"pmper1l10","type":["int","null"]}
]}
References
Recommend
-
40
SIMD Assembly instructions let you manipulate batches of data in parallel, in a single core.I’ve said it once and I’ll say it again: programming is the closest thing we have to magic. Shell commands are like...
-
47
README.md
-
41
Harnessing The Power Of Uncertainty Gradient Boosting Trees, Logistic Regression, and Deep Learning — you can do it in each ML model you want and achieve a lot more from your machine learning model.
-
19
Overview Apache NiFi is a visual data flow based system which performs data routing, transformation and system mediation logic on data between sources or endpoints. NiFi was developed originally by the US National Security Ag...
-
15
Custom NiFi Load Balancing Processor
-
5
6 Android Apps Harnessing The Power of Machine Learning January 23, 2020 W...
-
13
Yoink now harnessing the power of Chainlink VRF to Select Daily Winners!
-
10
Timothy Spann Posted on Nov 17 ...
-
5
nifi从入门到实战(保姆级教程)——身份认证 - ilyyin - 博客园 强少爷的小胖纸
-
9
nifi从入门到实战(保姆级教程)——flow - ilyyin - 博客园 强少爷的小胖纸
About Joyk
Aggregate valuable and interesting links.
Joyk means Joy of geeK