

Dashboards are often not worth the effort
source link: https://andrewpwheeler.com/2023/06/01/dashboards-are-often-not-worth-the-effort/
Go to the source link to view the article. You can view the picture content, updated content and better typesetting reading experience. If the link is broken, please click the button below to view the snapshot at that time.
Dashboards are often not worth the effort
When end users see dashboards, they often think “this is really whiz-bang cool, lets do that for our data”. There are two issues though I commonly see with dashboards. One is the nature of the task to be accomplished with the dashboard is not well defined, and so even a visually well done dashboard mostly goes unused. The second, there are a ton of headaches deploying dashboards with real data – and the effort to do it right is not worth it.
For the first part, consider a small agency that has a simple crime trends dashboard. The intent is to identify anomalous upticks of crime. This requires someone log into the dashboard, click around the different crime trends, and visually seeing if they are higher than expected. It would be easier to either have an automated alert when some threshold is met, or a standardized report (e.g. once a week) that is emailed to review.
This post is not going to even be about ‘most dashboards show stupid data’ or ‘the charts show the data in totally inappropriate ways’. Even in cases in which you can build a nice dashboard, the complexity level is IMO not worth it in many situations I have encountered. Automating alerts and building regular standard reports for the vast majority of situations is in my opinion a better solution for data products. The whiz-bang being able to interactively click stuff will only be used by a very small number of people (who can often build stuff like that for themselves anyway).
So onto the second part, deploying dashboards with real data that others can interact with. Many of the cool example dashboards you see online do tricks that would be inappropriate for a production dashboard. So even if someone is like ‘yeah I can do a demo dashboard in a day on my laptop’, there is still a ton of more work to expose that dashboard to different individuals, which is probably the ultimate goal.
Dashboards have two parts: A) connecting to a source database, then B) exposing the user-interface to outside parties. Seems simple right? Wrong.
Lets start with part A, connecting to a source database. Many dashboard examples you see online cheat at this stage – they embed a static version of the data in the dashboard itself. If Gary needs to re-upload the data to the dashboard every week, what happens when Gary goes on vacation or takes a day off? You now have an out of date dashboard.
It is quite hard to manage connections between live source data and a dashboard. In the case you have a public facing dashboard, I would just host a public file somewhere on the internet (so anyone can download the source data), and point to that source, and then have some automated process update that source data. This solves the Gary went on vacation factor at least, and there is no security risk. You intentionally only upload data that can be disseminated to the public.
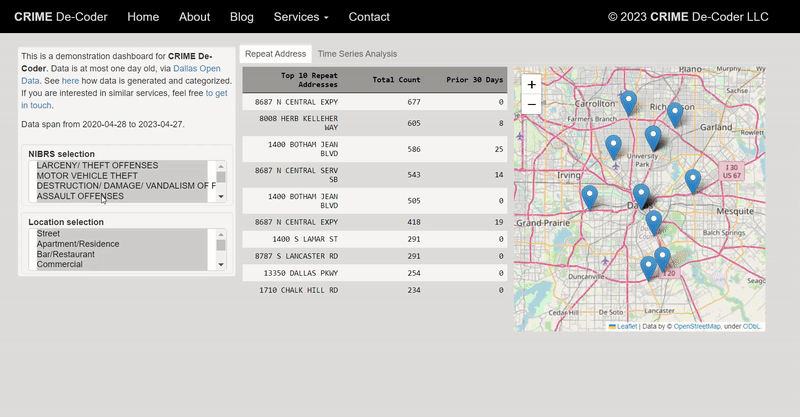
One potential alternative with the public facing dashboard is to make a serverless file. This will often embed the dashboard (and maybe data) into the webpage itself (e.g. pyscript wasm), so it may be slow to start up, but will work reasonably well if you can handle a one minute lag. You don’t need to worry about malicious actors in that scenario, as the heavy computation is done on the clients computer, not your server. I have an example on CRIME De-Coder (note it is currently not up to date, my code is running fine, but Dallas post the cyber-attack has not been updating their public data).
Managing a direct connection to your source data in a public facing dashboard is not a good idea, as malicious actors can spam your dashboard. This denial of service attack will not only make your dashboard unresponsive, but will also eat up your database processing. (Big companies often have a reporting database server vs a production database server in the best case scenario, but this requires resources most public sector agencies do not have.)
The solution to this is to limit who can access the dashboard, part B above. Unfortunately, the majority of dashboard software when you want to make a live connection and/or limit who can see the information, you are in the ‘need to pay for this scenario’. A very unfortunate aspect of the ‘you need to pay for this’ is that most of these vendors charge per viewer – it isn’t a flat fee. PowerBI is maybe OK if your organization already pays for Sharepoint, Tableau licensing is so painful I wouldn’t suggest it.
So what is the alternative? You are now in charge of spinning up your own server so people can click a dropdown menu and generate a line graph. Again you need to worry about security, but at least if you can hide behind a local network or VPN it is probably doable for most police departments.
I don’t want to say dashboards are never worth it. I think public facing dashboards are a good thing for police transparency, and if done right are easier to implement than private ones. Private ones are doable as well (especially if limiting to intranet applications). But like I said, this level of effort is over the top compared to just doing a regular report.
Recommend
About Joyk
Aggregate valuable and interesting links.
Joyk means Joy of geeK