
1

Springboot+actuator+prometheus+Grafana集成 - 白嫖老郭
source link: https://www.cnblogs.com/gtnotgod/p/17454019.html
Go to the source link to view the article. You can view the picture content, updated content and better typesetting reading experience. If the link is broken, please click the button below to view the snapshot at that time.
本次示例以Windows示例
推荐到官网去下载:Windows版的应用程序
下载最新版 prometheus-2.37.8.windows-amd64 压缩包:解压就行

下载最新版 grafana-9.5.2 压缩包:解压就行

准备一个Springboot的项目:
导入相关的监控依赖
        <!--监控站点开启-->
        <dependency>
            <groupId>org.springframework.boot</groupId>
            <artifactId>spring-boot-starter-actuator</artifactId>
        </dependency>

        <!-- prometheus -->
        <dependency>
            <groupId>io.micrometer</groupId>
            <artifactId>micrometer-registry-prometheus</artifactId>
            <version>1.10.5</version>
        </dependency>


        <!--SpringSecurity 安全访问-->
        <dependency>
            <groupId>org.springframework.boot</groupId>
            <artifactId>spring-boot-starter-security</artifactId>
        </dependency>
springSecurity的配置
#springSecurity 配置
spring.security.user.name=root
spring.security.user.password=root
spring.security.user.roles=ADMIN
spring-actuator配置
#增加开启springboot actuator监控的配置
management:
  endpoint:
    shutdown:
      enabled: true # 开启端点
    health:
      show-details: always # 是否展示健康检查详情
  endpoints:
    web:
      exposure:
        include:
          - prometheus
          - health
  metrics:
    tags:
      application: ${spring.application.name}
springSecurity的白名单接口配置-SecurityConfig
package com.gton.config;

import org.springframework.context.annotation.Configuration;
import org.springframework.security.config.annotation.web.builders.HttpSecurity;
import org.springframework.security.config.annotation.web.builders.WebSecurity;
import org.springframework.security.config.annotation.web.configuration.WebSecurityConfigurerAdapter;

/**
 * @description:
 * @author: GuoTong
 * @createTime: 2023-06-01 21:44:49
 * @since JDK 1.8 OR 11
 **/

@Configuration
public class SecurityConfig extends WebSecurityConfigurerAdapter {

    @Override
    protected void configure(HttpSecurity http) throws Exception {
        http.formLogin().and().authorizeRequests()
                .antMatchers("/actuator/**", "/favicon.ico", "/doc.html").permitAll()
                .antMatchers("/static/**").permitAll()
                .antMatchers("/favicon.ico").permitAll()
                // swagger
                .antMatchers("/swagger**/**").permitAll()
                .antMatchers("/webjars/**").permitAll()
                .antMatchers("/v2/**").permitAll()
                .anyRequest().authenticated().and().csrf().disable();    //关闭csrf保护
    }

    /**
     * Description: 忽略一些借口
     *
     * @author: GuoTong
     * @date: 2023-06-01 21:44:49
     * @return:
     */
    @Override
    public void configure(WebSecurity web) throws Exception {
        web.ignoring()
                .antMatchers(
                        "/doc.html",
                        "/swagger-resources/configuration/ui",
                        "/swagger*",
                        "/swagger**/**",
                        "/webjars/**",
                        "/favicon.ico",
                        "/**/*.css",
                        "/**/*.js",
                        "/**/*.png",
                        "/**/*.gif",
                        "/v2/**",
                        "/**/*.ttf",
                        "/actuator/**"
                );
    }
}
springboot的相关的配置
    @Value("${auth.global.enable:false}")
    private boolean enableGlobalAuth;

    @Bean
    @LoadBalanced
    public RestTemplate restTemplate() {
        return new RestTemplate();
    }


    /**
     * Description:  添加全局跨域CORS处理
     */
    @Override
    public void addCorsMappings(CorsRegistry registry) {
        // 设置允许跨域的路径
        registry.addMapping("/**")
                //设置允许跨域请求的域名
                .allowedOrigins("http://127.0.0.1:8787")
                // 是否允许证书
                .allowCredentials(true)
                // 设置允许的方法
                .allowedMethods("GET", "POST", "DELETE", "PUT")
                // 设置允许的header属性
                .allowedHeaders("*")
                // 跨域允许时间
                .maxAge(3600);
    }


    /**
     * Description: 静态资源过滤
     */
    @Override
    public void addResourceHandlers(ResourceHandlerRegistry registry) {
        //ClassPath:/Static/** 静态资源释放
        registry.addResourceHandler("/**").addResourceLocations("classpath:/static/");
        //释放swagger
        registry.addResourceHandler("doc.html").addResourceLocations("classpath:/META-INF/resources/");
        //释放webjars
        registry.addResourceHandler("/webjars/**").addResourceLocations("classpath:/META-INF/resources/webjars/");
    }

    /**
     * 解决springboot升到2.6.x之后,knife4j报错
     *
     * @param webEndpointsSupplier        the web endpoints supplier
     * @param servletEndpointsSupplier    the servlet endpoints supplier
     * @param controllerEndpointsSupplier the controller endpoints supplier
     * @param endpointMediaTypes          the endpoint media types
     * @param corsEndpointProperties      the cors properties
     * @param webEndpointProperties       the web endpoints properties
     * @param environment                 the environment
     * @return the web mvc endpoint handler mapping
     */
    @Bean
    public WebMvcEndpointHandlerMapping webMvcEndpointHandlerMapping(WebEndpointsSupplier webEndpointsSupplier, ServletEndpointsSupplier servletEndpointsSupplier,
                                                                     ControllerEndpointsSupplier controllerEndpointsSupplier, EndpointMediaTypes endpointMediaTypes, CorsEndpointProperties corsEndpointProperties, WebEndpointProperties webEndpointProperties,
                                                                     Environment environment) {
        List<ExposableEndpoint<?>> allEndpoints = new ArrayList<>();
        Collection<ExposableWebEndpoint> webEndpoints = webEndpointsSupplier.getEndpoints();
        allEndpoints.addAll(webEndpoints);
        allEndpoints.addAll(servletEndpointsSupplier.getEndpoints());
        allEndpoints.addAll(controllerEndpointsSupplier.getEndpoints());
        String basePath = webEndpointProperties.getBasePath();
        EndpointMapping endpointMapping = new EndpointMapping(basePath);
        boolean shouldRegisterLinksMapping = shouldRegisterLinksMapping(webEndpointProperties, environment, basePath);
        return new WebMvcEndpointHandlerMapping(endpointMapping, webEndpoints, endpointMediaTypes, corsEndpointProperties.toCorsConfiguration(), new EndpointLinksResolver(
                allEndpoints, basePath), shouldRegisterLinksMapping, null);
    }

    /**
     * shouldRegisterLinksMapping
     *
     * @param webEndpointProperties
     * @param environment
     * @param basePath
     * @return
     */
    private boolean shouldRegisterLinksMapping(WebEndpointProperties webEndpointProperties, Environment environment, String basePath) {
        return webEndpointProperties.getDiscovery().isEnabled() && (StringUtils.hasText(basePath) || ManagementPortType.get(environment).equals(ManagementPortType.DIFFERENT));
    }

    /**
     * Description:  过滤器
     *
     * @param registry
     * @author: GuoTong
     * @date: 2023-06-03 12:32:39
     * @return:void
     */
    @Override
    public void addInterceptors(InterceptorRegistry registry) {

        registry.addInterceptor(new MicrometerTPSInterceptor()).addPathPatterns("/**")
                .excludePathPatterns("/doc.html")
                .excludePathPatterns("/swagger-resources/**")
                .excludePathPatterns("/webjars/**")
                .excludePathPatterns("/v2/**")
                .excludePathPatterns("/favicon.ico")
                .excludePathPatterns("/sso/**")
                .excludePathPatterns("/swagger-ui.html/**");
    }


    /**
     * Description:  Bean 如下来监控 JVM 性能指标信息:
     * http://localhost:8889/actuator/prometheus 指标地址
     *
     * @param applicationName
     * @author: GuoTong
     * @date: 2023-06-03 12:34:36
     * @return:org.springframework.boot.actuate.autoconfigure.metrics.MeterRegistryCustomizer<io.micrometer.core.instrument.MeterRegistry>
     */
    @Bean
    MeterRegistryCustomizer<MeterRegistry> configurer(@Value("${spring.application.name}") String applicationName) {

        return registry -> registry.config().commonTags("application", applicationName);
    }
启动访问监控
-actuator的看板:http://localhost:port/actuator

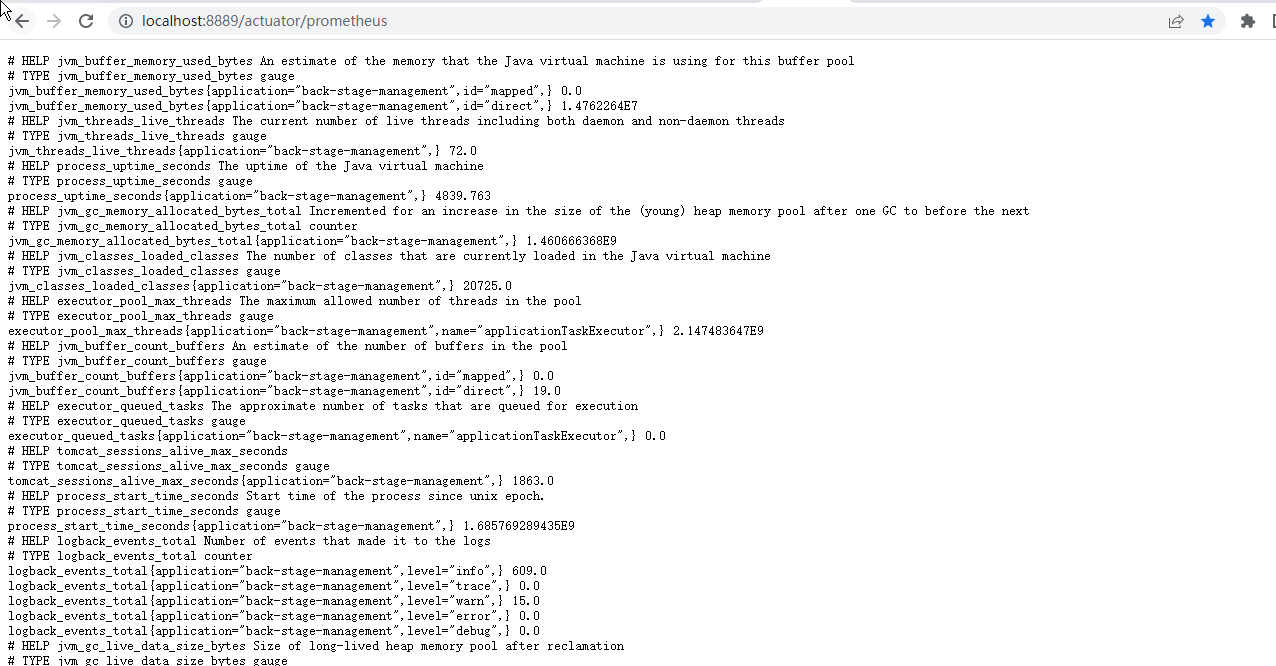
-prometheus的看板:http://localhost:port/actuator/prometheus
配置Prometheus的对于本Springboot微服务站点的监控

添加配置 以下内容为SpringBoot应用配置
# Prometheus  启动完成之后 http://localhost:9090/targets
# my global config
global:
  scrape_interval:     15s # Set the scrape interval to every 15 seconds. Default is every 1 minute.
  evaluation_interval: 15s # Evaluate rules every 15 seconds. The default is every 1 minute.
  # scrape_timeout is set to the global default (10s).

# Alertmanager configuration
alerting:
  alertmanagers:
    - static_configs:
        - targets:
          # - alertmanager:9093

# Load rules once and periodically evaluate them according to the global 'evaluation_interval'.
rule_files:
# - "first_rules.yml"
# - "second_rules.yml"

# A scrape configuration containing exactly one endpoint to scrape:
# Here it's Prometheus itself.
scrape_configs:
  - job_name: 'prometheus'
    static_configs:
      - targets: ['127.0.0.1:9090']
  ###以下内容为SpringBoot应用配置
  - job_name: 'BackStageApp'
    scrape_interval: 5s
    metrics_path: '/actuator/prometheus'
    static_configs:
      - targets: ['127.0.0.1:8889']
        labels:
          instance: "BackStageApp-prometheus"
          service: "BackStageApp-8889-prometheus"
点击这个执行:prometheus的应用

启动成功如下
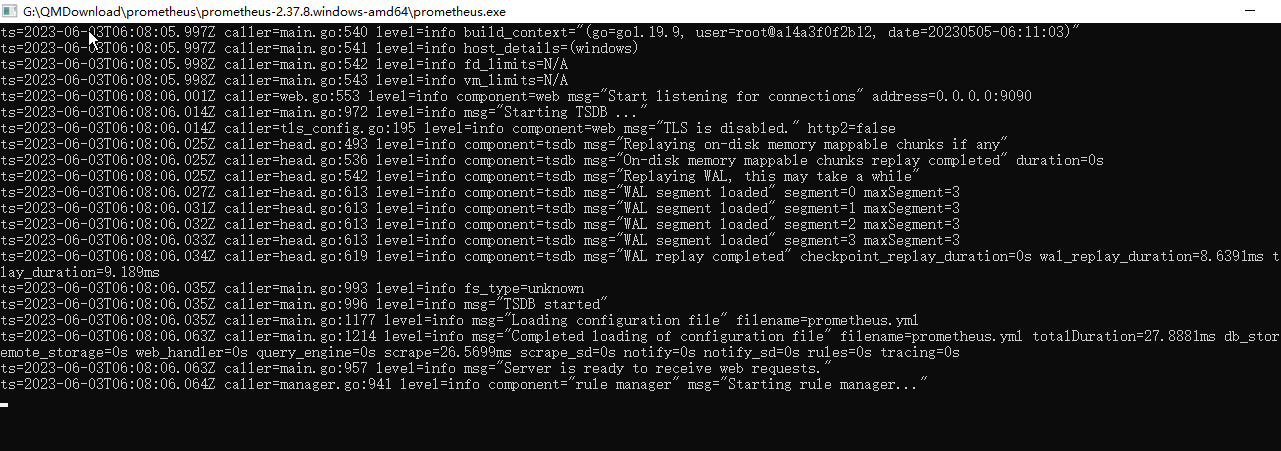
访问prometheus的应用:http://localhost:9090/

可以点击链接跳转

显示的是:http://sky-20200720fyp:8889/actuator/prometheus
说明Prometheus配置完成
然后启动Grafana

启动成功如下:初始化--启动有点久,耐性一点

打开Grafana看板:http://localhost:3000/login
首次登录使用 admin:admin 然后可以设置自己的账号密码,也可以跳过Skip

第一次进入如下

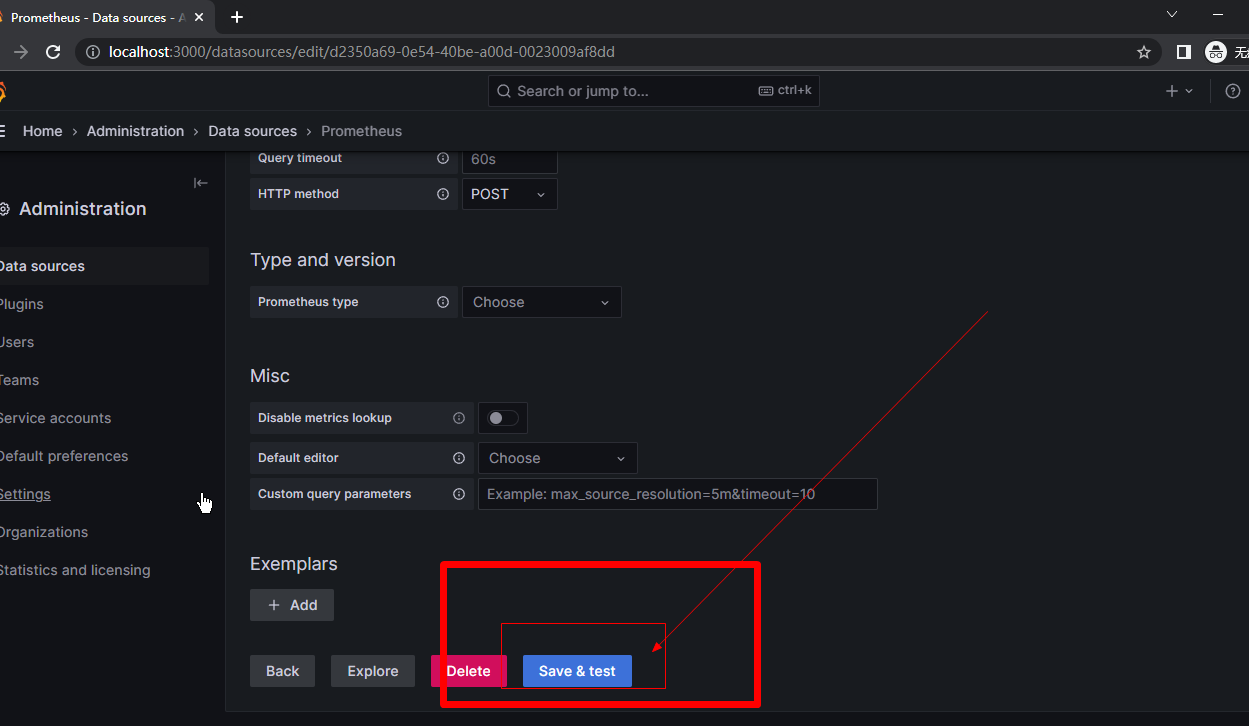
配置Prometheus的数据源
第一步选这个管理配置菜单

第二步选这个Datasorce

第三步选这个添加新的Datasorce

第四步选这个Prometheus数据源

第五步配置Prometheus数据源的地址和名称,然后保存

第六步配置Prometheus的看板

导入对应的监控 JVM 的 Dashboard 模板,模板编号为 4701。,点击load


填写这些必填项;导入自动加载后其他可以不用管,必须选择下面的刚刚配置的prometheus数据源,然后选择import

第七步监控JVM
上一步点击然后选择import,会进入这个界面,什么都没有

选择自己项目的站点配置的application和instance就行了,刷新左上角的时间

很多看板自己研究把

创建文件组

可以把监控看板移加入分类分组

Recommend
About Joyk
Aggregate valuable and interesting links.
Joyk means Joy of geeK