

Compute maximum and minimum values for rows and columns in SAS
source link: https://blogs.sas.com/content/iml/2014/12/01/max-and-min-rows-and-cols.html
Go to the source link to view the article. You can view the picture content, updated content and better typesetting reading experience. If the link is broken, please click the button below to view the snapshot at that time.

Compute maximum and minimum values for rows and columns in SAS
13A common question on SAS discussion forums is how to compute the minimum and maximum values across several variables. It is easy to compute statistics across rows by using the DATA step. This article shows how to compute the minimum and maximum values for each observation (across variables) and, for completeness, for each variable. If you think of your numerical data as being in a matrix, the task is to compute the minimum and maximum values for each row or for each column. You can do this in Base SAS or by using a powerful subscript operator in the SAS/IML matrix language.
The data in this article are Fisher's famous iris data, which contains the widths and lengths of the petals and sepals of 150 iris flowers. This data is distributed in the Sashelp.Iris data set as part of SAS software.
The minimum and maximum values of variables: Base SAS
The MEANS procedure is the simplest way to compute the minimum and maximum values for each numeric variable in a data set. The following statements display the extreme values for the four numerical variables in the iris data:proc means nolabels data=Sashelp.Iris Min Max; output out=MinMaxCols; run; |
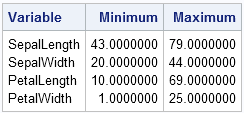
By not specifying the VAR statement, all numeric variables are used. (You could also specify var _numeric_;) The OUTPUT statement writes the minimum an maximum values to the MinMaxCols data set, along with a few other useful statistics.
The minimum and maximum values of observations: Base SAS
The SAS DATA step contains the MIN and MAX functions, which return the minimum and maximum nonmissing values (respectively) from a list of variables. You can read all of the numerical variables in a data set into an array and call the MIN and MAX functions as follows:
data MinMaxRows;
   set sashelp.Iris;
   array x {*} _numeric_;    /* x[1] is 1st var,...,x[4] is 4th var */
   min = min(of x[*]);       /* min value for this observation */
   max = max(of x[*]);       /* max value for this observation */
run;
proc print data=MinMaxRows(obs=7);
   var _numeric_;
run; |
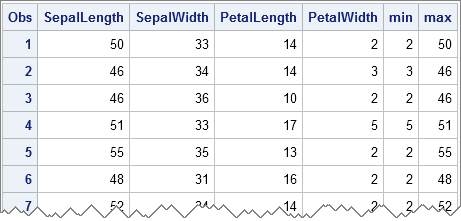
You can see that the MIN variable contain the minimum value of each row and the MAX variable contains the maximum value. Notice that you can use the _NUMERIC_ keyword to automatically assign the contents of the array x. This DATA step will work for any input data that contains numeric variables because the variable names are not hard-coded!
Also note that you can use the OF operator (sometimes called the OF keyword) to specify that the MIN and MAX functions should operate across all elements in the array.
The minimum and maximum values of columns in a matrix
The SAS/IML language contains a number of operators (called subscript reduction operators) that you can use to perform simples statistical operations down matrix columns or across matrix rows. This makes it easy to compute the maximum value of each row or column, and similarly for the minimum value.
The important operators are the max subscript operator (<>) and the min subscript operator (><). You use these operators like subscripts. To find extrema for columns, use these operators in place of row subscripts, as follows:
proc iml;
use Sashelp.Iris;
read all var _NUM_ into X[c=varNames];
close Sashelp.Iris;
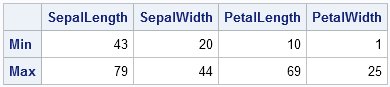
minC = X[><, ]; /* row vector contains min of columns */
maxC = X[<>, ]; /* row vector contains max of columns */
print (minC//maxC)[r={"Min" "Max"} c=varNames]; |
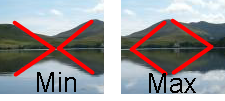
For years I struggled to remember which combination of greater-than and less-than symbols was the min operator and which was the max operator. Eventually I developed the following mental image. Think of the minimum as being the bottom of a valley. If you are viewing a valley from the far side of a lake, the image looks like a greater-than sign placed next to a less-than sign. Similarly, think of a maximum as being the peak of a mountain. If you are viewing the mountain from across a lake, the image looks like a less-than sign placed next to a great-than sign. These mnemonic aids are shown in the following image:
The minimum and maximum values of rows in a matrix
In a similar way, you can compute the minimum and maximum values of each row of a matrix, as follows:
minR = X[ ,><]; /* column vector contains min of rows */ maxR = X[ ,<>]; /* column vector contains max of rows */ |
The MinR and MaxR vectors each contain 150 elements. The value MinR[i]is the minimum value of the ith row and the value MaxR[i]is the maximum value of the ith row.
One of the nice aspects of the SAS/IML matrix language is its symmetry: operations on rows and operations on columns are often closely related to each other. This is in contrast to Base SAS, where the DATA step is often the best choice for computing statistics for observations, whereas procedures are often easier to use for computing statistics for variables.
Recommend
About Joyk
Aggregate valuable and interesting links.
Joyk means Joy of geeK