

golang pprof 监控系列(4) —— goroutine thread 统计原理 - 蓝胖子的编程梦
source link: https://www.cnblogs.com/hobbybear/p/17292713.html
Go to the source link to view the article. You can view the picture content, updated content and better typesetting reading experience. If the link is broken, please click the button below to view the snapshot at that time.
golang pprof 监控系列(4) —— goroutine thread 统计原理
大家好,我是蓝胖子。
在之前 golang pprof监控 系列文章里我分别介绍了go trace以及go pprof工具对memory,block,mutex这些维度的统计原理,今天我们接着来介绍golang pprof工具对于goroutine 和thread的统计原理。
还记得在golang pprof监控系列(2) —— memory,block,mutex 使用 文章里,通过http接口的方式暴露的方式展现 指标信息那个网页图吗?
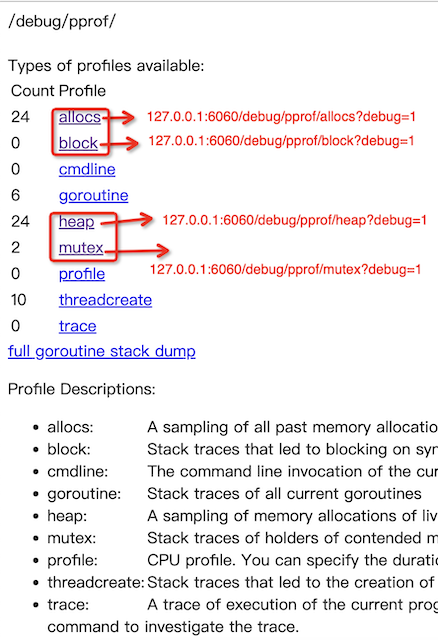
这一节,我将会介绍其中的goroutine部分和threadcreate部分。
老规矩,在介绍统计原理前,先来看看http接口暴露的方式暴露了哪些信息。
http 接口暴露的方式
让我们点击网页的goroutine 链接。。。
goroutine profile 输出信息介绍
进入到了一个这样的界面,我们挨个分析下网页展现出来的信息:
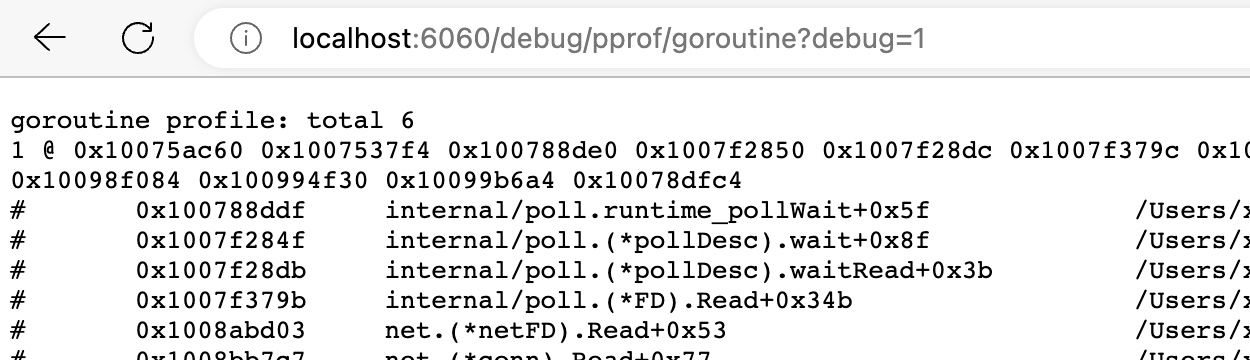
首先地址栏 /debug/pprof/goroutine?debug= 1 代表这是在访问goroutine指标信息,debug =1 代表访问的内容将会以文本可读的形式展现出来。 debug=0 则是会下载一个goroutine指标信息的二进制文件,这个文件可以通过go tool pprof 工具去进行分析,关于go tool pprof 的使用网上也有相当多的资料,这里就不展开了。 debug = 2 将会把当前所有协程的堆栈信息以文本可读形式展示在网页上。如下图所示:
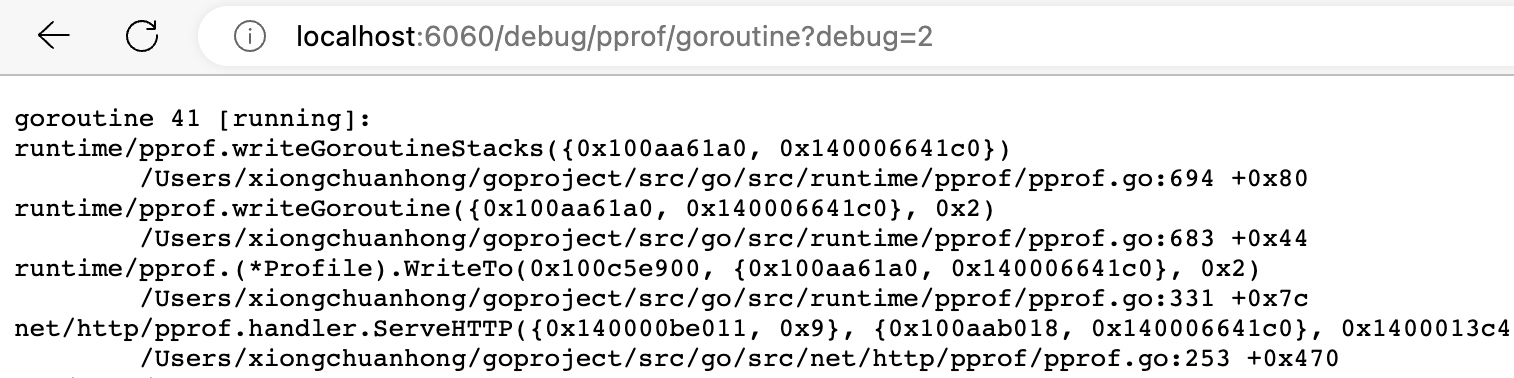
debug =2 时的 如上图所示,41代表协程的id,方括号内running代表了协程的状态是运行中,接着就是该协程此时的堆栈信息了。
让我们再回到debug = 1的分析上面去,刚才分析完了地址栏里的debug参数,接着,我们看输出的第一行
goroutine profile: total 6
1 @ 0x102ad6c60 0x102acf7f4 0x102b04de0 0x102b6e850 0x102b6e8dc 0x102b6f79c 0x102c27d04 0x102c377c8 0x102d0fc74 0x102bea72c 0x102bebec0 0x102bebf4c 0x102ca4af0 0x102ca49dc 0x102d0b084 0x102d10f30 0x102d176a4 0x102b09fc4
#	0x102b04ddf	internal/poll.runtime_pollWait+0x5f		/Users/xiongchuanhong/goproject/src/go/src/runtime/netpoll.go:303
#	0x102b6e84f	internal/poll.(*pollDesc).wait+0x8f		/Users/xiongchuanhong/goproject/src/go/src/internal/poll/fd_poll_runtime.go:84

......
goroutine profile 表明了这个profile的类型。
total 6 代表此时一共有6个协程。
接着是下面一行,1 代表了在这个堆栈上,只有一个协程在执行。但其实在计算出数字1时,并不仅仅按堆栈去做区分,还依据了协程labels值,也就是 协程的堆栈和lebels标签值 共同构成了一个key,而数字1就是在遍历所有协程信息时,对相同key进行累加计数得来的。
我们可以通过下面的方式为协程设置labels。
pprof.SetGoroutineLabels(pprof.WithLabels(context.Background(), pprof.Labels("name", "lanpangzi", "age", "18")))
通过上述代码,我可以为当前协程设置了两个标签值,分别是name和age,设置label值之后,再来看debug=1后的网页输出,可以发现 设置的labels出现了。
1 @ 0x104f86c60 0x104fb7358 0x105236368 0x104f867ec 0x104fba024
# labels: {"age":"18", "name":"lanpangzi"}
#	0x104fb7357	time.Sleep+0x137	/Users/xiongchuanhong/goproject/src/go/src/runtime/time.go:193
#	0x105236367	main.main+0x437		/Users/xiongchuanhong/goproject/src/go/main/main.go:46
#	0x104f867eb	runtime.main+0x25b	/Users/xiongchuanhong/goproject/src/go/src/runtime/proc.go:255
而数字1之后,就是协程正在执行的堆栈信息了。至此,goroutine指标的输出信息介绍完毕。
threadcreate 输出信息介绍
介绍完goroutine指标的输出信息后,再来看看threadcreate 线程创建指标的 输出信息。
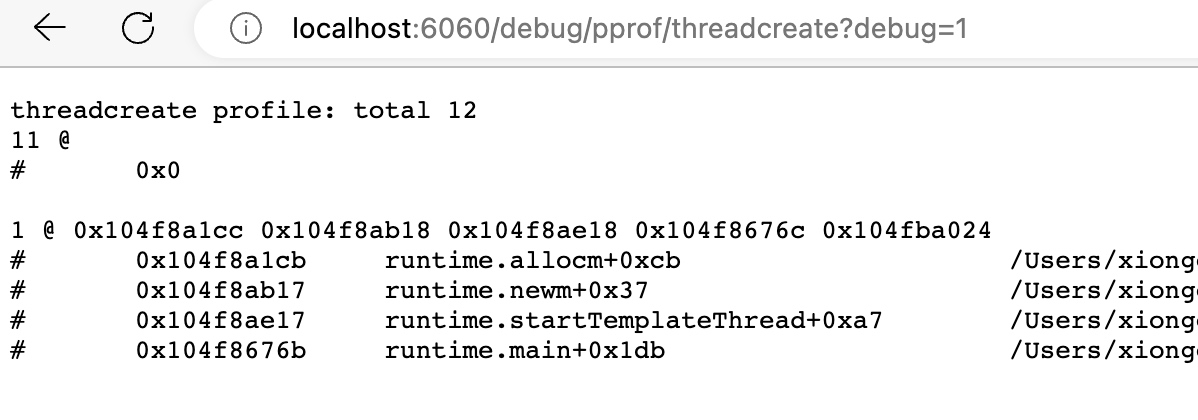
老规矩,先看地址栏,debug=1代表 输出的是文本可读的信息,threadcreate 就没有debug=2的特别输出了,debug=0时 同样也会下载一个可供go tool pprof分析的二进制文件。
接着threadcreate pfofile表明了profile的类型, total 12 代表了此时总共有12个线程被创建,然后紧接着是11 代表了在这个总共有11个线程是在这个堆栈的代码段上被创建的,注意这里后面没有堆栈内容,说明runtime在创建线程时,并没有把此时的堆栈记录下来,原因有可能是 这个线程是runtime自己使用的,堆栈没有必要展示给用户,所以干脆不记录了,具体原因这里就不深入研究了。
下面输出的内容可以看到在main方法里面创建了一个线程,runtime.newm 方法内部,runtime会启动一个系统线程。
threadcreate 输出内容比较简单,没有过多可以讲的。
程序代码暴露指标信息
看完了http接口暴露着两类指标的方式,我们再来看看如何通过代码来暴露他们。
还记得在golang pprof监控系列(2) —— memory,block,mutex 使用 是如何通过程序代码 暴露memory block mutex 指标的吗,goroutine 和 threadcreate 和他们一样,也是通过pprof.Lookup方法进行暴露的。
os.Remove("goroutine.out")
	f, _ := os.Create("goroutine.out")
	defer f.Close()
	err := pprof.Lookup("goroutine").WriteTo(f, 1)
	if err != nil {
		log.Fatal(err)
	}

	....

	os.Remove("threadcreate.out")
	f, _ := os.Create("threadcreate.out")
	defer f.Close()
	err := pprof.Lookup("threadcreate").WriteTo(f, 1)
	if err != nil {
		log.Fatal(err)
	}
无非就是将pprof.Lookup的传入的参数值改成对应的指标名即可。
接着我们来看看runtime内部是如何对这两种类型的指标进行统计的,好的,正戏开始。
统计原理介绍
无论是 goroutine 还是threadcreate 的指标信息的输出,都是调用了同一个方法writeRuntimeProfile。 golang 源码版本 go1.17.12。
// src/runtime/pprof/pprof.go:708
func writeRuntimeProfile(w io.Writer, debug int, name string, fetch func([]runtime.StackRecord, []unsafe.Pointer) (int, bool)) error {
	var p []runtime.StackRecord
	var labels []unsafe.Pointer
	n, ok := fetch(nil, nil)
	for {
		p = make([]runtime.StackRecord, n+10)
		labels = make([]unsafe.Pointer, n+10)
		n, ok = fetch(p, labels)
		if ok {
			p = p[0:n]
			break
		}
	}
	return printCountProfile(w, debug, name, &runtimeProfile{p, labels})
}
让我们来分析下这个函数,函数会传递一个fetch 方法,goroutine和threadcreate信息在输出时选择了不同的fetch方法来获取到各自的信息。
为了对主干代码有比较清晰的认识,先暂时不看fetch方法的具体实现,此时我们只需要知道,fetch方法可以将需要的指标信息 获取到,并且将信息的堆栈存到变量名为p的堆栈类型的切片里,然后将labels信息,存储到
变量名为labels的切片里。
注意: 只有goroutine类型的指标才有labels信息
获取到了堆栈信息,labels 信息,接着就是要将这些信息进行输出了,进行输出的函数是 上述源码里的最后一行 中 的printCountProfile 函数。
printCountProfile 函数的逻辑比较简单,我简单概括下,输出的时候会将 printCountProfile 参数中的堆栈信息连同labels构成的结构体 进行遍历, 堆栈信息和labels信息组合作为key,对相同key的内容进行累加计数。最后 printCountProfile 将根据debug的值的不同选择不同的输出方式,例如debug=0是二进制文件下载 方式 ,debug=1则是 网页文本可读方式进行输出
至此,对goroutine和threadcreate 指标信息的输出过程应该有了解了,即通过fetch方法获取到指标信息,然后通过printCountProfile 方法对指标信息进行输出。
fetch 方法的具体实现,我们还没有开始介绍,现在来看看,goroutine和threadcreate信息在输出时选择了不同的fetch方法来获取到各自的信息。
源码如下:
// src/runtime/pprof/pprof.go:661
func writeThreadCreate(w io.Writer, debug int) error {
	return writeRuntimeProfile(w, debug, "threadcreate", func(p []runtime.StackRecord, _ []unsafe.Pointer) (n int, ok bool) {
		return runtime.ThreadCreateProfile(p)
	})
}

// src/runtime/pprof/pprof.go:680
func writeGoroutine(w io.Writer, debug int) error {
	if debug >= 2 {
		return writeGoroutineStacks(w)
	}
	return writeRuntimeProfile(w, debug, "goroutine", runtime_goroutineProfileWithLabels)
}
goroutine 指标信息在输出时,会选择runtime_goroutineProfileWithLabels函数来获取goroutine指标,而threadcreate 则会调用 runtime.ThreadCreateProfile(p) 去获取threadcreate指标信息。
goroutine fetch 函数实现
runtime_goroutineProfileWithLabels 方法的实现是由go:linkname 标签链接过去的,实际底层实现的方法是 runtime_goroutineProfileWithLabels。
// src/runtime/mprof.go:744
//go:linkname runtime_goroutineProfileWithLabels runtime/pprof.runtime_goroutineProfileWithLabels
func runtime_goroutineProfileWithLabels(p []StackRecord, labels []unsafe.Pointer) (n int, ok bool) {
	return goroutineProfileWithLabels(p, labels)
}
goroutineProfileWithLabels 就是实际获取goroutine堆栈和标签的方法了。
我们往goroutineProfileWithLabels 传递了两个数组,分别用于存储堆栈信息,和labels信息,而goroutineProfileWithLabels 则负责将两个数组填充上对应的信息。
goroutineProfileWithLabels 的逻辑也比较容易,我这里仅仅简单概括下,其内部会通过一个全局变量allgptr 去遍历所有的协程,allgptr 保存了程序中所有的协程的地址, 而协程的结构体g内部,有一个叫做label的属性,这个值就代表协程的标签值,在遍历协程时,通过该属性便可以获取到标签值了。
threadcreate fetch 函数实现
runtime.ThreadCreateProfile 是 获取threadcreate 指标的方法。
源码如下:
func ThreadCreateProfile(p []StackRecord) (n int, ok bool) {
	first := (*m)(atomic.Loadp(unsafe.Pointer(&allm)))
	for mp := first; mp != nil; mp = mp.alllink {
		n++
	}
	if n <= len(p) {
		ok = true
		i := 0
		for mp := first; mp != nil; mp = mp.alllink {
			p[i].Stack0 = mp.createstack
			i++
		}
	}
	return
}
首先是获取到allm变量的地址,allm是一个全局变量,它其实是 存储所有m链表 的表头元素。
// src/runtime/runtime2.go:1092
var (
	allm       *m
	.....
在golang里,每创建一个m结构便会在底层创建一个系统线程,所以你可以简单的认为m就是代表了一个线程。可以之后深入了解下gpm模型。
for mp := first; mp != nil; mp = mp.alllink {
			p[i].Stack0 = mp.createstack
			i++
		}
然后 ThreadCreateProfile 里 这段逻辑就是遍历了整个m链表,将m结构体保存的堆栈信息赋值给 参数p,p则是我们需要填充的堆栈信息数组,在m结构体里,alllink是一个指向链表下一个元素的指针,每次新创建m时,会将新m插入到表头位置,然后更新allm变量。
至此,goroutine 和threadcreate的使用和原理都介绍完了,他们比起之前的memory,block之类的统计相对来说比较简单,简而言之就是遍历一个全局变量allgptr或者allm ,遍历时获取到协程或者线程的堆栈信息和labels信息,然后将这些信息进行输出即可。
Recommend
About Joyk
Aggregate valuable and interesting links.
Joyk means Joy of geeK