

API with NestJS #97. Introduction to managing logs with Amazon CloudWatch
source link: https://wanago.io/2023/02/27/nestjs-api-aws-cloudwatch-amazon/
Go to the source link to view the article. You can view the picture content, updated content and better typesetting reading experience. If the link is broken, please click the button below to view the snapshot at that time.
API with NestJS #97. Introduction to managing logs with Amazon CloudWatch
In this series, we’ve learned how to use the logger built into NestJS. In this article, we learn how to manage the logs our NestJS application produces using Amazon CloudWatch.
In this article, we assume you’re familiar with deploying NestJS applications using Amazon Elastic Constainer Service. If you want to know more about this topic, check out the following articles:
Improving the way we deploy with CI/CD
In one of the recent parts of this series, we learned how to deploy our NestJS application automatically every time there are new changes in the master branch of our repository.
To do that, we configured GitHub Actions in the following way:
- name: Update ECS service run: | aws ecs update-service --cluster nest_cluster --service nestjs_service --task-definition nest_task --force-new-deployment |
The downside is that it forces us to always use the exact name of the AWS cluster, service, and task definition. Fortunately, we can quickly improve that using environment variables.
First, we need to go to the settings of our GitHub repository and open the Variables tab on the Secrets and Variables page. There, we need to add three variables:
- AWS_CLUSTER_NAME
- AWS_SERVICE_NAME
- AWS_TASK_DEFINITION_NAME
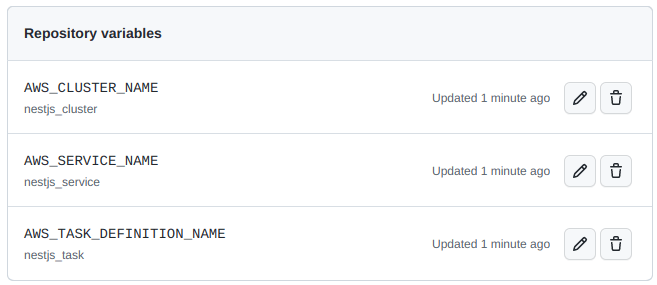
Now, we can modify the GitHub Actions configuration and use our variables through the vars property.
- name: Update ECS service run: | aws ecs update-service \ --cluster ${{ vars.AWS_CLUSTER_NAME }} \ --service ${{ vars.AWS_SERVICE_NAME }} \ --task-definition ${{ vars.AWS_TASK_DEFINITION_NAME }} \ --force-new-deployment |
Thanks to doing the above, we can effortlessly change the cluster, service, and task definition without changing our GitHub Actions configuration.
Adding logging to our NestJS application
When we deploy our application, people start using it and depending on it. Therefore, it’s crucial to have mechanisms that help us monitor it and ensure it’s working as expected. One of them is the feature of storing and accessing the logs.
The most straightforward logging we can implement in a NestJS application includes printing information about clients calling our API. To implement it, let’s create an interceptor.
logger.interceptor.ts
import { Injectable, NestInterceptor, ExecutionContext, CallHandler, Logger, } from '@nestjs/common'; import { Request, Response } from 'express'; @Injectable() export class LoggerInterceptor implements NestInterceptor { private readonly logger = new Logger('HTTP'); intercept(context: ExecutionContext, next: CallHandler) { const httpContext = context.switchToHttp(); const request = httpContext.getRequest<Request>(); const response = httpContext.getResponse<Response>(); response.on('finish', () => { const { method, originalUrl } = request; const { statusCode, statusMessage } = response; const message = `${method} ${originalUrl} ${statusCode} ${statusMessage}`; if (statusCode >= 500) { return this.logger.error(message); if (statusCode >= 400) { return this.logger.warn(message); return this.logger.log(message); return next.handle(); |
If you want to know more about the logger built into NestJS and how the above interceptor works, check out the following articles:
To use our interceptor in all our endpoints, we need to add it to our bootstrap function.
import { NestFactory } from '@nestjs/core'; import { AppModule } from './app.module'; import * as cookieParser from 'cookie-parser'; import { LogLevel, ValidationPipe } from '@nestjs/common'; import { ConfigService } from '@nestjs/config'; import { LoggerInterceptor } from './utils/logger.interceptor'; async function bootstrap() { const isProduction = process.env.NODE_ENV === 'production'; const logLevels: LogLevel[] = isProduction ? ['error', 'warn', 'log'] : ['error', 'warn', 'log', 'verbose', 'debug']; const app = await NestFactory.create(AppModule, { logger: logLevels, const configService = app.get(ConfigService); app.useGlobalPipes( new ValidationPipe({ transform: true, app.use(cookieParser()); app.useGlobalInterceptors(new LoggerInterceptor()); await app.listen(configService.get('PORT')); bootstrap(); |
When we do that, our NestJS application logs a message every time someone uses our API.
[NestApplication] Nest application successfully started +3ms
[HTTP] GET /posts 200 OK
Introducing Amazon CloudWatch
AWS includes the Amazon CloudWatch service that we can use to monitor our applications. With it, we can collect and visualize real-time logs and metrics through the AWS dashboard.
In the previous parts of this series, we created a task definition that describes how a docker container should launch in our cluster. We can modify it slightly to set up logs with CloudWatch.
To do that, let’s open the existing task definition, select the latest revision, and click “Create new revision”.

A straightforward way of reaching the necessary interface is switching off the “New ECS Experience” in the top left corner.

We now need to scroll down to the definition of our container.

When we click on the name of our container, a popup appears. When we scroll down to the “Storage and logging” section, we can find the log configuration.

The “awslogs” driver
When using Elastic Container Service, we run our Docker images on machines operating with Linux. To handle input, output, and error messages, Linux uses data streams:
- standard output – stdout
- standard error – stderr
- standard input – stdin
Whenever we use console.log, Node.js uses stdout to print the message to our terminal. When we use the console.error function, Node.js writes to the stderr data stream. When we look under the hood of NestJS and its logger implementation, it also uses the stdout and stderr data streams by default.
When we check the “Auto-configure CloudWatch Logs” checkbox, AWS sets us up with the awslogs driver. It passes the stdout and stderr data streams from Docker to CloudWatch logs. Thanks to that, we don’t need to configure anything else.
When we create a task using a task definition configured to use CloudWatch, AWS creates a log stream for us. A log stream is a sequence of logs originating from the same source. Each log source in CloudWatch creates a separate log stream.
A log group is a collection of log streams. When we checked the “Auto-configure CloudWatch Logs” checkbox in our configuration, AWS associated our log stream with a particular log group. This log group is tied to our task definition.
![]()
Viewing the logs
As soon as our application runs, the data starts flowing in. There are a few ways to view it.
Firstly, we can go to the Elastic Container Service, open the service our task runs in, and go to the “Logs” tab.

In API with NestJS #94. Deploying multiple instances on AWS with a load balancer, we’ve learned how to deploy multiple instances of our application. Because of that, we can see numerous log sources in the above screenshot.
An alternative to the above approach to viewing logs is to open the CloudWatch dashboard and go to the log groups page.

On the above page, we can open a particular log group associated with our task definition. When we do that, we have the access to log streams of specific instances of our application.

Let’s open one of our streams and verify if our LoggerInterceptor works by providing a filter pattern.

Summary
In this article, we’ve gone through the basics of how CloudWatch works and how to use it for logging. To do that, we’ve added a logging interceptor to our NestJS application and configured the awslogs driver in our task definition. We’ve also explained the data streams in Linux and how they affect the awslogs driver. Finally, to confirm that our logging interceptor is working as expected, we’ve opened the CloudWatch driver and used an appropriate filter pattern to find the desired logs.
There are more ways to take advantage of the CloudWatch service when working with NestJS applications, so stay tuned!
Series Navigation<< API with NestJS #96. Running unit tests with CI/CD and GitHub Actions
Recommend
About Joyk
Aggregate valuable and interesting links.
Joyk means Joy of geeK