
4

kube-state-metrics 在大规模集群下的优化
source link: https://www.51cto.com/article/746688.html
Go to the source link to view the article. You can view the picture content, updated content and better typesetting reading experience. If the link is broken, please click the button below to view the snapshot at that time.

kube-state-metrics 在大规模集群下的优化-51CTO.COM
$ kubectl get deploy -n kube-system kube-state-metrics
NAME                 READY   UP-TO-DATE   AVAILABLE   AGE
kube-state-metrics   1/1     1            1           2m49s
$ kubectl get pods -n kube-system -l app.kubernetes.io/name=kube-state-metrics
NAME                                  READY   STATUS    RESTARTS   AGE
kube-state-metrics-548546fc89-zgkx5   1/1     Running   0          2m51s
然后只需要让 Prometheus 来发现 KSM 实例就可以了,当然有很多方式,比如可以通过添加注解来自动发现,也可以单独为 KSM 创建一个独立的 Job,如果使用的是 Prometheus Operator,也可以创建 ServiceMonitor 对象来获取 KSM 指标数据。
这种方式对于小规模集群是没太大问题的,数据量不大,可以正常提供服务,只需要保证 KSM 高可用就可以在生产环境使用了。但是对于大规模的集群来说,就非常困难了,比如我们这里有一个 8K 左右 Pod 的集群,不算特别大。
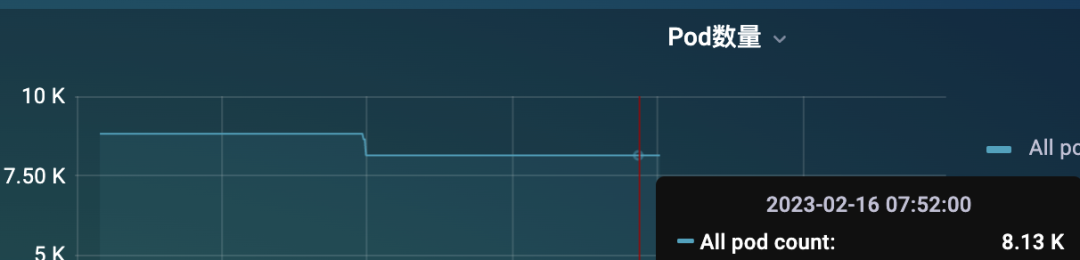
但是只通过一个 KSM 实例来提供 metrics 指标还是非常吃力的,这个时候可能大部分情况下是获取不到指标的,因为 metrics 接口里面的数据量太大了。
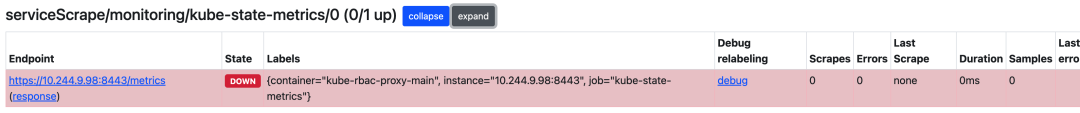
即使偶尔获取到了,也需要话花很长时间,要知道我们会每隔 scrape_interval 的时间都会去访问该指标接口的,可能前面一次请求还没结束,下一次请求又发起了,要解决这个问题就得从 KSM 端入手解决,在 KSM 的启动参数中我们可以配置过滤掉一些不需要的指标标签:
$ kube-state-metrics -h
kube-state-metrics is a simple service that listens to the Kubernetes API server and generates metrics about the state of the objects.

Usage:
  kube-state-metrics [flags]
  kube-state-metrics [command]

Available Commands:
  completion  Generate completion script for kube-state-metrics.
  help        Help about any command
  version     Print version information.

Flags:
      --add_dir_header                             If true, adds the file directory to the header of the log messages
      --alsologtostderr                            log to standard error as well as files (no effect when -logtostderr=true)
      --apiserver string                           The URL of the apiserver to use as a master
      --config string                              Path to the kube-state-metrics options config file
      --custom-resource-state-config string        Inline Custom Resource State Metrics config YAML (experimental)
      --custom-resource-state-config-file string   Path to a Custom Resource State Metrics config file (experimental)
      --custom-resource-state-only                 Only provide Custom Resource State metrics (experimental)
      --enable-gzip-encoding                       Gzip responses when requested by clients via 'Accept-Encoding: gzip' header.
  -h, --help                                       Print Help text
      --host string                                Host to expose metrics on. (default "::")
      --kubeconfig string                          Absolute path to the kubeconfig file
      --log_backtrace_at traceLocation             when logging hits line file:N, emit a stack trace (default :0)
      --log_dir string                             If non-empty, write log files in this directory (no effect when -logtostderr=true)
      --log_file string                            If non-empty, use this log file (no effect when -logtostderr=true)
      --log_file_max_size uint                     Defines the maximum size a log file can grow to (no effect when -logtostderr=true). Unit is megabytes. If the value is 0, the maximum file size is unlimited. (default 1800)
      --logtostderr                                log to standard error instead of files (default true)
      --metric-allowlist string                    Comma-separated list of metrics to be exposed. This list comprises of exact metric names and/or regex patterns. The allowlist and denylist are mutually exclusive.
      --metric-annotations-allowlist string        Comma-separated list of Kubernetes annotations keys that will be used in the resource' labels metric. By default the metric contains only name and namespace labels. To include additional annotations provide a list of resource names in their plural form and Kubernetes annotation keys you would like to allow for them (Example: '=namespaces=[kubernetes.io/team,...],pods=[kubernetes.io/team],...)'. A single '*' can be provided per resource instead to allow any annotations, but that has severe performance implications (Example: '=pods=[*]').
      --metric-denylist string                     Comma-separated list of metrics not to be enabled. This list comprises of exact metric names and/or regex patterns. The allowlist and denylist are mutually exclusive.
      --metric-labels-allowlist string             Comma-separated list of additional Kubernetes label keys that will be used in the resource' labels metric. By default the metric contains only name and namespace labels. To include additional labels provide a list of resource names in their plural form and Kubernetes label keys you would like to allow for them (Example: '=namespaces=[k8s-label-1,k8s-label-n,...],pods=[app],...)'. A single '*' can be provided per resource instead to allow any labels, but that has severe performance implications (Example: '=pods=[*]'). Additionally, an asterisk (*) can be provided as a key, which will resolve to all resources, i.e., assuming '--resources=deployments,pods', '=*=[*]' will resolve to '=deployments=[*],pods=[*]'.
      --metric-opt-in-list string                  Comma-separated list of metrics which are opt-in and not enabled by default. This is in addition to the metric allow- and denylists
      --namespaces string                          Comma-separated list of namespaces to be enabled. Defaults to ""
      --namespaces-denylist string                 Comma-separated list of namespaces not to be enabled. If namespaces and namespaces-denylist are both set, only namespaces that are excluded in namespaces-denylist will be used.
      --node string                                Name of the node that contains the kube-state-metrics pod. Most likely it should be passed via the downward API. This is used for daemonset sharding. Only available for resources (pod metrics) that support spec.nodeName fieldSelector. This is experimental.
      --one_output                                 If true, only write logs to their native severity level (vs also writing to each lower severity level; no effect when -logtostderr=true)
      --pod string                                 Name of the pod that contains the kube-state-metrics container. When set, it is expected that --pod and --pod-namespace are both set. Most likely this should be passed via the downward API. This is used for auto-detecting sharding. If set, this has preference over statically configured sharding. This is experimental, it may be removed without notice.
      --pod-namespace string                       Name of the namespace of the pod specified by --pod. When set, it is expected that --pod and --pod-namespace are both set. Most likely this should be passed via the downward API. This is used for auto-detecting sharding. If set, this has preference over statically configured sharding. This is experimental, it may be removed without notice.
      --port int                                   Port to expose metrics on. (default 8080)
      --resources string                           Comma-separated list of Resources to be enabled. Defaults to "certificatesigningrequests,configmaps,cronjobs,daemonsets,deployments,endpoints,horizontalpodautoscalers,ingresses,jobs,leases,limitranges,mutatingwebhookconfigurations,namespaces,networkpolicies,nodes,persistentvolumeclaims,persistentvolumes,poddisruptionbudgets,pods,replicasets,replicationcontrollers,resourcequotas,secrets,services,statefulsets,storageclasses,validatingwebhookconfigurations,volumeattachments"
      --shard int32                                The instances shard nominal (zero indexed) within the total number of shards. (default 0)
      --skip_headers                               If true, avoid header prefixes in the log messages
      --skip_log_headers                           If true, avoid headers when opening log files (no effect when -logtostderr=true)
      --stderrthreshold severity                   logs at or above this threshold go to stderr when writing to files and stderr (no effect when -logtostderr=true or -alsologtostderr=false) (default 2)
      --telemetry-host string                      Host to expose kube-state-metrics self metrics on. (default "::")
      --telemetry-port int                         Port to expose kube-state-metrics self metrics on. (default 8081)
      --tls-config string                          Path to the TLS configuration file
      --total-shards int                           The total number of shards. Sharding is disabled when total shards is set to 1. (default 1)
      --use-apiserver-cache                        Sets resourceVersinotallow=0 for ListWatch requests, using cached resources from the apiserver instead of an etcd quorum read.
  -v, --v Level                                    number for the log level verbosity
      --vmodule moduleSpec                         comma-separated list of pattern=N settings for file-filtered logging

Use "kube-state-metrics [command] --help" for more information about a command.Recommend
About Joyk
Aggregate valuable and interesting links.
Joyk means Joy of geeK