

A Look at Gender Demographics in the Developer Community, Part 1
source link: https://dev.to/sachagreif/a-look-at-gender-demographics-in-the-developer-community-part-1-4d76?ref=sidebar
Go to the source link to view the article. You can view the picture content, updated content and better typesetting reading experience. If the link is broken, please click the button below to view the snapshot at that time.

Posted on Feb 13
A Look at Gender Demographics in the Developer Community, Part 1
I run the annual State of JavaScript developer survey, and I was thrilled to see survey respondents more than double this year from 16,085 in 2021 to 39,471 in 2022.
Yet despite that big increase one thing that remains constant is that only 7% of respondents identify as women, non-binary, or gender-non-conforming.
A consequence of such a skewed ratio is that the opinion of people who identify as men risks drowning out all other voices. So to combat this, I've been focusing on creating new filtering tools to make these voices louder.
Today, I want to show you how I used these tools to dig deeper into the survey's data, and then broadened my research by asking other communities, platforms, and content creators about their own audience demographics.
Two Important Notes About Gender
This post will focus on men vs women, and I am well aware that reducing gender to a dichotomy is both factually inaccurate, and also very unfair to the many people who don't fit into said dichotomy.
Sadly, when it comes to non-binary or gender non-conforming audiences the State of JS survey doesn't provide us with a lot of data. For that reason, I have decided to focus primarily on women as a first step.
Additionally, I know that the vocabulary around gender is often the subject of contention and debate. So if I happen to mis-use a term while discussing these issues or mis-gender an individual, please let me know in the comments so that I can fix it.
Introducing Filters
Our internal API has long supported complex filters, and starting today you can now control them right from the survey's UI:
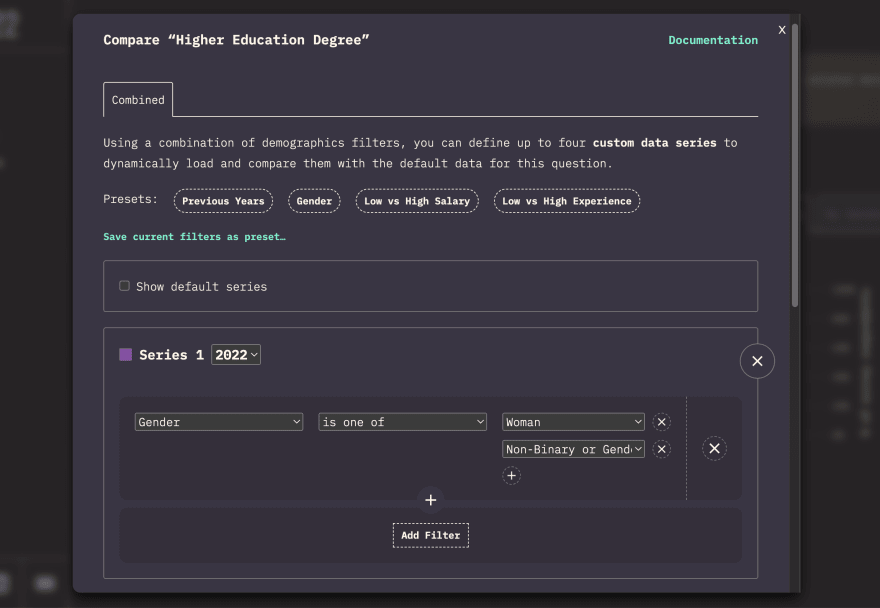
The new State of JS/CSS filters.
These new filters work on most of the State of JS 2022 charts, as well as on the State of CSS 2022 report. One thing you can do with them is take a chart, and create variations for different subpopulations in order to compare how values differ among them:
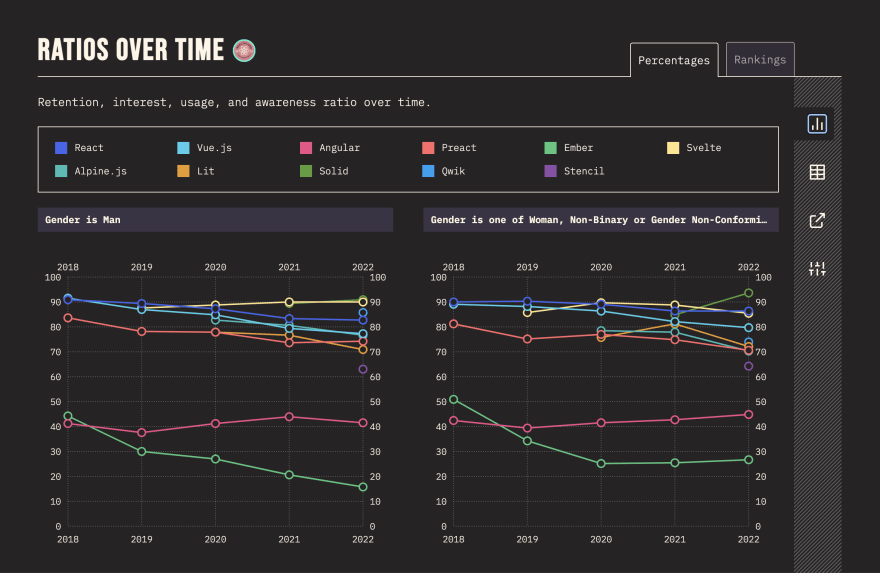
State of JS 2022: Front-end Frameworks retention %, men vs non-men.
Alternatively, you can take a chart and break down each bar according to a variable such as gender:

State of JS 2022: First learning steps broken down by gender.
You can learn more about these filtering features in our documentation.
An Outlier Appears
You might have noticed the high proportion of women having gone through coding bootcamp as a first step to learning JavaScript in the chart above, and it was while applying that same "faceting" feature to various charts that I stumbled on another outlier:

State of JS 2022: Scrimba stands out among learning platforms.
The e-learning platform Scrimba was apparently doing a much better job of appealing to women than its competitors!
This immediately brought many questions to mind:
- Why were some platforms doing better than others in terms of inclusivity?
- How did other programming-focused communities compare in terms of gender ratio?
- Why was the gender ratio so skewed in the first place?
Why This Article?
When sharing drafts of this article, the most common reaction I got was something along the line of "Why are you doing this? You should focus on improving your own survey's inclusivity instead of looking for excuses elsewhere!"
And I think that's quite understandable. But I want to make it clear that I am not writing this to abdicate responsibility for the survey's own demographics in any way. No matter how generalized the gender imbalance issue may be, I know I still have a duty to try and improve things at my own level.
Moreover, this article itself is actually part of these inclusivity efforts. My hope is that writing about the gender imbalance issue will help me reach the very audience that is currently under-represented in the survey, and if not encourage them to participate in future surveys or, at the very least, make them aware that the survey exists.
With this out of the way, let's get to the data!
Surveys
As I said earlier, from the start the State of JavaScript survey has struggled to attract women respondents.

State of JS 2022: 93% of question respondents identify as men.
And even though these numbers are quite bad, it does seem like they are in line with other comparable surveys.
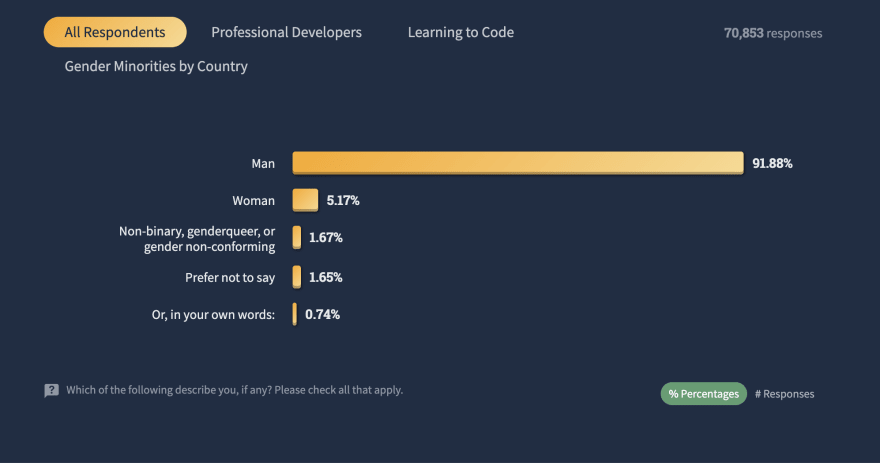
The 2022 Stack Overflow survey reported a 91% ratio of respondents identifying as men) out of 70,853 responses.
And the JetBrains survey found a similar 93% ratio of male respondents.

Things are slightly better over in CSS land, where the 2022 State of CSS survey reported a 88% ratio of respondents identifying as men.

State of CSS 2022: 88% of question respondents identify as a man.
But it's quite possible that all of these surveys share common biases due to their similar methodologies, so I wanted to broaden my research beyond online surveys, which is how I ended up focusing on online education.
Why Educators
Among the users who completed the 2022 State of JS survey, we saw the highest percentage of gender and race diversity in the lower end of the "years of experience" spectrum.
If we can make sure this new generation of developers isn't turned away by entrenched biases, this could prove to be a great opportunity to make the industry more diverse:
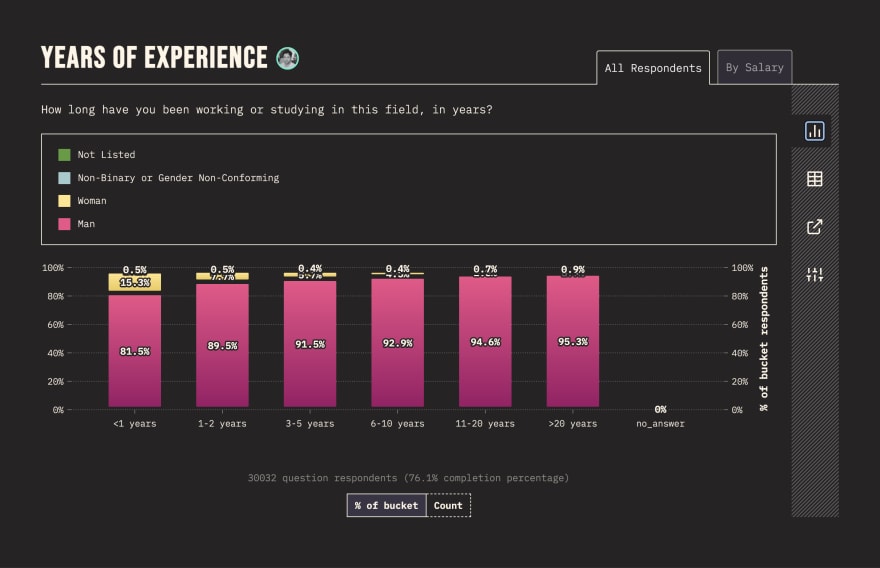
State of JS 2022: lower experience brackets have a higher proportion of women.
So I decided to focus on educational content in the hopes of highlighting that more diverse segment since this content can often serve as an entryway into the community for people looking to learn JavaScript.
Moreover, today's educational content creators also operate at a larger scale than almost anybody else. Recent surveys have made it obvious just how large an audience YouTubers can command, with Kevin Powell for example being responsible for 10% of all 2022 State of CSS respondents!
And education is also a space that shows a lot of promise in terms of inclusion: many women have managed to create a sizeable following by creating awesome programming content, including Techworld with Nana, CodeBeauty, Mayuko, Coder Coder, Ania Kubow, Tina Huang, and many more.
YouTube
Fireship
With 1.8M subscribers, Fireship is by far the largest coding YouTuber around, with popular videos regularly crossing the 1M mark.
As a reminder, the 2022 edition of the State of JavaScript survey got around 40k respondents. In other words, a single Fireship video can offer an audience sample size 25 times larger than an entire survey!
Sadly, the channel's demographics reveal the same bias as the survey, with a 94% male audience.

But maybe Fireship is an outlier? Let's keep digging to find out!
Web Dev Simplified
Web Dev Simplified has 1.2M subscribers, and their demographics stats confirm the trend with a similarly skewed 91% men ratio:

Jack Herrington
Medium-sized channels are no different. Jack Herrington is a popular YouTuber with over 100k subscribers who covers mostly front-end and web development topics and whose videos routinely get over 50k views.
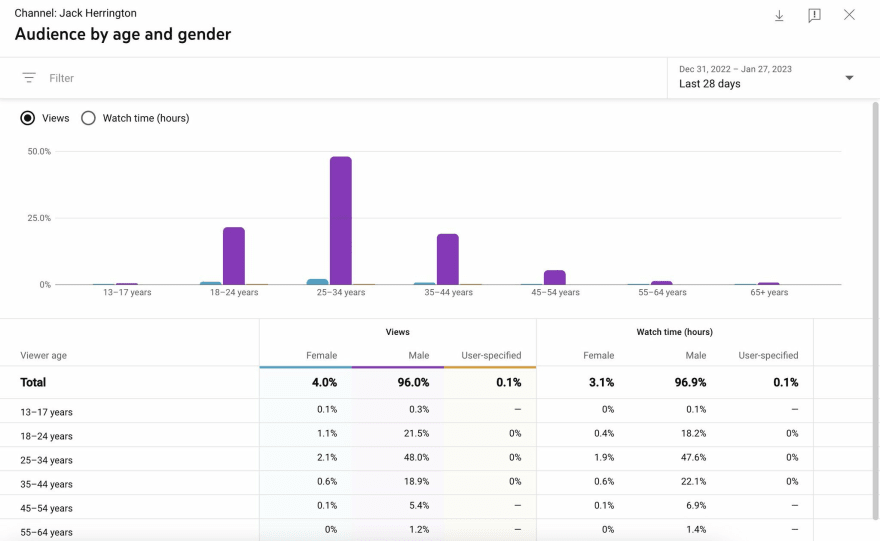
According to YouTube statistics, his audience is 96% male. From the number alone, you might think Jack spends his videos talking about professional football, beard grooming, Joe Rogan, and other stereotypically male preoccupations. But nothing could be further from the truth.
I asked Jack if he was conscious of this issue, and here's what he had to say:
100% yes, and from the beginning I've made specific content choices to address that.
I use they/them pronouns in regards to all generic role types in an organization, including engineers. I very strongly skew against the "brogrammer" culture (which I despise anyway).
In general I just try to visualize that the viewer is by default a woman.
Jack also informed me he intends to do more collaboration with women on his channel going forward and it'll be interesting to see if that moves the needle.
This is heartwarming since it shows that there are at least some YouTubers putting efforts towards inclusivity, but at the same time the fact that those efforts don't seem to have a strong impact is a bit depressing…
Other Channels
As additional datapoints, Wes Bos revealed that his YouTube audience is 96% male, while Kent C. Dodds has a 93% male ratio.
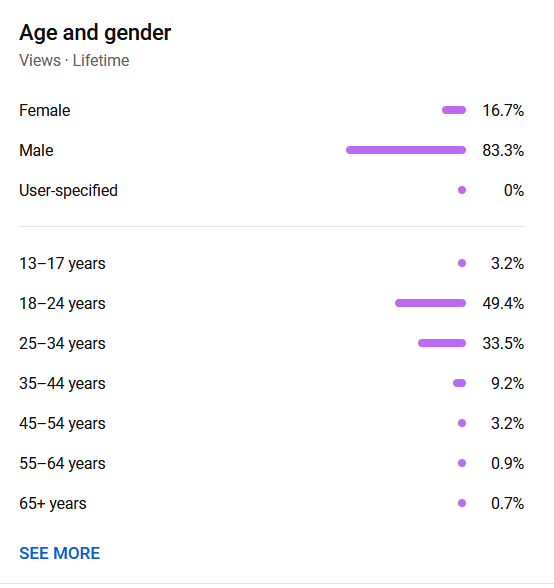
Coder Coder
You might have noticed that the YouTubers featured so far present as men. So what about creators who identify as women? It turns out that Jess Chan's Coder Coder channel has a much higher ratio of women in its audience, with a comparatively low 83.3% proportion of men:
As Jess points out, this is both due to focusing on introductory content, and a consequence of who they are:
When it comes to creating my coding tutorials, the only factors about my audience that I consider is that they are mostly beginner level, self-taught web developers. I don't cater the content to one or another demographic, I just stick to making educational content.
However, as someone who is visibly different from the majority white, male-presenting creators, I feel like just existing on YouTube is my way of representing minority and marginalized groups. In some anecdotal demographic comparisons, I have significantly more viewers from Asian countries and viewers who identify as female. This is no coincidence, because we will naturally gravitate to people who look like us.
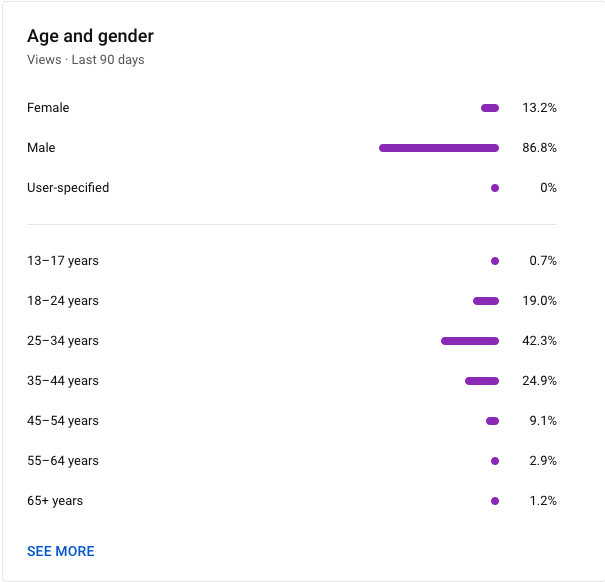
TechWorld With Nana
With 742k subscribers, TechWorld With Nana ranks among the largest programming-focused YouTube channels out there, and popular videos can even cross the 1M views mark.
The channel features demographic stats that are very similar to Coder Coder's, with 86.8% of men in its audience:
At this stage it's hard to say whether the two women-hosted channels' more diverse audiences are the result of gender, a focus on introductory content, or both. But it's certainly interesting to notice such a clear separation with channels hosted by men in terms of demographics.
The YouTube Factor
At this point there's something else that is important to highlight: it's hard to know how much influence YouTube itself is having on these stats.
Although YouTube claims that “>50% of [their] audience is female”, the YouTube algorithm can potentially bias video recommendations (for example, it might have decided not to show programming-related videos to women). Also, we don't really know what logic YouTube uses to determine a viewer's gender.
So while YouTube stats can be interesting (especially since few people proactively track their audience's gender stats otherwise), it's also good to keep these caveats in mind.
Note that one way of getting more reliable data is actually through the surveys themselves. For example, since Fireship used a special ?source=fireship tag when linking to the survey, we are able to segment the sub-group of people who followed that link and filter it by gender, which in this case confirms Fireship's own YouTube stats:

State of JS 2022: 95% of respondents who found the survey through Fireship identify as a man.
More Women Voices
I want to take a moment to address the scarcity of women voices in this very article. I have reached out to more women creators, and I am hoping to include their data in Part 2.
This is also a good place to talk about the lack of women and non-binary video creators in a recent State of JavaScript 2022 question, which raised some concern about the survey's inclusivity.
This was the first year this new question was introduced, and I completely agree that I didn't put in enough work to ensure that the list was accurate and representative.
This was careless on my part and sent the wrong message to an already-minoritized demographic, and I appreciate those who took the time to rightfully call out this oversight. Going forward I will improve the list, and make an effort to clarify and spell out criteria for inclusion for survey items.
Stay Tuned
Stay tuned for part 2 where I:
- Follow-up with Scrimba to know more about their audience.
- Get data for one of the largest e-learning communities around.
- Talk with an independent teacher and creator about how they their personal brand and voice relates to being inclusive.
- Try to identify which "funnel" is responsible for the lack of women in developer surveys.
- Share my overall takeaways.
Until then, let me know what you think of this whole enterprise by leaving a comment here or pinging me on Mastodon – especially if you've got stats of your own you'd like to add to the set!
Cover image created using Chromata by Michael Bromley.
Thanks to Jeff Delaney, Kyle Cook, Jack Herrington, Jess Chan, Nicole Hiller, Per Harald Borgen, Wes Bos, Kent C. Dodds, Quincy Larson and Josh Comeau for being willing to share their data and feedback.
And huge thanks to Martin Heidegger, Stephanie Tuerk, Jess Chan, Sameera Kapila, and Sophonie Bazile for reviewing drafts of this posts.
Recommend
About Joyk
Aggregate valuable and interesting links.
Joyk means Joy of geeK