

A random walk inside a heart
source link: http://saslist.com/blog/2023/02/08/a-random-walk-inside-a-heart/
Go to the source link to view the article. You can view the picture content, updated content and better typesetting reading experience. If the link is broken, please click the button below to view the snapshot at that time.
A random walk inside a heart » SAS博客列表
SAS programmers love to make special graphs for Valentine's Day. In fact, there is a long history of heart-shaped graphs and love-inspired programs written in SAS! Last year, I added to the collection by showing how a ball bounces on a heart-shaped billiards table. This year, I create a similar image, but one that is stochastic instead of deterministic. This year's image is a random walk in a heart-shaped region.
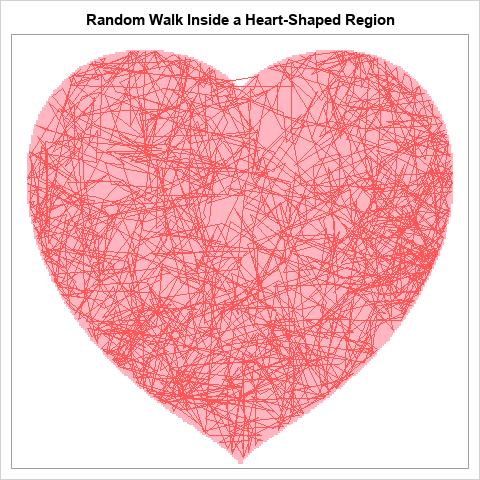
In the figure to the right, the red lines trace the path of a random walk that starts in the middle of the heart. For each step, the new location is determined by a random bivariate normal vector. That is, from the position (x,y), the next location is (x+dx, y+dy) where (dx, dy) is a random bivariate normal vector. If the next location would be outside of the heart-shaped region, then shorten the step and land on the boundary. The figure shows the path of a constrained random walk for 2000 steps.
Perhaps this image is a visual metaphor for randomly exploring love? Some readers will be content to view this image and reflect on the love in their lives. Others will want to learn more about how the image is created in SAS. If you are in the second group, read on!
An unconstrained random walk
Before I show how to constrain the random walk to stay inside the heart, let's create and visualize an unconstrained random walk. There are many kinds of random walks, but this one takes a step according to a random bivariate normal vector. Starting from a point (x,y), you generate a vector (dx,dy) ~ MVN(0, I(2)) and move to the new point (x+dx, y+dy). You repeat this process many time, then draw the path that results. The following SAS DATA step generates the random walk by using 0.2 as the standard deviation of each variate:
/* random 2-D walk where each step is a vector v, which is bivariate normal
   v ~ MVN(0, I(2)) */
data RandomWalk;
N = 2000;
call streaminit(12345);
x = 0; y = 0;
do i = 1 to N;
   dx = rand("Normal", 0, 0.2);
   dy = rand("Normal", 0, 0.2);
   x = x + dx;
   y = y + dy;
   output;
end;
keep x y;
run;
ods graphics / reset width=480px height=480px;
title "Random Walk with Bivariate Normal Steps";
proc sgplot data=RandomWalk;
   series x=x y=y / lineattrs=(color=lightred);
   xaxis grid;
   yaxis grid;
run; |
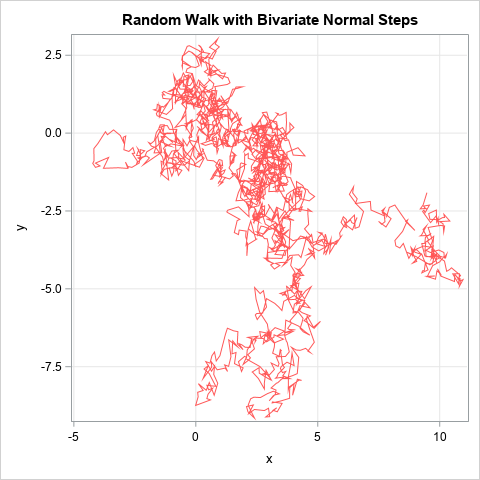
This graph displays a random walk with 2,000 steps, starting from the origin. Most of the time, the two consecutive points are close to each other. However, sometimes the next point is far away from the previous point.
A constrained random walk
Now imagine a variation on the previous random walk. The initial point is inside a compact closed region. Instead of always moving from an initial point (x,y) to a final point (x+dx, y+dy), you compute whether the final point is inside the region. If so, move to the point. If not, truncate the step so that you land on the boundary of the region. Repeat this many times to obtain a constrained random walk that is always inside the region.
For Valentine's Day, I will choose the region to be heart-shaped. It is easiest to perform these computations in the SAS IML language. The following program defines a few helper functions and generates 2,000 points for the constrained random walk. The points are written to a SAS data set and overlaid on a graph of the heart-shaped region:
/* Instead of an unconstrained walk, at each step check whether the
   new location is outside of a region. If so, truncate the step to
   land on the boundary of the region. */
proc iml;
/* define the heart-shaped region */
start H(xy);
  x = xy[,1]; y = xy[,2];
  return ( (x**2 + y**2 - 1)**3 - x**2 * y**3 );
finish;

/* return 1 if (x,y) is inside the region */
start InRegion(xy, tol=1e-14);
  return (H(xy) <= tol);
finish;

/* given a point, x, and a vector, v, this function returns the function
   f(t) = H(x + t*v), t in [0,1]. If f has a root, then the line segment from
   x to x+v intersects the boundary of the reqion.
   This function is used by FROOT to find points on the boundary of the region. */
start OnBoundary(t) global(G_x, G_v);
  return ( H( G_x + t*G_v ) );
finish;

/* Start at x. Try to step to x+v.
   If x+v is in the region, take the step.
   Otherwise, see if we can take part of the step to land on the boundary. */
start StepInRegion(x, v) global(G_x, G_v);
   if InRegion(x + v) then
      return (x + v);
   if InRegion(x) then do;
      G_x = x; G_v = v;
      /* does the line from x to x+v cross the boundary? */
      t = froot("OnBoundary", {0 1});  /* find intersection of line and region */
      if t > 0 then
         return (x + t*v);       /* step onto the boundary */
      else
         return (x);             /* cannot step in this direction */
   end;
   /* something is wrong: x is not in the region */
   return ( {. .} );
finish;

N = 2000;
call randseed(12345);
vel = randfun(N//2, "Normal", 0, 0.2);

x = j(1, 2, 0);
create walk from x [c={x y}];
do i = 1 to N;
   x = StepInRegion(x, vel[i,]);
   append from x;
end;
close;
QUIT;

title "Random Walk Inside a Heart-Shaped Region";
proc sgplot data=Walk;
   series x=x y=y / lineattrs=(color=lightred);
run; |
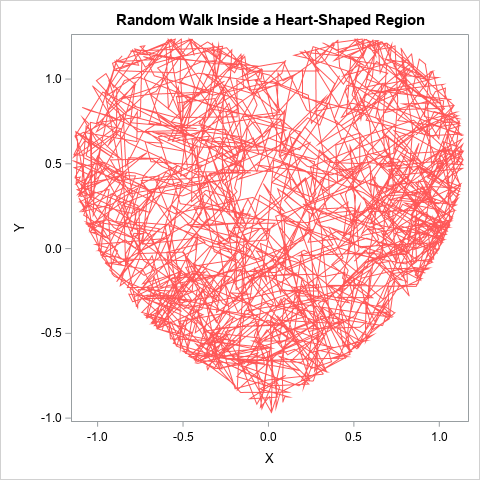
The trajectory of the random walk is shown for 2,000 random steps inside a heart-shaped region. You can carry out this computation for any compact region, provided that you can represent the region as the level set of some continuous function H(x,y)=0 that divides the plane into an inside region (where H(x,y) < 0) and an outside region (where H(x,y) > 0).
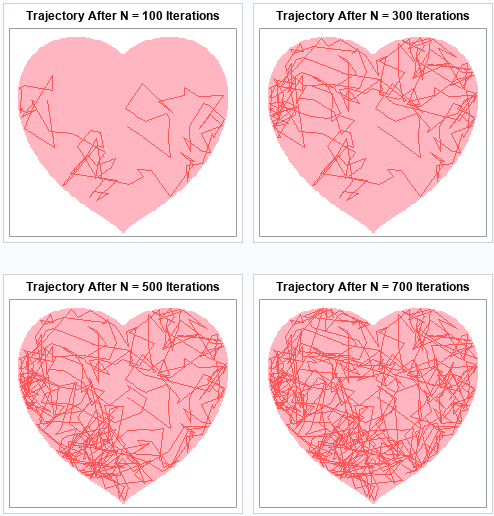
To visualize the heart-shaped region, you can overlay the trajectory on the region, as done at the top of this article. The images below visualize how the random walk evolves and gradually fills the region. For details about how these images were created, see the SAS program that creates these images.
Summary
It is easy to simulate an unconstrained random walk. This article shows how to use SAS to generate a random walk in which the points are contained in a compact region. During the simulation, you can monitor whether the next step will occur outside the region. If so, you can decrease the step so that the point is on the boundary of the region. This is illustrated by using a heart-shaped region, but the same algorithm can constrain the random walk to any compact region of the plane.
The post A random walk inside a heart appeared first on The DO Loop.
Posted by rick wicklin at 6:20 下午
Leave a Reply Cancel reply
Your Comment
You may use these HTML tags and attributes: <a href="" title=""> <abbr title=""> <acronym title=""> <b> <blockquote cite=""> <cite> <code> <del datetime=""> <em> <i> <q cite=""> <s> <strike> <strong>
Name (required)
E-mail (required)
URI
在此浏览器中保存我的姓名、电子邮件和站点地址。
Recommend
About Joyk
Aggregate valuable and interesting links.
Joyk means Joy of geeK