

记一次 .NET 某工控软件 内存泄露分析 - 一线码农
source link: https://www.cnblogs.com/huangxincheng/p/16954300.html
Go to the source link to view the article. You can view the picture content, updated content and better typesetting reading experience. If the link is broken, please click the button below to view the snapshot at that time.
1.讲故事
上个月 .NET调试训练营 里的一位老朋友给我发了一个 8G 的dump文件,说他的程序内存泄露了,一时也没找出来是哪里的问题,让我帮忙看下到底是怎么回事,毕竟有了一些调试功底也没分析出来,说明还是有一点复杂的,现实世界中的dump远比课上说的复杂的多。
还是那句话,找我分析是免费的,没有某软高额的工时费,接下来我们上 WinDbg 说话。
二:WinDbg 分析
1. 托管还是非托管泄露
这是我们首先就要做出的抉择,否则就会南辕北辙,可以使用 !address -summary & !eeheap -gc 来定位一下。
0:000> !address -summary

--- Usage Summary ---------------- RgnCount ----------- Total Size -------- %ofBusy %ofTotal
Free                                   1311     7ffc`e2b37000 ( 127.988 TB)           99.99%
<unknown>                              4799        2`4f798000 (   9.242 GB)  74.19%    0.01%
Heap                                   3029        0`906fe000 (   2.257 GB)  18.12%    0.00%
Image                                  3435        0`2b530000 ( 693.188 MB)   5.43%    0.00%
Stack                                   226        0`11e00000 ( 286.000 MB)   2.24%    0.00%
Other                                    90        0`0025c000 (   2.359 MB)   0.02%    0.00%
TEB                                      75        0`00096000 ( 600.000 kB)   0.00%    0.00%
PEB                                       1        0`00001000 (   4.000 kB)   0.00%    0.00%

--- Type Summary (for busy) ------ RgnCount ----------- Total Size -------- %ofBusy %ofTotal
MEM_PRIVATE                            7990        2`e6964000 (  11.603 GB)  93.14%    0.01%
MEM_IMAGE                              3445        0`2b536000 ( 693.211 MB)   5.43%    0.00%
MEM_MAPPED                              220        0`0b61f000 ( 182.121 MB)   1.43%    0.00%

--- State Summary ---------------- RgnCount ----------- Total Size -------- %ofBusy %ofTotal
MEM_FREE                               1311     7ffc`e2b37000 ( 127.988 TB)           99.99%
MEM_COMMIT                             8158        1`cf52a000 (   7.239 GB)  58.11%    0.01%
MEM_RESERVE                            3497        1`4df8f000 (   5.218 GB)  41.89%    0.00%

0:000> !eeheap -gc
Number of GC Heaps: 1
generation 0 starts at 0x0000023ba303e940
generation 1 starts at 0x0000023ba2ebd0d0
generation 2 starts at 0x00000239a80f1000
ephemeral segment allocation context: none
...
Large object heap starts at 0x00000239b80f1000
         segment             begin         allocated              size
00000239b80f0000  00000239b80f1000  00000239bfe174a8  0x7d264a8(131228840)
0000023a6f050000  0000023a6f051000  0000023a73780800  0x472f800(74643456)
Total Size:              Size: 0xea9878f8 (3935860984) bytes.
------------------------------
GC Heap Size:            Size: 0xea9878f8 (3935860984) bytes.
从卦中的 MEM_COMMIT 和 GC Heap Size 这两个指标来看,主要还是托管内存泄露,虽然非托管内存也不小,大概率还是托管这边导致的,有了这些信息之后,后面就是看下 托管堆 到底都是些什么对象。
0:000> !dumpheap -stat
Statistics:
              MT    Count    TotalSize Class Name
...
00007ffa2d7a1080  4923008    118152192 System.WeakReference
00007ffa2d725e70  2224022    125834760 System.Object[]
00007ffa2701de10  1044218    133659904 System.Windows.Documents.Paragraph
00007ffa2706b470  1045023    142123128 System.Windows.Documents.Run
00007ffa2706a9b0  2098480    151090560 System.Windows.Documents.TextTreeTextNode
00007ffa2d7267d0  1138661    159949302 System.Char[]
00007ffa2d7259c0  1231039    160962948 System.String
00007ffa29580cd8      214    165608376 MS.Internal.WeakEventTable+EventKey[]
00007ffa2d729750  2116556    169324480 System.Collections.Hashtable
00007ffa2d724478  2117718    209740224 System.Collections.Hashtable+bucket[]
00007ffa2706eb08  4175733    367464504 System.Windows.Documents.TextTreeTextElementNode
00007ffa2700ca48  2088016    384194944 System.Windows.ResourceDictionary
00007ffa2957fdc8  2344569    405666920 System.Windows.EffectiveValueEntry[]
从卦中的 TotalSize 来看并没有明显的特征,但从 Count 看还是有一些蛛丝马迹的,比如 System.Windows.Documents.TextTreeTextElementNode 对象为什么高达 417w ? 为什么 System.Windows.Documents.TextTreeTextNode 有 209w ? 虽然都是 WPF 框架的内部类,但从名字上看貌似和 文本类 控件有关系。
2. TextTreeTextElementNode 为什么没被回收
有了这些可疑信息,接下来就需要看下他们为什么没有被 GC 收掉?要想找到答案就需要抽几个 TextTreeTextElementNode 看下用户根是什么?可以使用 !dumpheap -mt xxx 找到 address 之后再用 !gcroot 观察一下。
0:000> !dumpheap -mt 00007ffa2706eb08
         Address               MT     Size
00000239a815f028 00007ffa2706eb08       88
00000239a815f080 00007ffa2706eb08       88
00000239a815f2e8 00007ffa2706eb08       88
00000239a815f340 00007ffa2706eb08       88
00000239a8259f18 00007ffa2706eb08       88
...

0:000>  !gcroot 0000023a637180e0
 !gcroot 0000023a637180e0
Thread e6c:
    000000aebe7fec20 00007ffa296c0298 System.Windows.Threading.Dispatcher.GetMessage(System.Windows.Interop.MSG ByRef, IntPtr, Int32, Int32)
        rsi:
            ->  00000239a8101688 System.Windows.Threading.Dispatcher
            ->  0000023b4630e9a8 System.EventHandler
            ->  0000023b4630a990 System.Object[]
            ->  00000239a8425648 System.EventHandler
                ...
结果刷了半天都没刷完,还把 windbg 给弄死了,看样子这个引用链得有几十万哈。。。截图如下:
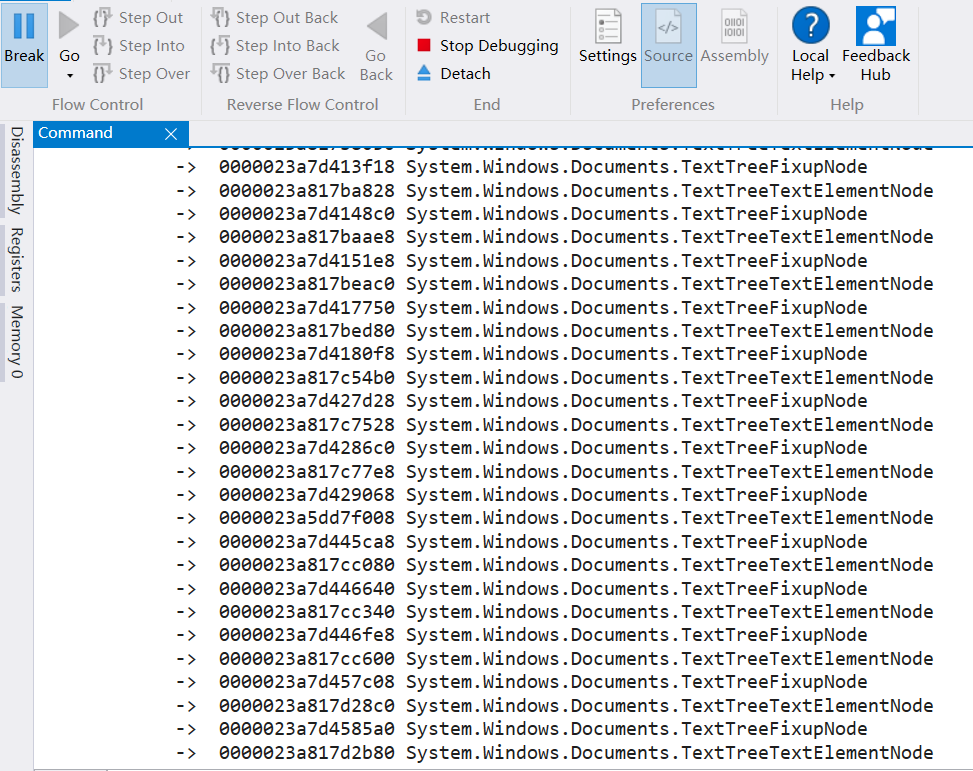
那遇到这种情况怎么办呢? 为了能够记录到所有的引用链,大家可以用 windbg 的 .logopen 和 .logclose 命令将所有的输出记录到文本中,喝了杯咖啡之后,终于output完了,看文件有 81w 行,真的心累。

一眼望去大多是 TextTreeTextElementNode 和 TextTreeFixupNode 之间的交叉引用,还得耐点心慢慢往上翻,看看可有什么蛛丝马迹,经过仔细排查,发现有一个 RickTextBox 控件,截图如下:
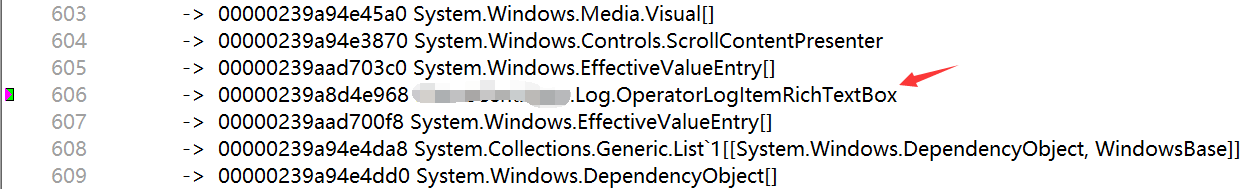
从名字上来看,可能是想用 RichTextBox 记录日志,接下来看下 OperatorLogItemRichTextBox 这个类是怎么写的。
public sealed class OperatorLogItemRichTextBox : RichTextBox, IOperatorLogger
{
    private static readonly DependencyProperty MaximumLogCountProperty = DependencyProperty.Register("MaximumLogCount", typeof(int), typeof(OperatorLogItemRichTextBox), new PropertyMetadata(1024));

    private static readonly DependencyProperty VerboseBrushProperty = DependencyProperty.Register("VerboseBrush", typeof(Brush), typeof(OperatorLogItemRichTextBox), new PropertyMetadata(Brushes.Gray));

    private static readonly DependencyProperty DebugBrushProperty = DependencyProperty.Register("DebugBrush", typeof(Brush), typeof(OperatorLogItemRichTextBox), new PropertyMetadata(Brushes.Cyan));

    ...

    private static readonly DependencyProperty ExceptionBrushProperty = DependencyProperty.Register("ExceptionBrush", typeof(Brush), typeof(OperatorLogItemRichTextBox), new PropertyMetadata(Brushes.Magenta));

    private static readonly DependencyProperty SpecialBrushProperty = DependencyProperty.Register("SpecialBrush", typeof(Brush), typeof(OperatorLogItemRichTextBox), new PropertyMetadata(Brushes.Magenta));

    ...
}
从源码看,朋友在项目中实现了一个自定义的 RichTextBox 控件来实现日志记录,内存泄露问题应该就在这里。
有车的朋友都知道 4S 店有一个好的传统,那就是 只换不修,又简单又能轻松挣钱,所以我给朋友的建议是:把 OperatorLogItemRichTextBox 从项目中给踢掉,排查下还有没有内存泄露的问题。
终于在一周后,收到了朋友的反馈,问题也终于解决了,截图如下:

其实关于 RichTextBox 的问题我遇到过二次,上次是崩溃相关的,如果要用它来记录日志,建议还是用信得过的第三方富文本控件,自己实现的话,难免会踩到很多坑。

Recommend
About Joyk
Aggregate valuable and interesting links.
Joyk means Joy of geeK