

Tracking Mastodon user numbers over time with a bucket of tricks
source link: https://simonwillison.net/2022/Nov/20/tracking-mastodon/
Go to the source link to view the article. You can view the picture content, updated content and better typesetting reading experience. If the link is broken, please click the button below to view the snapshot at that time.

Tracking Mastodon user numbers over time with a bucket of tricks
Mastodon is definitely having a moment. User growth is skyrocketing as more and more people migrate over from Twitter.
I’ve set up a new git scraper to track the number of registered user accounts on known Mastodon instances over time.
It’s only been running for a few hours, but it’s already collected enough data to render this chart:
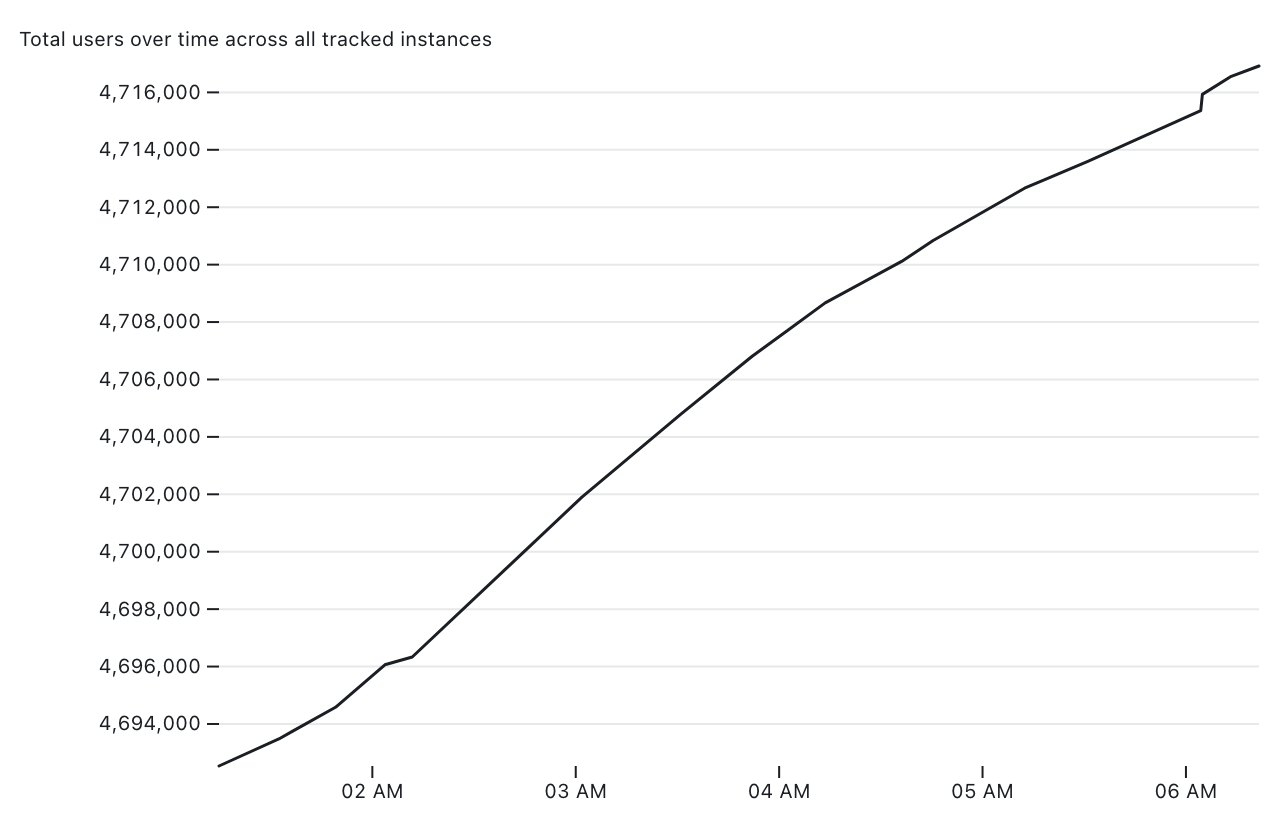
I’m looking forward to seeing how this trend continues to develop over the next days and weeks.
Scraping the data
My scraper works by tracking https://instances.social/—a website that lists a large number (but not all) of the Mastodon instances that are out there.
That site publishes an instances.json array which currently contains 1,830 objects representing Mastodon instances. Each of those objects looks something like this:
{
    "name": "pleroma.otter.sh",
    "title": "Otterland",
    "short_description": null,
    "description": "Otters does squeak squeak",
    "uptime": 0.944757,
    "up": true,
    "https_score": null,
    "https_rank": null,
    "ipv6": true,
    "openRegistrations": false,
    "users": 5,
    "statuses": "54870",
    "connections": 9821,
}
I have a GitHub Actions workflow running approximately every 20 minutes that fetches a copy of that file and commits it back to this repository:
https://github.com/simonw/scrape-instances-social
Since each instance includes a users count, the commit history of my instances.json file tells the story of Mastodon’s growth over time.
Building a database
A commit log of a JSON file is interesting, but the next step is to turn that into actionable information.
My git-history tool is designed to do exactly that.
For the chart up above, the only number I care about is the total number of users listed in each snapshot of the file—the sum of that users field for each instance.
Here’s how to run git-history against that file’s commit history to generate tables showing how that count has changed over time:
git-history file counts.db instances.json \
  --convert "return [
    {
        'id': 'all',
        'users': sum(d['users'] or 0 for d in json.loads(content)),
        'statuses': sum(int(d['statuses'] or 0) for d in json.loads(content)),
    }
  ]" --id id
I’m creating a file called counts.db that shows the history of the instances.json file.
The real trick here though is that --convert argument. I’m using that to compress each snapshot down to a single row that looks like this:
{
    "id": "all",
    "users": 4717781,
    "statuses": 374217860
}
Normally git-history expects to work against an array of objects, tracking the history of changes to each one based on their id property.
Here I’m tricking it a bit—I only return a single object with the ID of all. This means that git-history will only track the history of changes to that single object.
It works though! The result is a counts.db file which is currently 52KB and has the following schema (truncated to the most interesting bits):
CREATE TABLE [commits] (
   [id] INTEGER PRIMARY KEY,
   [namespace] INTEGER REFERENCES [namespaces]([id]),
   [hash] TEXT,
   [commit_at] TEXT
);
CREATE TABLE [item_version] (
   [_id] INTEGER PRIMARY KEY,
   [_item] INTEGER REFERENCES [item]([_id]),
   [_version] INTEGER,
   [_commit] INTEGER REFERENCES [commits]([id]),
   [id] TEXT,
   [users] INTEGER,
   [statuses] INTEGER,
   [_item_full_hash] TEXT
);
Each item_version row will tell us the number of users and statuses at a particular point in time, based on a join against that commits table to find the commit_at date.
Publishing the database
For this project, I decided to publish the SQLite database to an S3 bucket. I considered pushing the binary SQLite file directly to the GitHub repository but this felt rude, since a binary file that changes every 20 minutes would bloat the repository.
I wanted to serve the file with open CORS headers so I could load it into Datasette Lite and Observable notebooks.
I used my s3-credentials tool to create a bucket for this:
~ % s3-credentials create scrape-instances-social --public --website --create-bucket
Created bucket: scrape-instances-social
Attached bucket policy allowing public access
Configured website: IndexDocument=index.html, ErrorDocument=error.html
Created  user: 's3.read-write.scrape-instances-social' with permissions boundary: 'arn:aws:iam::aws:policy/AmazonS3FullAccess'
Attached policy s3.read-write.scrape-instances-social to user s3.read-write.scrape-instances-social
Created access key for user: s3.read-write.scrape-instances-social
{
    "UserName": "s3.read-write.scrape-instances-social",
    "AccessKeyId": "AKIAWXFXAIOZI5NUS6VU",
    "Status": "Active",
    "SecretAccessKey": "...",
    "CreateDate": "2022-11-20 05:52:22+00:00"
}
This created a new bucket called scrape-instances-social configured to work as a website and allow public access.
It also generated an access key and a secret access key with access to just that bucket. I saved these in GitHub Actions secrets called AWS_ACCESS_KEY_ID and AWS_SECRET_ACCESS_KEY.
I enabled a CORS policy on the bucket like this:
s3-credentials set-cors-policy scrape-instances-social
Then I added the following to my GitHub Actions workflow to build and upload the database after each run of the scraper:
    - name: Build and publish database using git-history
      env:
        AWS_ACCESS_KEY_ID: ${{ secrets.AWS_ACCESS_KEY_ID }}
        AWS_SECRET_ACCESS_KEY: ${{ secrets.AWS_SECRET_ACCESS_KEY }}
      run: |-
        # First download previous database to save some time
        wget https://scrape-instances-social.s3.amazonaws.com/counts.db
        # Update with latest commits
        ./build-count-history.sh
        # Upload to S3
        s3-credentials put-object scrape-instances-social counts.db counts.db \
          --access-key $AWS_ACCESS_KEY_ID \
          --secret-key $AWS_SECRET_ACCESS_KEY
git-history knows how to only process commits since the last time the database was built, so downloading the previous copy saves a lot of time.
Exploring the data
Now that I have a SQLite database that’s being served over CORS-enabled HTTPS I can open it in Datasette Lite—my implementation of Datasette compiled to WebAssembly that runs entirely in a browser.
https://lite.datasette.io/?url=https://scrape-instances-social.s3.amazonaws.com/counts.db
Any time anyone follows this link their browser will fetch the latest copy of the counts.db file directly from S3.
The most interesting page in there is the item_version_detail SQL view, which joins against the commits table to show the date of each change:
(Datasette Lite lets you link directly to pages within Datasette itself via a #hash.)
Plotting a chart
Datasette Lite doesn’t have charting yet, so I decided to turn to my favourite visualization tool, an Observable notebook.
Observable has the ability to query SQLite databases (that are served via CORS) directly these days!
Here’s my notebook:
https://observablehq.com/@simonw/mastodon-users-and-statuses-over-time
There are only four cells needed to create the chart shown above.
First, we need to open the SQLite database from the remote URL:
database = SQLiteDatabaseClient.open(
  "https://scrape-instances-social.s3.amazonaws.com/counts.db"
)
Next we need to use an Obervable Database query cell to execute SQL against that database and pull out the data we want to plot—and store it in a query variable:
SELECT _commit_at as date, users, statuses
FROM item_version_detail
We need to make one change to that data—we need to convert the date column from a string to a JavaScript date object:
points = query.map((d) => ({
  date: new Date(d.date),
  users: d.users,
  statuses: d.statuses
}))
Finally, we can plot the data using the Observable Plot charting library like this:
Plot.plot({
  y: {
    grid: true,
    label: "Total users over time across all tracked instances"
  },
  marks: [Plot.line(points, { x: "date", y: "users" })],
  marginLeft: 100
})
I added 100px of margin to the left of the chart to ensure there was space for the large (4,696,000 and up) labels on the y-axis.
A bunch of tricks combined
This project combines a whole bunch of tricks I’ve been pulling together over the past few years:
- Git scraping is the technique I use to gather the initial data, turning a static listing of instances into a record of changes over time
- git-history is my tool for turning a scraped Git history into a SQLite database that’s easier to work with
- s3-credentials makes working with S3 buckets—in particular creating credentials that are restricted to just one bucket—much less frustrating
- Datasette Lite means that once you have a SQLite database online somewhere you can explore it in your browser—without having to run my full server-side Datasette Python application on a machine somewhere
- And finally, combining the above means I can take advantage of Observable notebooks for ad-hoc visualization of data that’s hosted online, in this case as a static SQLite database file served from S3
Recommend
-
25
My Chinese takeaway delivery was late. Very late. I flipped open the confirmation email sent by Just-Eat to double-check I had all the details correct. At the bottom was a "click to call" link. Hurrah! I clicked...
-
19
Want to know something scary? We really don't even know how many people have been tested for the coronavirus, never mind how many have it. Despite the
-
6
Grant a user Amazon S3 console access to only a certain bucket · GitHub Instantly share code, notes, and snippets.
-
5
19 Nov 2022, 11:11 It took me quite a while to realize that I have been here before. When Google+ (the greatest social network...
-
9
Use your own user @ domain for Mastodon discoverability with the WebFinger Protocol without hosting a server Mastodon is a free, open-source social networking service that is decentralized and distr...
-
9
Mastodon has attracted over 2 million users since Elon Musk took over Twitter
-
8
January 10, 2023 Deserialize Mastodon User XML RSS feeds with .NET ...
-
3
AdvertisementCloseBusiness
-
9
Admin of an anarchist Mastodon server raided by FBI, insecure user data gets seized...
-
8
Home Mastodon’s monthly user count underestimated by over 407K due to network error Mastodo...
About Joyk
Aggregate valuable and interesting links.
Joyk means Joy of geeK