

The Android Profiler
source link: https://developer.android.com/studio/profile/android-profiler
Go to the source link to view the article. You can view the picture content, updated content and better typesetting reading experience. If the link is broken, please click the button below to view the snapshot at that time.
The Android Profiler
The Android Profiler in Android Studio 3.0 and higher replaces the Android Monitor tools. The Android Profiler tools provide real-time data to help you to understand how your app uses CPU, memory, network, and battery resources.
For details about each of the profilers, see the following:
The Android Profiler is compatible with Android 5.0 (API level 21) and higher.
See the following video for an introduction to the Android Profiler.
To open the Profiler window, choose View > Tool Windows > Profiler or
click Profile
 in the toolbar. If prompted by the Select Deployment
Target dialog, select the device on which to profile your app. If you've
connected a device over USB but don't see it listed, ensure that you have
enabled USB debugging. If you're using
the Android Emulator or a rooted device, the Android Profiler lists all running
processes, even though they might not be debuggable. When you launch a
debuggable app, that process is selected by default.
in the toolbar. If prompted by the Select Deployment
Target dialog, select the device on which to profile your app. If you've
connected a device over USB but don't see it listed, ensure that you have
enabled USB debugging. If you're using
the Android Emulator or a rooted device, the Android Profiler lists all running
processes, even though they might not be debuggable. When you launch a
debuggable app, that process is selected by default.
Android Profiler continues to collect profiling data until you disconnect the device or click End Session.
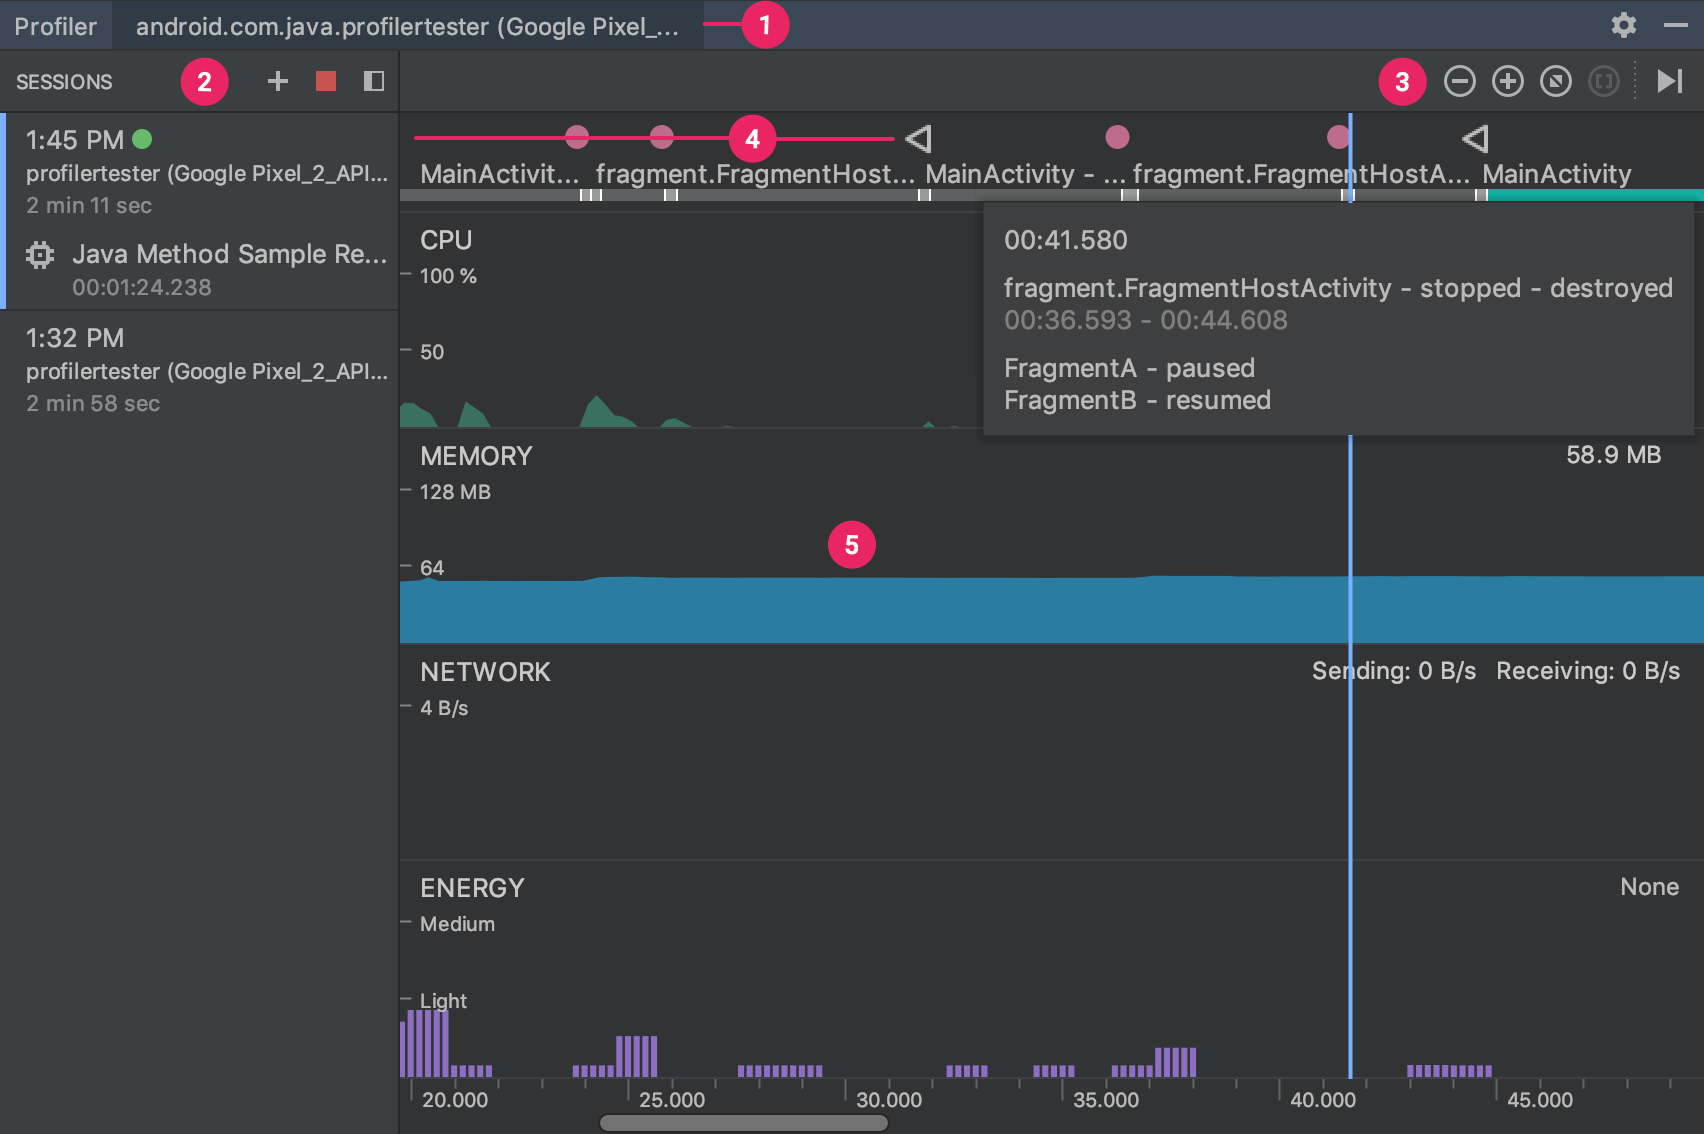
Figure 1. Android Profiler shared timeline view
1 Android Profiler shows the process and device currently being profiled.
2 In the Sessions pane, choose which session to view, or start a new profiling session.
3 Use the zoom buttons to control how much of the timeline to view, or use the Attach to live button to jump to the real-time updates.
4 The event timeline shows events related to user input, including keyboard activity, volume control changes, and screen rotations.
5 The shared timeline view, which includes graphs for CPU, memory, network, and energy usage.
This shared timeline view only shows the timeline graphs. To access the detailed profiling tools, click the graph that corresponds to the performance data that you want to inspect. For example, to access tools to inspect the heap and track memory allocations, click the Memory graph.
Not all profiling data is visible by default. If you see a message that says "Advanced profiling is unavailable for the selected process," you can enable advanced profiling in your run configuration to view the additional data.
Sessions
You can save Profiler data as sessions, which are retained until you quit Android Studio. By recording profiling information in multiple sessions and switching between them, you can compare resource usage in various scenarios.
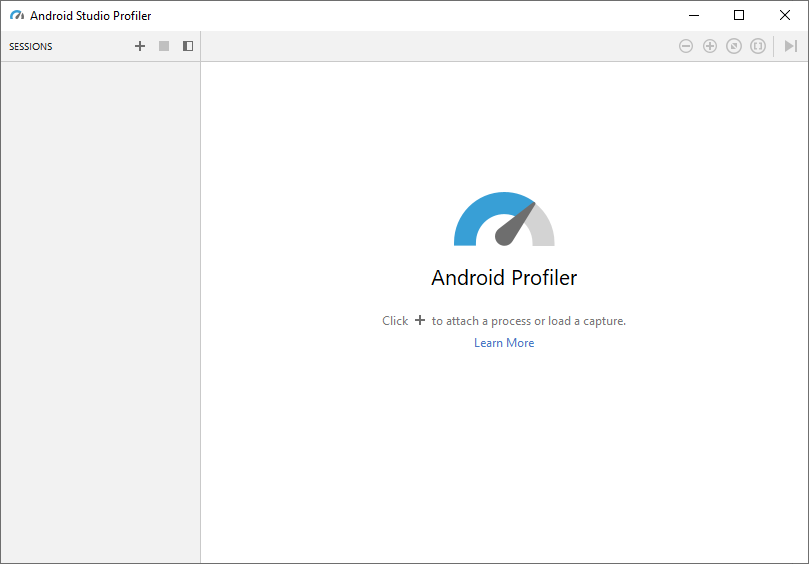
To start a new session, click the Start a new profiling session
 button
and select an app process from the dropdown menu that appears.
button
and select an app process from the dropdown menu that appears.When you record a trace or capture a heap dump, Android Studio adds that data (along with your app's network activity) as a separate entry to the current session.
To stop adding data to the current session, click Stop the current profiling session
 .
.To import a trace exported from a previous run of Android Studio, click Start new profiler session
and choose Load from file.
Enable additional support for older devices (API level < 26)
To show you additional profiling data when running a device with Android 7.1 or lower, Android Studio must inject monitoring logic into your compiled app. These additional profiling data include the following:
- The event timeline on all profiler windows
- The number of allocated objects in Memory Profiler
- Garbage collection events in Memory Profiler
- Details about all transmitted files in Network Profiler
Note: These features are available by default if your device is running Android 8.0 or higher.
To enable additional support for older devices, follow these steps:
- Select Run > Edit Configurations.
- Select your app module in the left pane.
- Click the Profiling tab, and then check Enable additional support for older devices (API level < 26).
- Build and run your app again.
Enabling additional support for older devices makes the build process slower, so you should enable it only when you want to start profiling your app.
Note: Additional support for older devices is not available for native code on
devices using Android 9 or lower. If your app is a pure native app targeting
Android 9 or lower (i.e., it does not have a Java Activity class), the
additional profiling data are not available. If your app uses JNI, some
profiling data are available—such as the event timeline, garbage collection
events, Java-allocated objects, and Java-based network activity—but it cannot
detect native-based allocations and network activity.
Run standalone profilers
The standalone Android Studio Profilers allow you to profile your app without running the full Android Studio IDE.
To run the standalone profilers, do the following:
- Make sure the profiler is not currently running inside of Android Studio.
Go to the installation directory and navigate to the
bindirectory:Windows/Linux:
<studio-installation-folder>/binmacOS:
<studio-installation-folder>/Contents/binDepending on your OS, run
profiler.exeorprofiler.sh. The Android Studio splash screen appears.After the splash screen disappears, a profiler window opens:
Start the Android emulator or connect an Android device and wait for the home screen to load. To run the emulator from the command line, see Start the emulator from the command line. If you start the emulator from Android Studio, be sure to close Android Studio after the emulator has started.
In the menu of the standalone profiler, click the
 button and all of your connected devices and
emulators should now be displayed:
button and all of your connected devices and
emulators should now be displayed: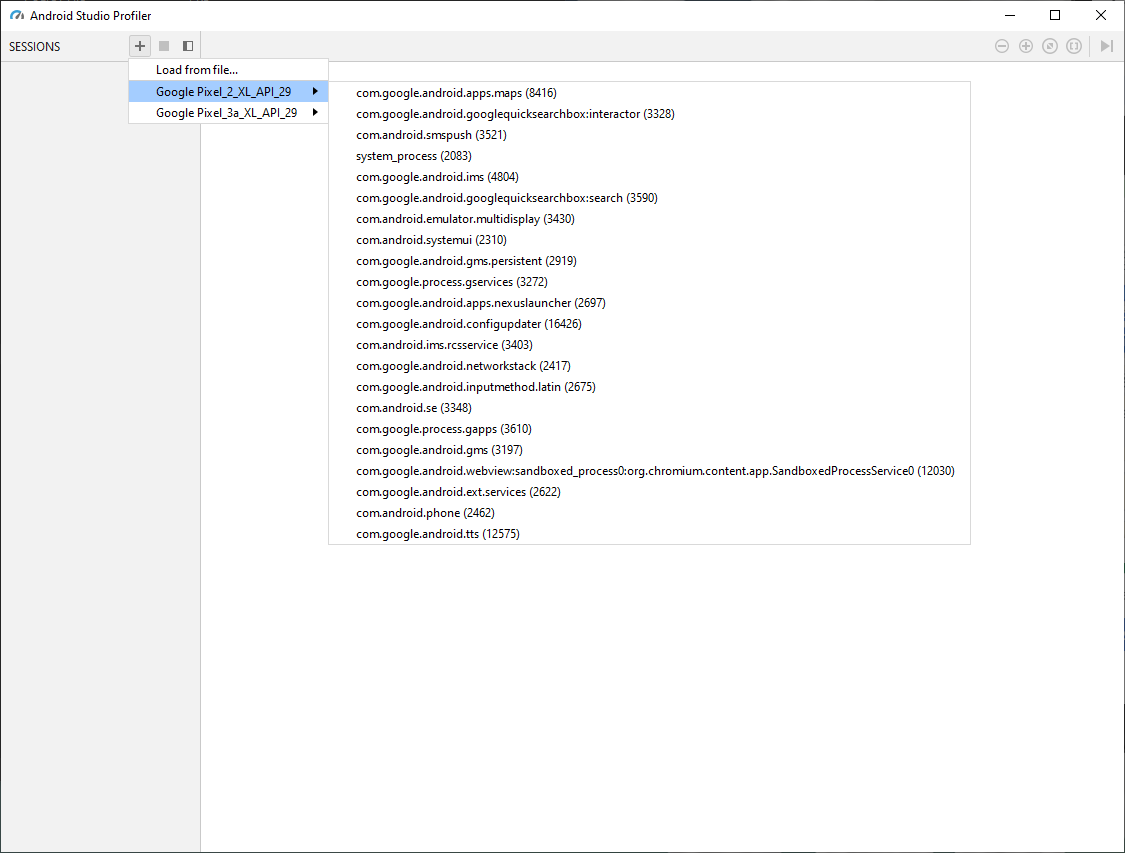
As an example, open Google Maps in the emulator. Create a new profiling session by selecting an emulator from the dropdown, and then select com.google.android.apps.maps (...). This launches a profiling session.
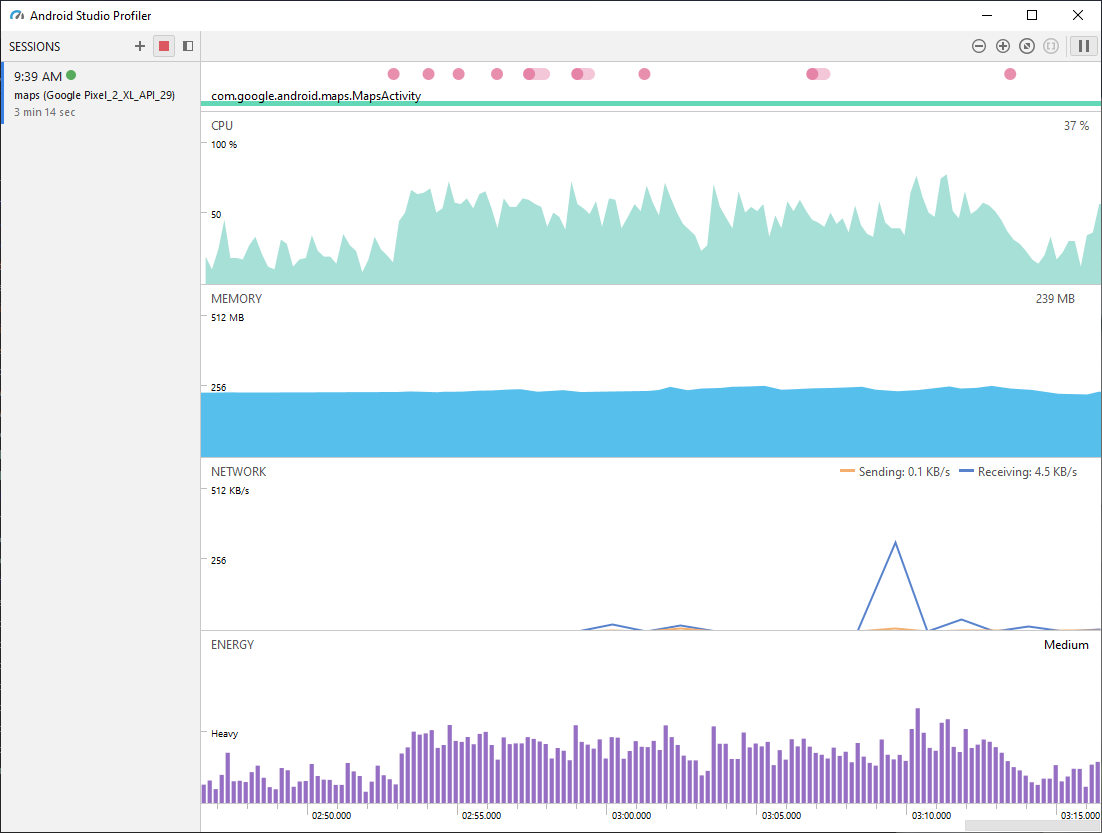
When you interact with the map, touch events and CPU usage appear in the profiler. Click on the CPU, Memory, Network, or Energy graphs to show more details.
Click the  button to end the profiling session.
Recommend
About Joyk
Aggregate valuable and interesting links.
Joyk means Joy of geeK