

Track cache hits with custom metrics
source link: https://blog.appsignal.com/2017/11/13/track-cache-hits-with-custom-metrics
Go to the source link to view the article. You can view the picture content, updated content and better typesetting reading experience. If the link is broken, please click the button below to view the snapshot at that time.


Every server running an app that uses AppSignal sends a collection of samples and metrics to our Push API every 30 seconds.
Each request has a key we use to determine which app the data came from. To do that, we need to query our database to find the app for each incoming request. With thirty billion requests per month, we're constantly trying to find ways to reduce the number of queries to make AppSignal faster.
We implemented caching to reduce the number of queries on our database clusters. Whenever we fetch an app from the database, we store it in Memcached for one minute. After deploying this change to production, we found that we were doing more queries than before. It seemed like the cache was invalidated too often. To find out where that happened, we added some custom metrics to find out where the cache was improperly invalidated.
There are a couple of places where we invalidate the cache, such as when the push processed time is updated or when we detect a new namespace.
# Update last push processed at time
if app.last_push_processed_at < 5.minutes.ago
  app.set(:last_push_processed_at => Time.now)
  Rails.cache.delete(cache_key)
end

if namespaces_diff.any?
  app.add_to_set(:namespaces => namespaces_diff)
  Rails.cache.delete(cache_key)
end
We added multiple counters to determine which of these cache invalidations was the culprit. In this example we increment the app.cache.invalidate counter to count the total number of validations, and use specific keys such as app.cache.invalidate_push_time and app.cache.invalidate_namespaces for specific invalidations.
# Update last push processed at at time
if app.last_push_processed_at < 5.minutes.ago
  app.set(:last_push_processed_at => Time.now)
  Rails.cache.delete(cache_key)
  Appsignal.increment_counter('app.cache.invalidate', 1)
  Appsignal.increment_counter('app.cache.invalidate_push_time', 1)
end

if namespaces_diff.any?
  app.add_to_set(:namespaces => namespaces_diff)
  Rails.cache.delete(cache_key)
  Appsignal.increment_counter('app.cache.invalidate', 1)
  Appsignal.increment_counter('app.cache.invalidate_namespaces', 1)
end
Adding the custom metrics above, we were able to graph our cache hits over time. It became immediately apparent which of the cache keys caused the rise in queries. The app.cache.invalidate_namespaces key was invalidated for each request.
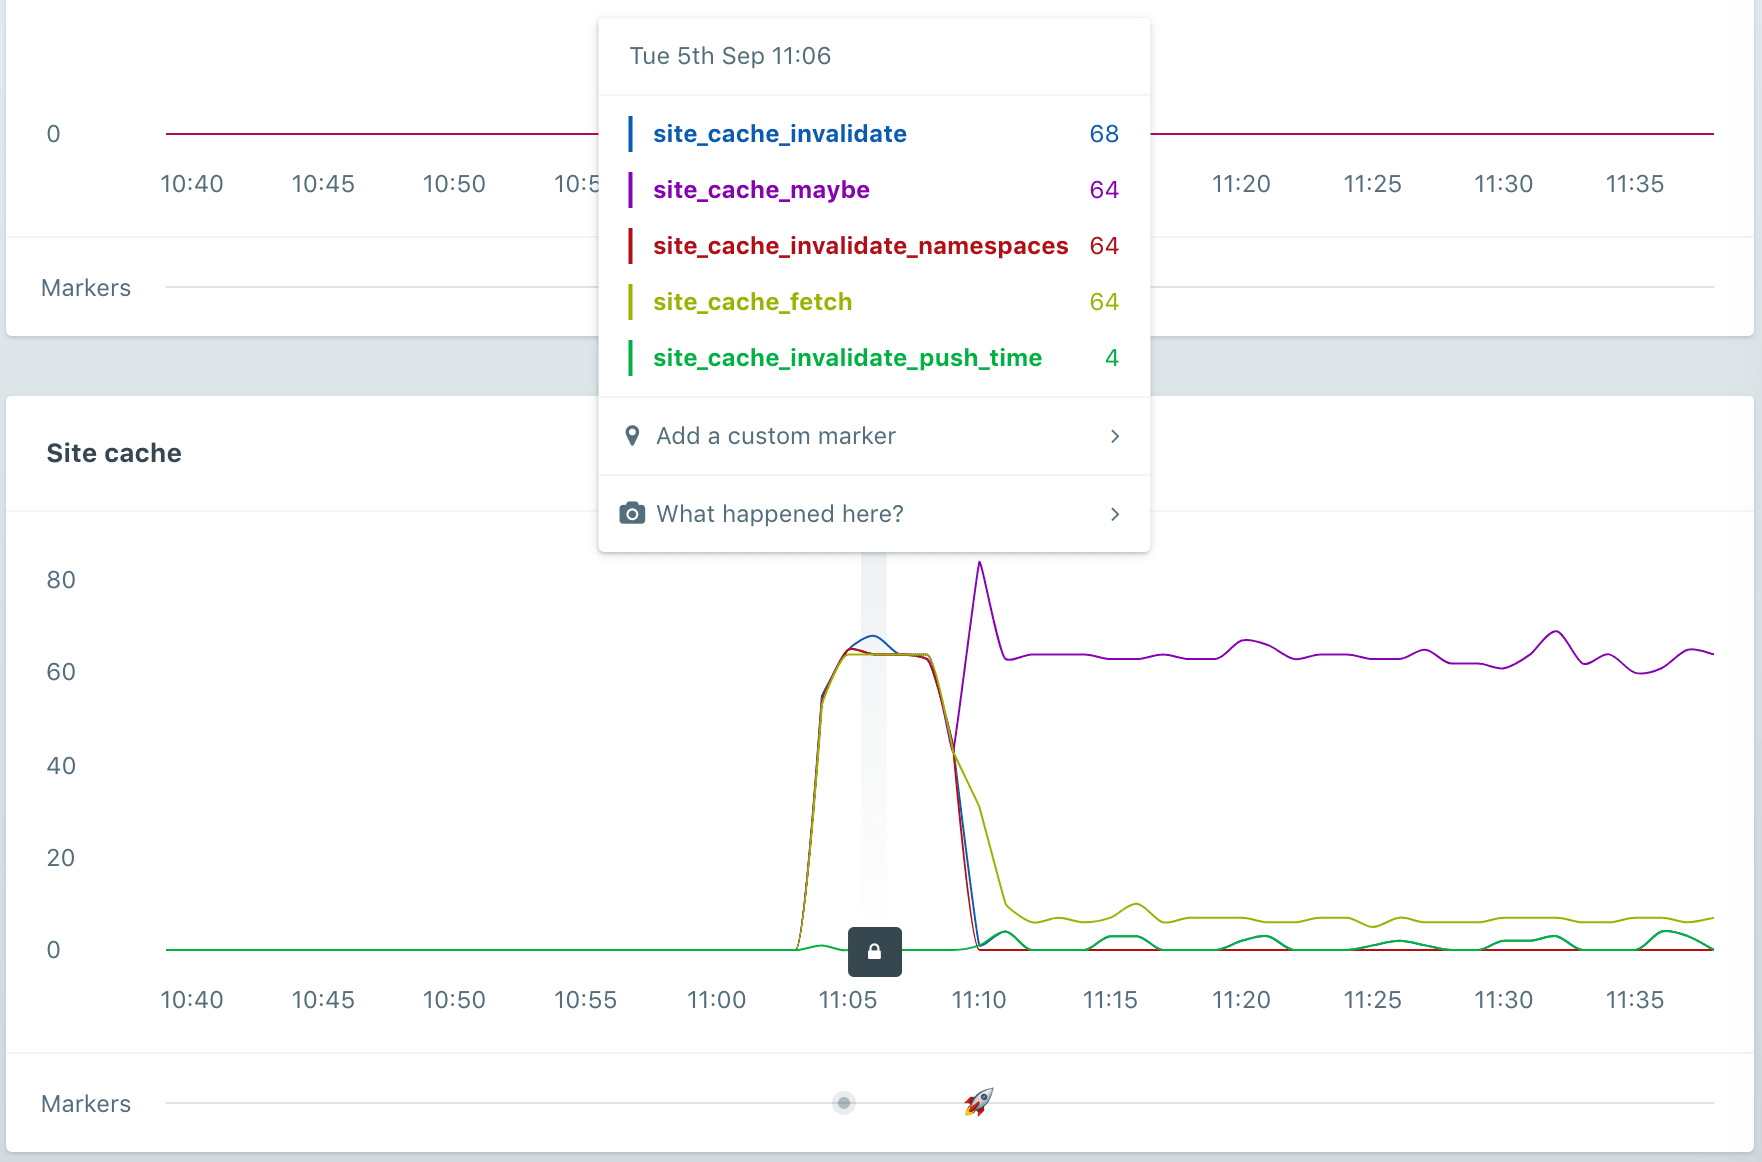
The total number of cacheable requests is counted as app.cache.maybe.
After deploying a fix for this issue, the number of invalidations dropped to zero as long as the namespaces for an app weren't updated.
Adding custom metrics makes it easier to understand what's happening where, when, and how often. In this case, knowing the number of cache invalidations and showing them in a readable graph allowed us to quickly find an issue. It just needs a couple of lines of code to increment a certain value and create a dashboard.
Let us know if you have any questions about custom metrics and if we can help you to get them set up in your application. We're happy to help!
Recommend
About Joyk
Aggregate valuable and interesting links.
Joyk means Joy of geeK