

Plutonium isotopes in the North Western Pacific sediments coupled with radiocarb...
source link: https://www.nature.com/articles/s41598-022-14179-w
Go to the source link to view the article. You can view the picture content, updated content and better typesetting reading experience. If the link is broken, please click the button below to view the snapshot at that time.
Introduction
The Earth and environmental sciences allow us to understand changes in the planets’ status through time. Determination of the boundary of geological epochs that represent major shifts in the Earth system and have therefore received interest from a wide range of research fields. Great efforts have been made by the international scientific community to define official geological boundaries associated with major global environmental events, often related to changing interactions amongst Earth’s sub-systems (e.g., Refs.1,2,3,4,5,6). The present day geological era is the Holocene epoch which started from 11,700 years ago (11.7 ka), and is further divided into the Greenlandian Age (11.7–8.2 ka), Northgrippian Age (8.2–4.2 ka) and Meghalayan Age (4.2 ka-present) according to the ICS (International Commission on Stratigraphy) of the IUGS (International Union of Geological Sciences). However, since the mid twentieth century, industrialization, energy usage, and the global population and economy have increased dramatically, severely impacting Earth’s environment in what is often referred to as the great acceleration7. Because of this, the AWG (Anthropocene Working Group) of the ICS is now working towards defining the time that marks the end of the Holocene and the start of the Anthropocene8. The majority of the AWG group favor the use of plutonium isotope signals recorded in geological samples as a stratigraphic marker because values sharply increased during the 1950s and became widely distributed due to above ground thermonuclear bomb tests9,10. At present however, the use of plutonium signals as a stratigraphic marker for the start of the Anthropocene has only limited acceptance, and there is no consensus on a date that delineates the boundary between the Holocene and the Anthropocene. In what follows we have used the term Anthropocene to refer to the time period commencing with the appearance of plutonium signals in the geological record that are attributable to the first atmospheric nuclear weapons tests, namely in the period from 1954 (CASTLE BRAVO test, see below) to the present.
Prior to 1963 CE (Common Era), when the Partial Test Ban Treaty (PTBT) was issued to limit above ground nuclear bomb tests, approximately 3 tons of 239Pu had been released to the environment9. Global fallout of Pu that resulted from the tests, which commenced in 1945 CE, peaked in the Northern Hemisphere between 1961 and 1962 CE. Various geological archives have been considered as the best recorder of the Anthropocene11. One of these is reef building corals since their annual banded calcium carbonate skeleton can record signals of ambient seawater12,13,14,15. Age models are often reconstructed using these growth bands determined from X-ray images. However, miscounting of bandings are reported in several occasions that sometimes produce confusing pictures of the timing of Pu signals. For example, a coral obtained from Ishigaki Is. in Japan (Fig. 1a), located downstream of the Kuroshio Current (KC), displayed an earlier arrival of Pu signals than those collect from Guam16 (Fig. 1a). Accordingly, a thorough examination is required to establish the age model, employing a variety of independent layer counting methods. Clearly, corals can record climate signals such as temperature and salinity to understand the changes before and after the Anthropocene. Long-term baseline assessments (ca. millennial or longer) of environments are limited though, since the time span of typical long-lived corals only cover less than 100 years17,18, which is far shorter than the duration of the Holocene epoch (11.7 ka).
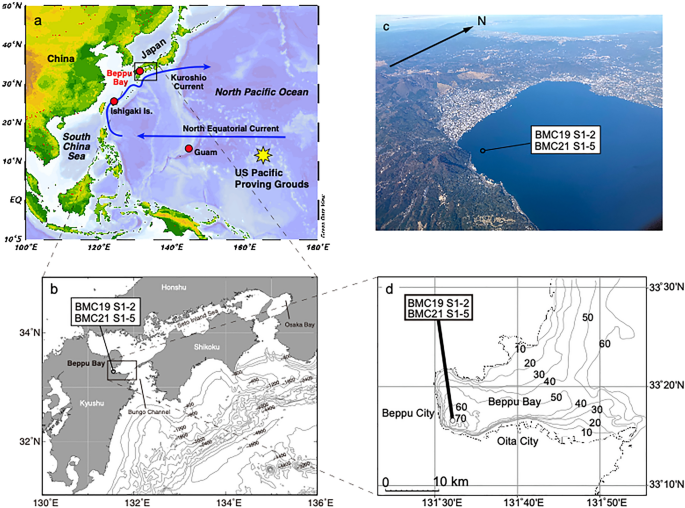
Location of Beppu Bay and key locations in the North Pacific Ocean. (a) The US pacific proving ground (PPG) is located east of Guam, and the North Equatorial Current (NEC) and Kuroshio Current (KC). The software Ocean Data View Ocean Data View 5.4.0 (Schlitzer, R., Ocean Data View, http://www.awi-bremerhaven.de/GEO/ODV,2003.) was used to draw the map. (b) Beppu bay is located at the entrance of Setonaikai Inland Sea and is connected to the Pacific Ocean via the Bungo Channel. Map was generated using GMT with topographic data of ETOPO1 (https://www.ngdc.noaa.gov/mgg/global/global.html). (c) Aerial photo of Beppu Bay. The coring site for this study is also indicated. (d) Contours indicating the water depth in meters showing anoxic bottom water conditions are created by the depicted bathymetric feature. The map was drawn using the chart distributed by the Hydrographic and Oceanographic Department, Japan Coast Guard (https://www1.kaiho.mlit.go.jp/jhd-E.html).
High accumulation of sediment at coastal marine sites, in particular the anoxic ocean floor, has an advantage from this perspective since records can extend back further to cover the entire Holocene19. Marine environmental information is retained within various sediment proxy records, e.g. oxygen isotopes, trace element geochemistry, organic geochemistry and so forth20,21,22,23. Therefore, sediments, in particular obtained from coastal sites are well suited to discuss local environmental changes closely related to anthropogenic activities in the context of global environmental changes24.
Plutonium in marine sediments has been measured from the open ocean to coastal areas25,26 for the last several decades, including at several sites across the Pacific Ocean27 where numerous nuclear weapons were tested. Thus, studies concerning airborne global fallout and fallout transported by ocean currents (and derived from close-in fallout at the test sites) exist28. Because the different nuclear test series created a variety of 240Pu/239Pu signatures, the source of the Pu can be traced25. The average 240Pu/239Pu ratio of ca. 0.18 is reported for global fallout29,30. For the case of the North Pacific region, the US Pacific Proving Ground (PPG) in the Marshall Islands was used as a test site during the 1950s to 1960s, and corals and soil samples showed elevated ratios as high as 0.30–0.3531,32,33. This was attributed largely to the CASTLE BRAVO test which took place in March 195433.
The North Pacific Ocean is characterized as a location downstream of the North Equatorial Current (NEC) and Kuroshio Current (KC), which have average current speeds of 0.1–0.2 m s−1 and 0.5–1 m s−1, respectively. The wide distribution of Pu in the region shows that particulates originated from the PPG and were then transported by the NEC and KC. Compilation of previously reported Pu isotope studies in the region show that a 240Pu/239Pu higher than ca. 0.2 is found in sediments and corals as well as seawater in widespread regions of the North Pacific26. A high atomic ratio of Pu isotopes (240Pu/239Pu) of more than ca. 0.3 is known as observed in PPG material32. This is significantly larger than that at all other known nuclear test sites. Hence 240Pu/239Pu atomic ratios higher than 0.2 are attributed to the influence of materials transported from the Marshall Islands. This is in line with seawater 137Cs measurements conducted in the 1950s34. An isotopic mass balance model35 indicates 30–40% of the Pu in the North Pacific derives from the PPG via the NEC/KC system, including in the years after 1963 when the PTBT (Partial Test Ban Treaty) came into effect. Sediment trap and seawater samples collected along the KC in southern Japan show higher Pu isotopic ratios (> 0.18), and hence lateral movement of PPG sourced dissolved Pu35. Other studies investigating the NEC-KC pathways confirm this observation27,28,35,36,37,38,39,40,41,42. Thus, detecting the arrival signature of PPG derived Pu, as characterized by high Pu-isotope ratios, can assign the timing in the material as recently following the CASTLE BRAVO test of March 1954. In sum, the North Western Pacific Ocean basin has a great advantage since reef building coral and PPG signals can be used to identify the timing of anthropogenic signatures namely nuclear bomb tests.
Here, we propose a novel method that couples annual banded reef building corals and nearshore anoxic marine sediments with the former age determinations being made by X-ray photos and a high-resolution sea surface temperature proxy (Sr/Ca) to precisely determine the start of the Anthropocene using global fallout signals. We demonstrate the efficacy of the methods using sediment obtained from Beppu Bay, Japan, and a coral from Ishigaki Island, Japan (Fig. 1).
Locations and samples
The Japanese archipelago is located in the North West Pacific where the warm KC flows offshore of the southern half of the islands (Fig. 1). The KC originates near the North-Eastern parts of the Philippines where the North Equatorial Current (NEC) bifurcates in meridional directions. Sediment cores obtained for this study were retrieved from the deepest part of the Beppu Bay, east of Kyushu (33° 16′ 23.5″ N, 131° 32′ 21.5″ E, 70 m water depth), where anoxic bottom water conditions persist from boreal spring to fall due to a shallow sill (ca. 50 m water depth) at the mouth of the bay (Fig. 1). Well preserved past oceanic and environmental conditions are expected, as confirmed by previous studies19,43,44.
The cores were collected using a 120 cm long multiple corer, carefully preserving the sediment water interface1,43,45. They underwent sedimentological analyses including CT-scanning. Sediments consist of a silty clay with the occasional occurrence of distinct centimeter thick coarse layers, visible in CT-scan image (Fig. 2). They are likely formed due to geological events such as flooding and earthquakes1. The layers are readily traceable between the two cores and useful to correla te with each other (Fig. 2 & Fig. S1).

CT scan image of the Beppu Bay sediments and Pu measurements using Accelerator Mass Spectrometer (AMS). Horizons of geological event layers (e.g., Ev-1e, Ev-1dU etc.) can be recognized in images of cores and are traceable amongst cores taken from the basin24. They are formed by turbidite created from Tsunamis and other events. Ev.-1a at 46.0 cm bsf is recorded in historical documents with an age consistent with the Pb-210 age model. Pu isotope ratios and total activities are measured using Accelerator Mass Spectrometry63.
Recommend
About Joyk
Aggregate valuable and interesting links.
Joyk means Joy of geeK