

It looks a lot like a housing bubble. How your local housing market compares to...
source link: https://finance.yahoo.com/news/looks-lot-housing-bubble-local-223558236.html
Go to the source link to view the article. You can view the picture content, updated content and better typesetting reading experience. If the link is broken, please click the button below to view the snapshot at that time.
It looks a lot like a housing bubble. How your local housing market compares to 2007, as told by 4 interactive charts
S&P Futures
3,735.00+59.25(+1.61%)Dow Futures
30,291.00+422.00(+1.41%)Nasdaq Futures
11,487.00+190.25(+1.68%)Russell 2000 Futures
1,695.00+29.90(+1.80%)Crude Oil
111.52+1.96(+1.79%)- 1,841.80+1.20(+0.07%)
Silver
21.67+0.08(+0.36%)EUR/USD
1.0530+0.0012(+0.12%)10-Yr Bond
3.2390-3.2390(-100.00%)- 31.03-32.95(-100.00%)
GBP/USD
1.2269+0.0023(+0.1854%)USD/JPY
135.0460-0.0390(-0.03%)BTC-USD
20,509.24+410.26(+2.04%)CMC Crypto 200
441.03+8.09(+1.87%)FTSE 100
7,121.81+105.56(+1.50%)Nikkei 225
26,320.91+549.69(+2.13%)
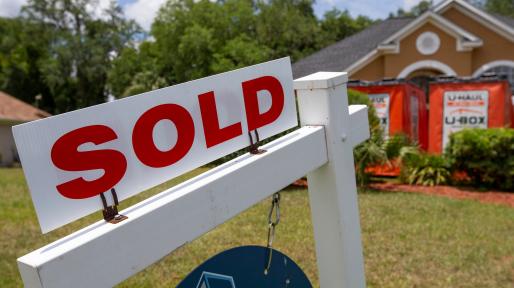
It looks a lot like a housing bubble. How your local housing market compares to 2007, as told by 4 interactive charts
Never again. That was the sentiment held among legislators as they rallied to pass the Dodd–Frank Wall Street Reform and Consumer Protection Act in 2010. The goal was to outlaw the subprime mortgages that fueled the '00s housing bubble—which saw U.S. home prices soar 84% between January 2000 and June 2006—and ultimately pushed the country into the deepest recession since the Great Depression.
Fast forward to 2022, and we're once again hearing "housing bubble" talk. Economist Robert Shiller, who predicted the last housing bubble in 2005, recently hinted that housing may be in another bubble. Economists at the Federal Reserve Bank of Dallas put the real estate industry on edge this spring after they published a paper titled "Real-time market monitoring finds signs of brewing U.S. housing bubble." Why the renewed concern? Over the past year alone, home prices have gone up four times faster than incomes. Simple economic theory, which dictates that neither home prices nor incomes can outgrow the other for very long, tells us that isn't sustainable.
There's another reason bubble talk has suddenly reemerged: The spike in mortgage rates—up from 3.2% to 6% over the past six months—means home shoppers are finally feeling the full brunt of the pandemic housing boom, which pushed U.S. home prices up 37% between March 2020 and March 2022.
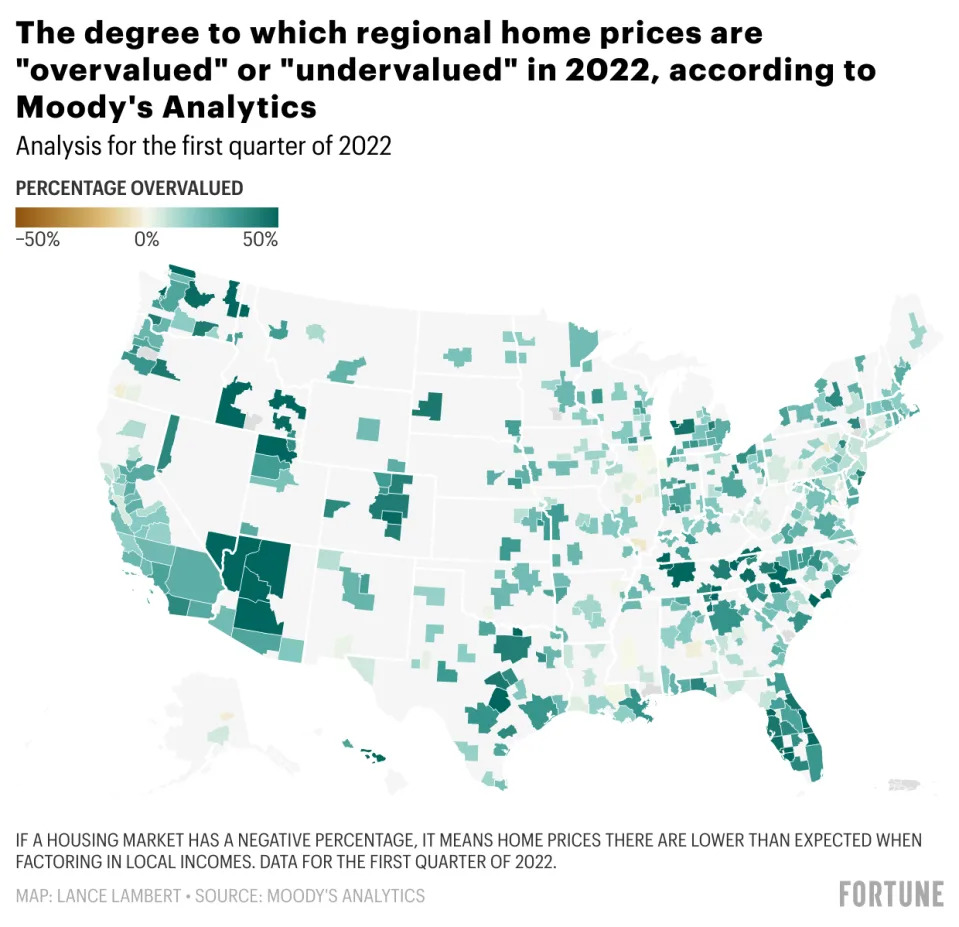
To better understand where the housing market stands, at least from a historical perspective, Fortune reached out to Moody's Analytics. The financial intelligence firm provided this publication an exclusive look at their quarterly proprietary analysis of 414 regional U.S. housing markets. The analysis runs between the fourth quarter of 1992 and the first quarter of 2022. (Back in May, Fortune looked at a similar analysis conducted by the Real Estate Initiative at Florida Atlantic University).
The analysis conducted by Moody's Analytics aimed to find out whether economic fundamentals, including local income levels, could support local home prices. On a national level, Moody's Analytics finds U.S. home prices are "overvalued" by 24.7%. In other words, U.S. home prices are 24.7% higher than they'd historically trade at given current income levels. While that doesn't mean home prices are about to fall by 24.7%, it does mean that, historically speaking, home prices have moved into the upper bounds of affordability. The last time that happened? During the 2000s housing bubble.
 Motley Fool
Buy Now or Wait a Year? This Is What Homebuyers Should Do to Avoid Making a Big Mistake
To call today's housing market a tricky one would be a huge understatement. Not only are home prices today sky-high, but they're being further elevated by bidding wars, which remain common, given how limited inventory is. The Federal Reserve is moving forward with a series of interest rate hikes that could make mortgage borrowing even more expensive over the next year.
15h ago VC Star | Ventura County Star
California housing market: Could a new tax on speculators, flippers be the affordability answer?
Yes, there is a housing crisis, but it’s at least as much a matter of hoarding and waiting for profit as it is of supply.
11h ago NBC News
Here's why this housing downturn is nothing like the last one
Is today’s housing market in the same predicament that it was over a decade ago, when the 2007-08 crash caused the Great Recession? The short answer is: no.
12h ago PureWow
The Secret to Falling Asleep Super-Fast Lies in Your Feet. Yep.
An unexpected plus of a girlfriend sleepover: My bestie gave me a few pumps of magnesium oil to rub into my feet before getting into bed, and I drifted off, fast. I didn’t think much of it until a few days...
2d ago Fortune
A top Wall Street strategist changes his tune and says the U.S. can now avoid a recession
Veteran strategist of Wall Street changes his tune and says “global recession depression” is unlikely to happen and can be avoided in the U.S.
12h ago FX Empire
Shiba Inu Becomes Ethereum Whales Largest Holding Surpassing USDT
The meme coin has been finding more and more audience with every passing day despite losing its position in the top 15 cryptocurrencies.
9h ago TheStreet.com
Disney Rolls Out Even Pricier Experience Than Its Star Wars Hotel
Fans of Walt Disney theme parks are accustomed to making a large investment to visit the Disney World Resort in Florida, Disneyland Resort in Anaheim, Calif., or any other of its parks around the world. Visiting a Disney Park has become a luxury excursion that middle-class families either need to save for or go into debt to experience. The lowest price of admission for a one-day ticket at either a Disneyland or Disney World park is $109, but that doesn't include parking if you're driving.
4h ago MarketWatch
I’m paying my adviser 1%, but ‘the only communications I get are invoices.’ So I want to regain sole control of my accounts — without having to talk to him about it. Is this possible?
Question: Eight years ago I hired a financial advisor because the rounds of layoffs at work were coming more regularly, and I wanted to know if my savings were enough for me to retire. The financial advisor began managing some of my accounts for me for a fee of 1%.
18h ago Barrons.com
The Housing Market Just Hit a Wall. What’s Next for Prices, Brokers, and Builder Stocks.
Just a few months ago real estate was flying high. But with mortgage rates rising, brokers are already seeing a sharp slowdown in buyers. The big builders are better positioned to weather a recession.
1d ago LA Times
L.A. needs 90,000 trees to battle extreme heat. Will residents step up to plant them?
L.A. City is relying on a network of neighborhood tree ambassadors and nonprofits to boost tree canopy in underserved neighborhoods. Will it work?
3h ago MoneyWise
Wells Fargo sees a recession brewing by next year — here are 3 stocks it's keeping behind the emergency glass
The S&P 500 has plunged over 23%, but a stock market downturn isn’t the only thing to worry about.
7h ago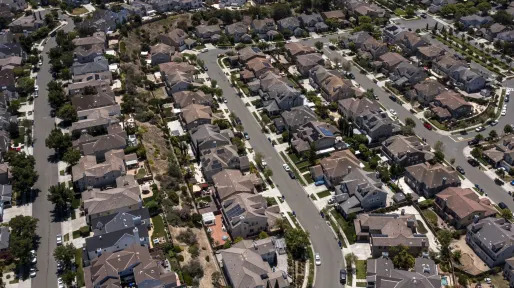 Bloomberg
US House Prices Are Likely to Drop as Rates Rise, Capital Economics Says
(Bloomberg) -- US house prices are likely to fall as mortgage rates exceeding 6% crimp affordability for the average buyer, according to Capital Economics.Most Read from BloombergUS Futures Gain With European Stocks; Dollar Slips: Markets WrapPutin May Win in Ukraine, But the Real War Is Just StartingBiden Says US Recession Avoidable After Call With Ex-Treasury Secretary SummersHousing’s Slowdown Has Economy on the EdgePutin Gets Unexpected Pushback From Ally Over War in UkraineProperty prices c
12h ago Motley Fool
Home Buyers Are Pausing Their Plans for 6 to 12 Months. Should You Do the Same?
Today's housing market is one of the toughest prospective buyers have ever dealt with. Plus, a lack of inventory means the limited properties that do hit the market are often subject to bidding wars, which can be extremely stressful for buyers. Mortgage rates have been on the rise since the start of the year, compounding the issue.
16h ago The Wall Street Journal
Hot Housing Market Keeps Home Foreclosures at Bay
The U.S. moratorium on home foreclosures ended nearly a year ago, but the sizzling housing market is still protecting many delinquent mortgage borrowers from losing their homes.
2d ago Herald-Tribune
Rising interest rates appear to be "putting pressure" on Sarasota-Manatee real estate market
The Realtor Association of Sarasota and Manatee said this past April was the first time homes for sale in the Sarasota metro area showed year-over-year positive growth since 2019.
8h ago The Telegraph
‘Gap in house prices and salaries will cause another financial crisis’
The growing gulf between wages and house prices risks causing another financial crisis, economists have warned.
19h ago GOBankingRates
13 Best Places on the West Coast for Couples To Live on Only a Social Security Check
As of March, the average monthly Social Security benefit is $1,618.29 for an individual, according to the Social Security Administration (SSA). Doubling up for a couple, that's $3,236.58. Not a bad...
2d ago American City Business Journals
Property taxes, interest rates and insurance: The Tarrant County multifamily market is slowing down
Property owners don’t take rising costs sitting down and pass increasing costs to renters. An increased tax burden stifles investment activity and dampens owners’ ability to make capital improvements on properties.
9h ago GOBankingRates
15 Worst States To Live on Just a Social Security Check
The average monthly payment for Social Security retirement benefits is $1,613.77. That's not enough to get by in most places in America, but Social Security was never meant to serve as a retiree's...
2d ago American City Business Journals
Oxford keeps growth streak going as D.R. Horton plans 230 new homes
Oxford, located an hour north of Raleigh and 30 minutes north of Durham, is increasingly catching the eye of some of the biggest homebuilders in the country.
10h ago- Miami Herald
Can pandemic-proof housing market restore investor confidence and revive flagging stocks?
The American housing market has flourished during the ongoing COVID-19 pandemic.
2d ago - Yahoo Finance UK
Average UK house price hits £368,614 in fifth record this year
Annual growth is still on track to be 5% by the end of the year.
1d ago - GOBankingRates
In Less Than a Decade, You Won’t Be Able To Afford a Home in These Cities
Rising home values can quickly transition a reasonable housing market into the type of real estate monster that has consumed places like the San Francisco Bay Area, Los Angeles and New York. While the...
14h ago - Home News Tribune | My Central Jersey
Here are the latest home sales in the Central Jersey real estate market
How much are homes in Middlesex, Somerset and Hunterdon counties selling for? Check our list.
17h ago - Bloomberg
JetBlue Has Access to Second Permanent Heathrow Slot, CEO Says
JetBlue Airways Chief Executive Officer Robin Hayes says the travel industry is seeing pent-up demand, but is afraid rising interest rates may kill the latent demand that's built up for travel. He also says that the airline has access to a second permanent slot at London's Heathrow airport. He speaks with Bloomberg's Guy Johnson on the sidelines of the International Air Transport Association's annual general meeting in Doha, Qatar on "Bloomberg Markets."
17h ago - Oilprice.com
Are Oilfield Service Companies A Buy?
The global boom in oil prices has been great for oil companies, but oilfield service companies haven’t quite kept up with the rush
1d ago - American City Business Journals
HCA calls off deal to buy Utah hospitals after challenge from Feds
The Federal Trade Commission says the nixing of HCA Healthcare's deal to buy five Utah hospitals should be a "lesson learned to hospital systems all over the country."
12h ago - FX Empire
Everything You Need to Know About OpenSea
Launched in 2017, OpenSea is the leading NFT marketplace. While trading volumes have collapsed, the platform is well placed for a comeback.
2d ago - Bloomberg
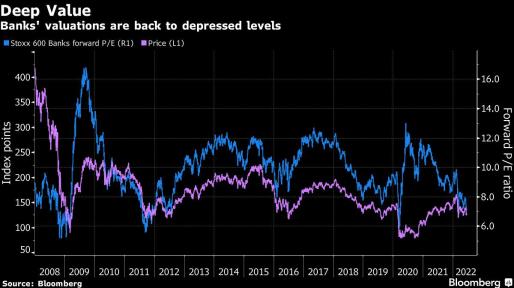
BlackRock Strategist Sees Big Opportunity in European Banks
(Bloomberg) -- European banks may be an unlikely bet when recession risks are stacking up, but BlackRock Inc. says it’s the right time to add exposure to the beleaguered sector.Most Read from BloombergUS Futures Gain With European Stocks; Dollar Slips: Markets WrapPutin May Win in Ukraine, But the Real War Is Just StartingHousing’s Slowdown Has Economy on the EdgePutin Gets Unexpected Pushback From Ally Over War in UkraineGiant Cruise Ship’s Maiden Voyage May Be to a Scrapyard“It’s contentious,
21h ago - The Telegraph
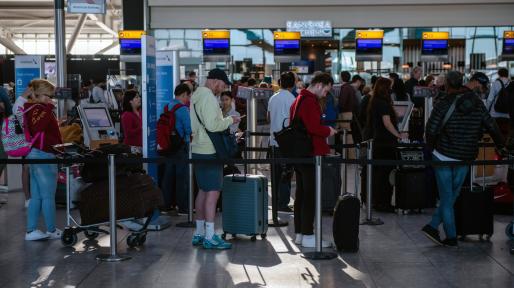
Airlines use post-Brexit loophole to bring in foreign workers
British Airways, easyJet and TUI are using an employment loophole to operate flights with EU crews without British work visas, as they grapple with staff shortages.
2d ago - CoinDesk
First Mover Asia: A Chinese Alternative to Dollar-Based Stablecoins? Widening the Use of the CNH Presents Challenges; BTC Remains Above $20K
The token is a version of China’s currency designed for offshore use; other cryptos are mixed in light trading.
5h ago - Bloomberg
Bitcoin’s Struggle to Hold $20,000 Keeps Crypto Market on Edge
(Bloomberg) -- Bitcoin struggled to hold above the closely-watched $20,000 level, extending a period of marked volatility that saw huge weekend swings.Most Read from BloombergUS Futures Gain With European Stocks; Dollar Slips: Markets WrapPutin May Win in Ukraine, But the Real War Is Just StartingHousing’s Slowdown Has Economy on the EdgePutin Gets Unexpected Pushback From Ally Over War in UkraineGiant Cruise Ship’s Maiden Voyage May Be to a ScrapyardThe largest cryptocurrency fell as much as 4.
22h ago - FX Empire
Gold Stays Below $1850 As Traders Remain Focused On Hawkish Central Banks
Rising interest rates are the main problem for gold bulls.
13h ago - Bloomberg
Traders Bet RBA to Accelerate Tightening With Fed-Size Rate Hike
(Bloomberg) -- Money market traders see an increasing likelihood of Australia’s central bank following the Federal Reserve with a 75-basis-point interest rate hike in July or August.Most Read from BloombergPutin May Win in Ukraine, But the Real War Is Just StartingUS Futures Gain With European Stocks; Dollar Slips: Markets WrapPutin Gets Unexpected Pushback From Ally Over War in UkraineGiant Cruise Ship’s Maiden Voyage May Be to a ScrapyardHousing’s Slowdown Has Economy on the EdgeOvernight inde
1d ago - Fortune
Cathie Wood warns the Fed are ignoring dangerous signals as it plows ahead with draconian rate hikes
The founder of ARK Invest, Wall Street's best-known tech sector evangelist, warns leading economic indicators are flashing red.
12h ago - American City Business Journals
EXCLUSIVE INTERVIEW: California investor adds another Alamo City property to its Texas portfolio
"San Antonio is our favorite place market right now," said Brennen Degner, DB Capital CEO.
9h ago - South China Morning Post
Singapore office-design firm Space Matrix acquires B2B e-commerce site Pursuite amid strong demand for flexible workspaces
Singapore-based Space Matrix, the sixth-largest international design firm in the world by revenue, has acquired Pursuite, one of Asia's first and largest B2B e-commerce platforms for procuring furniture, fixtures and equipment. With the move, Space Matrix aims to make planning and executing office designs more seamless, according to the company's top executive. The acquisition could indicate a trend for design firms that are looking for a way to sell products and services through the lucrative e
19h ago - Bloomberg
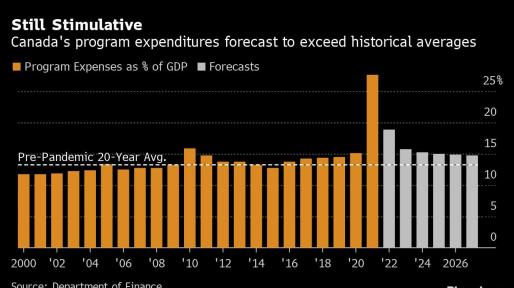
Trudeau Is Shirking Canada’s Inflation Fight, Scotiabank Says
(Bloomberg) -- One of Canada’s largest commercial banks fired a broadside at Prime Minister Justin Trudeau’s government, warning that high levels of federal spending are hurting the fight against inflation.Most Read from BloombergPutin May Win in Ukraine, But the Real War Is Just StartingUS Futures Gain With European Stocks; Dollar Slips: Markets WrapPutin Gets Unexpected Pushback From Ally Over War in UkraineGiant Cruise Ship’s Maiden Voyage May Be to a ScrapyardHousing’s Slowdown Has Economy o
1d ago - MoneyWise
Warren Buffett's portfolio is full of buyback opportunities which he calls 'the best use of cash'. Here are 3 companies with the biggest hidden dividend potential
The Oracle of Omaha regularly buys back Berkshire Hathaway shares too.
2d ago - Bloomberg
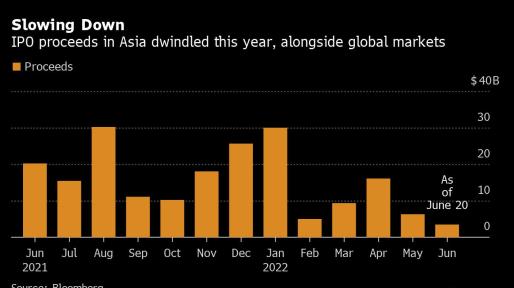
ThaiBev’s Brewery Unit, Battery Supplier Brave Asia’s IPO Market
(Bloomberg) -- The brewery unit of Thai Beverage Pcl and a Chinese supplier of a material used in batteries started gauging demand for share sales in Singapore and Hong Kong, respectively, testing appetite in a tough market for listings globally.Most Read from BloombergPutin May Win in Ukraine, But the Real War Is Just StartingUS Futures Gain With European Stocks; Dollar Slips: Markets WrapPutin Gets Unexpected Pushback From Ally Over War in UkraineHousing’s Slowdown Has Economy on the EdgeGiant
1d ago


Recommend
About Joyk
Aggregate valuable and interesting links.
Joyk means Joy of geeK