

OpenTelemetry in Action: Optimizing Database Operations
source link: https://dzone.com/articles/opentelemetry-in-action-optimizing-database-operations
Go to the source link to view the article. You can view the picture content, updated content and better typesetting reading experience. If the link is broken, please click the button below to view the snapshot at that time.
OpenTelemetry in Action: Optimizing Database Operations
Learn to use OpenTelemetry to discover database performance issues and remediate them without significantly altering your application.
Many software developers can attest that some of the most significant issues in their applications arise from database performance. Though many developers prefer to use a relational database for enterprise applications, typical logging and monitoring solutions provide limited signals to detect database performance issues. Rooting out common bad practices such as chatty interactions between the application code and the database is non-trivial.
As developers, we need to understand how our database is performing from the context of user transactions. Ideally, we would have a common tool that can monitor the performance of both the application and the database concerning user transactions. OpenTelemetry has emerged as a popular tool for application monitoring, but it can also be extended for monitoring databases.
In this article, we’ll look at some common database performance issues to see how we can use OpenTelemetry to identify and fix them easily. For a hands-on learning experience, we’ll build a simple application that uses a SQL Server database. We’ll instrument the application with standard OpenTelemetry libraries and connect the application to an ingestion platform, Lightstep. Finally, we’ll use the ingested telemetry to surface our database issues, discussing the steps to resolve them.
The Basics of Observability and OpenTelemetry
If you’re unfamiliar with observability or OpenTelemetry, I recommend familiarizing yourself with the previous post in this “OpenTelemetry in Action” series. In that post, we cover the three types of information collected in an observable application (logs, metrics, and traces). We also look at the key components of the OpenTelemetry data model.
You can refer to this documentation for more in-depth coverage of how OpenTelemetry works.
Using OpenTelemetry to Monitor Databases
We noted how OpenTelemetry is used for instrumenting applications for observability and how it can be extended for us in monitoring databases. This monitoring is done through database clients rather than directly on the database server.
Due to access limitations or the nature of your platform, you may be restricted from installing monitoring libraries on a database server. Instead, you can use the OpenTelemetry instrumentation to monitor the database from the client-side. Though the instrumentation will not give you insights into the internals of the database, it will provide you with sufficient information to troubleshoot performance issues to improve the application user experience.
Using OpenTelemetry to Detect Database Performance Issues
Our project setup for detecting database performance issues is very similar to our setup in Part One, in which we used OpenTelemetry to identify database dependencies.
Again, we’ll use the .NET SQLClient instrumentation for OpenTelemetry and Lightstep for telemetry storage and analysis.
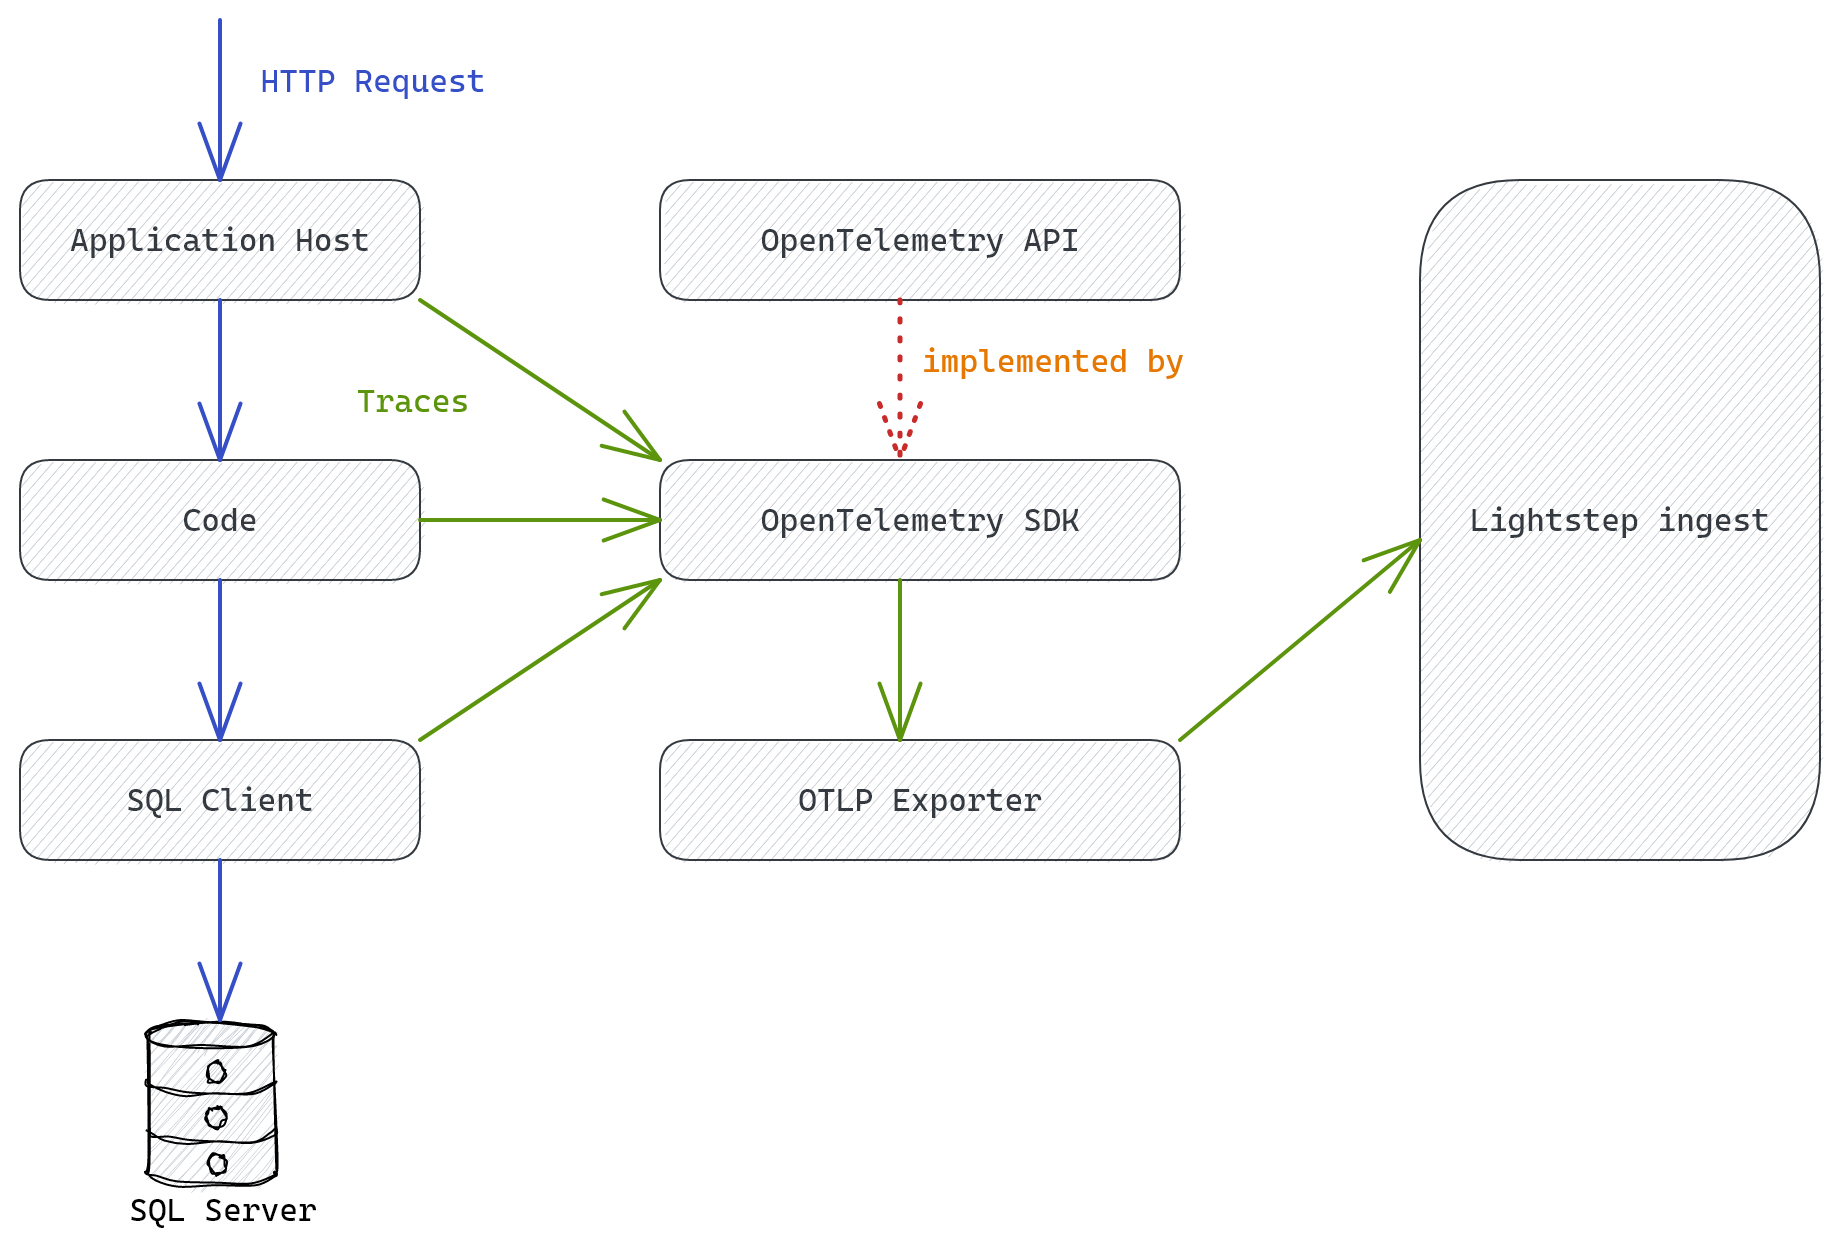
We’ll instrument our application with the OpenTelemetry SDK to emit observability signals. We’ll use the OpenTelemetry Protocol (OTLP) Exporter to send data to Lightstep, aggregating our traces and providing us with dashboards to analyze for insights.
Demonstration
For our demonstration, we’ll create a simple Employee Management Service (EMS) modeled as an ASP.NET Core minimal API. Our API has the following endpoints:
POST /ems/pay/{employeeId}: Calculates the pay of an employee based on the hours they logged on various projects. This endpoint will exhibit a chatty interaction with the database.POST /ems/billing/pay-raise: Updates the pay of every employee earning under USD $300 to USD $300. This endpoint will exhibit querying a non-indexed field in the database.POST /ems/payroll/remove/{employeeId}: Removes an employee from payroll. This endpoint will show how database locks affect the performance of queries.POST /ems/add-employee/{employeeId}: Adds an employee to the payroll and timekeeping systems. This simulates how the performance of a business transaction spanning multiple services — and so, multiple database calls — can affect system performance.
The application is straightforward, but we’ve kept it concise to focus on instrumentation and the use of OpenTelemetry. For that reason, you won’t see coding best practices such as exception handling.
The application database consists of two tables: Payroll and Timekeeping, which save the employee pay rate and hours worked on a project.
The complete source code of this EMS application is available in this GitHub repository.
Spinning Up The Database
We start by spinning up a SQL server instance in docker:
docker run \
-e "ACCEPT_EULA=Y" \
-e "SA_PASSWORD=Str0ngPa$$w0rd" \
-p 1433:1433 \
--name monolith-db \
--hostname sql1 \
-d mcr.microsoft.com/mssql/server:2019-latest
Then, we create the EMS database and the tables used by our application, along with storing some seed data:
CONSTRAINT [PK_Timekeeping] PRIMARY KEY CLUSTERED ([EmployeeId] ASC, [ProjectId] ASC, [WeekClosingDate] ASC)
IF NOT EXISTS(SELECT * FROM sys.databases WHERE name = 'EMSDb')
BEGIN
CREATE DATABASE EMSDb
END
GO
USE EMSDb
IF OBJECT_ID('[dbo].[Timekeeping]', 'U') IS NULLBEGIN
CREATE TABLE [Timekeeping] (
Implementing the API Endpoints
Then, we write the code for the API endpoints. We replace the boilerplate code in the Program class with the following:
var projects = await db.QueryAsync<Timekeeping>("SELECT EmployeeId,ProjectId,WeekClosingDate,HoursWorked FROM Timekeeping WHERE EmployeeId=@EmpId",using System.Data.SqlClient;
using System.Diagnostics;
using Dapper;
using OpenTelemetry.Exporter;
using OpenTelemetry.Resources;
using OpenTelemetry.Trace;
var builder = WebApplication.CreateBuilder(args);
var lsToken = builder.Configuration.GetValue<string>("LsToken");
Now that our application code is in place, let’s automate the process of detecting the performance issues we have caused.
Adding Instrumentation
We instrument the application with the OpenTelemetry SDK and SqlClient instrumentation library for .NET. First, we add the following NuGet package references to the API’s project file:
<PackageReference Include="OpenTelemetry" Version="1.2.0-rc2" />
<PackageReference Include="OpenTelemetry.Exporter.OpenTelemetryProtocol" Version="1.2.0-rc2" />
<PackageReference Include="OpenTelemetry.Extensions.Hosting" Version="1.0.0-rc9" />
<PackageReference Include="OpenTelemetry.Instrumentation.AspNetCore" Version="1.0.0-rc9" />
<PackageReference Include="OpenTelemetry.Instrumentation.Http" Version="1.0.0-rc9" />
<PackageReference Include="OpenTelemetry.Instrumentation.SqlClient" Version="1.0.0-rc9" />
The SDK provides us with several extension methods that we can use to quickly plug OpenTelemetry into the request processing pipeline.
Next, we instrument OpenTelemetry in our application. This will also instrument the SqlClient to emit verbose telemetry. That telemetry will be key to surfacing database performance issues.
// Create resources (key-value pairs) that describe your service such as service name and version
// Configure tracing
builder.Services.AddOpenTelemetryTracing(builder => builder
// Customize the traces gathered by the HTTP request handler
.AddAspNetCoreInstrumentation(options =>
{// Only capture the spans generated from the ems/* endpoints
options.Filter = context => context.Request.Path.Value?.Contains("ems") ?? false;options.RecordException = true;
// Add metadata for the request such as the HTTP method and response length
options.Enrich = (activity, eventName, rawObject) =>
{Although the instrumentation is sufficient for us in its current state, let’s enrich the data further by adding relevant traces.
First, we define a tracer from which our application spans will originate.
var activitySource = new ActivitySource("my-corp.ems.ems-api");Next, we create a span and add relevant details — attributes and events:
var projects = await db.QueryAsync<Timekeeping>("SELECT EmployeeId,ProjectId,WeekClosingDate,HoursWorked FROM Timekeeping WHERE EmployeeId=@EmpId",app.MapGet("/ems/pay/{empId}", async (int empId, SqlConnection db) => { using var activity = activitySource.StartActivity("Chatty db operation", ActivityKind.Server);activity?.SetTag(nameof(Timekeeping.EmployeeId), empId);
// op 1
var payroll =
await db.QuerySingleOrDefaultAsync<Payroll>("SELECT EmployeeId,PayRateInUSD FROM Payroll WHERE EmployeeId=@EmpId", new { EmpId = empId });
// op 2
We follow the same procedure to instrument the remaining endpoints.
Sending Instrumentation Data to Lightstep
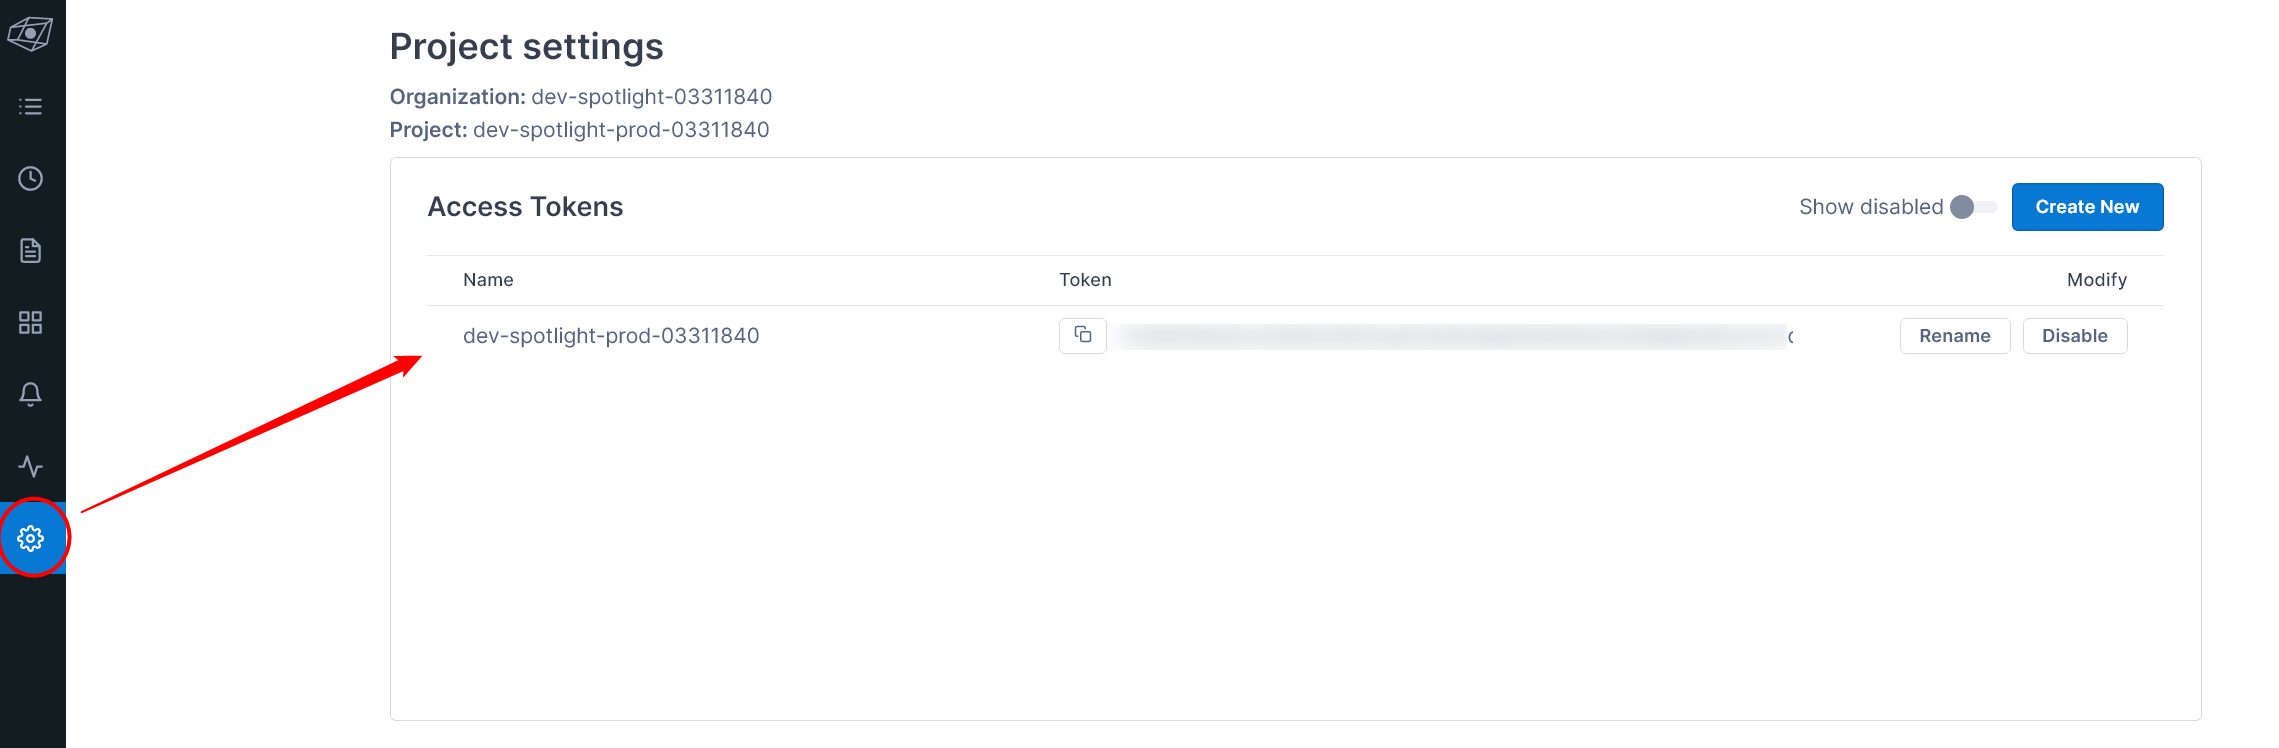
To connect our application to Lightstep for data ingestion, we’ll need an API key. First, we create an account with Lightstep. Then, from the Project settings page, we copy the Token, which is our API key.
We paste that token into our appsettings file.
{ "Logging": { "LogLevel": {"Default": "Information",
"Microsoft.AspNetCore": "Warning"
}
},
"AllowedHosts": "*",
"ConnectionStrings": {"EmployeeDbConnectionString": "Server=localhost;Database=EMSDb;User Id=sa;Password=Str0ngPa$$w0rd;"
},
Finding Common Database Issues
Our application is now ready. Let’s review our common database issues one by one.
Chatty/Sequential Interaction With Database
Let’s bring the /ems/pay/{empId} endpoint back into focus. From an examination of the code above, you’ll see that this endpoint makes two calls to the database, one after the other.
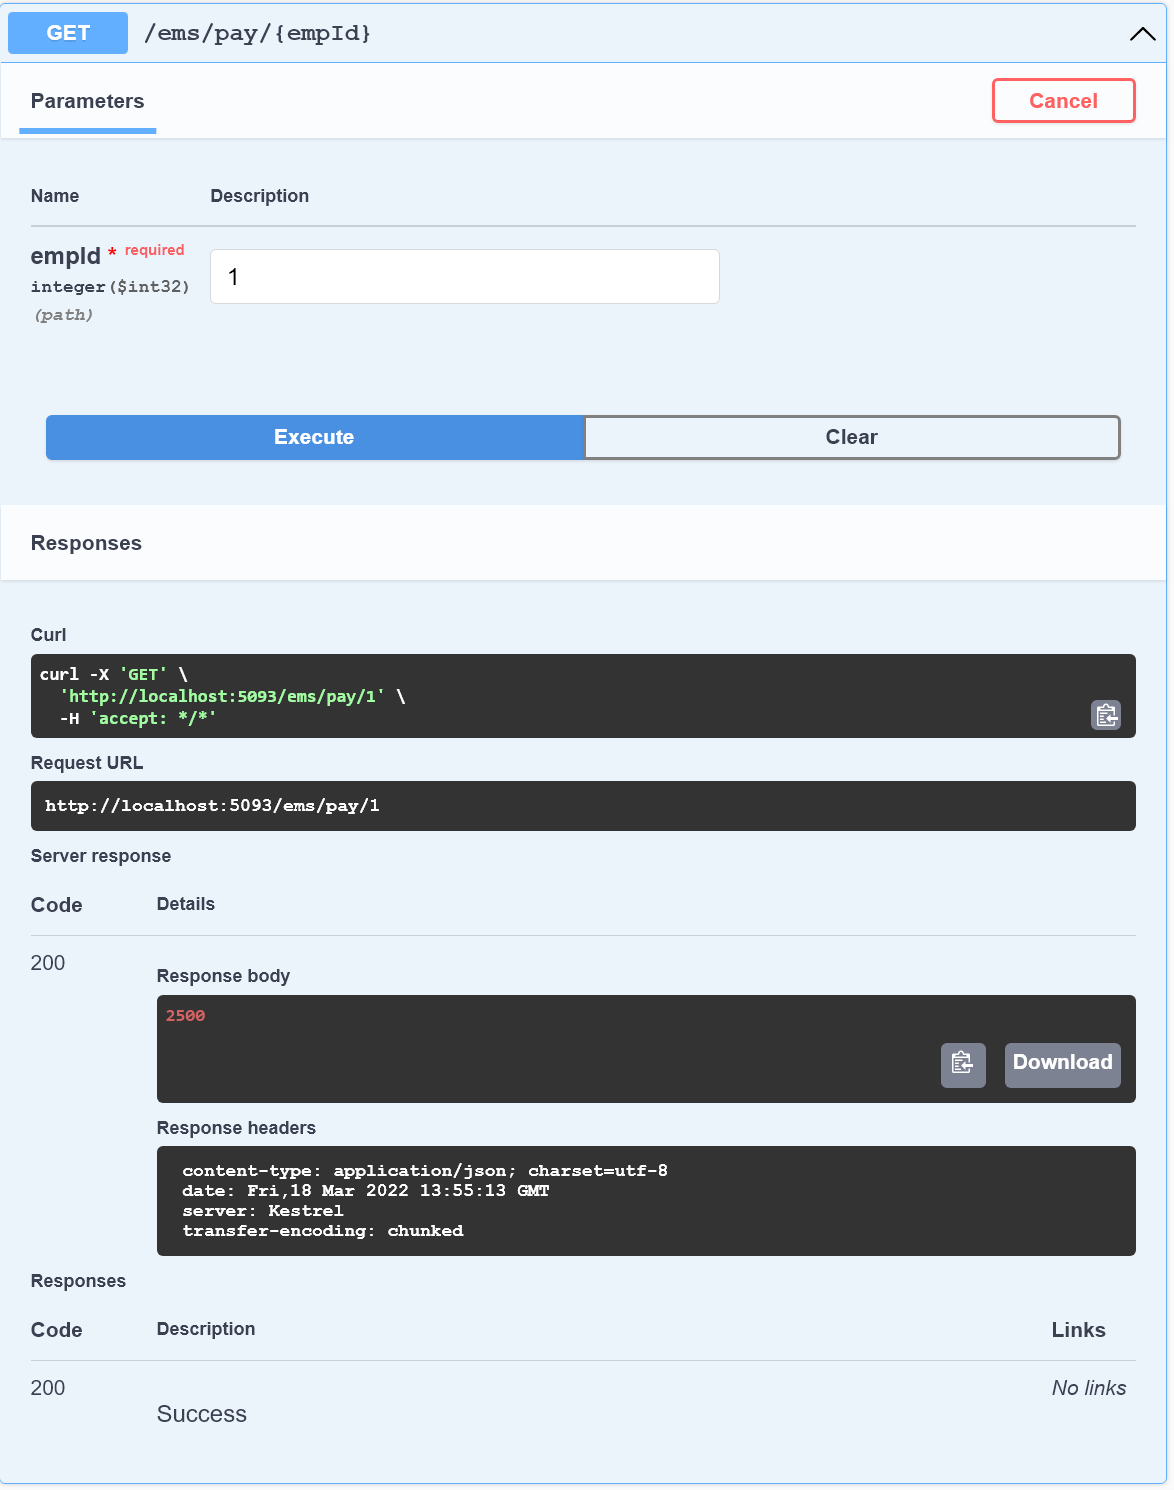
Non-optimal, chatty database calls slow down user transactions. Granted, you will encounter cases in which you need to read a record, make a decision based on the state of the record, and then update the record. In such cases, having multiple database calls is unavoidable. For fetching records, however, you can almost always use a single query. We launch the application (dotnet run) and send some requests to the /ems/pay/{empId} endpoint. Here is an example of a request that I sent to the endpoint:
Next, we navigate to the Lightstep observability portal and click on the Operations tab to see all the spans Lightstep received from the application.
We click on the /ems/pay/{employeeId} operation to view its end-to-end trace. By viewing the spans, we can ascertain the sequence of operations for any request, including database interactions. Clicking on the spans brings up its events and attributes, giving us deeper insight into the operation.
The final two spans visible in the trace are EMSDb, generated by our instrumented SQL Client. We click on the spans to view their attributes and events. They look like this:
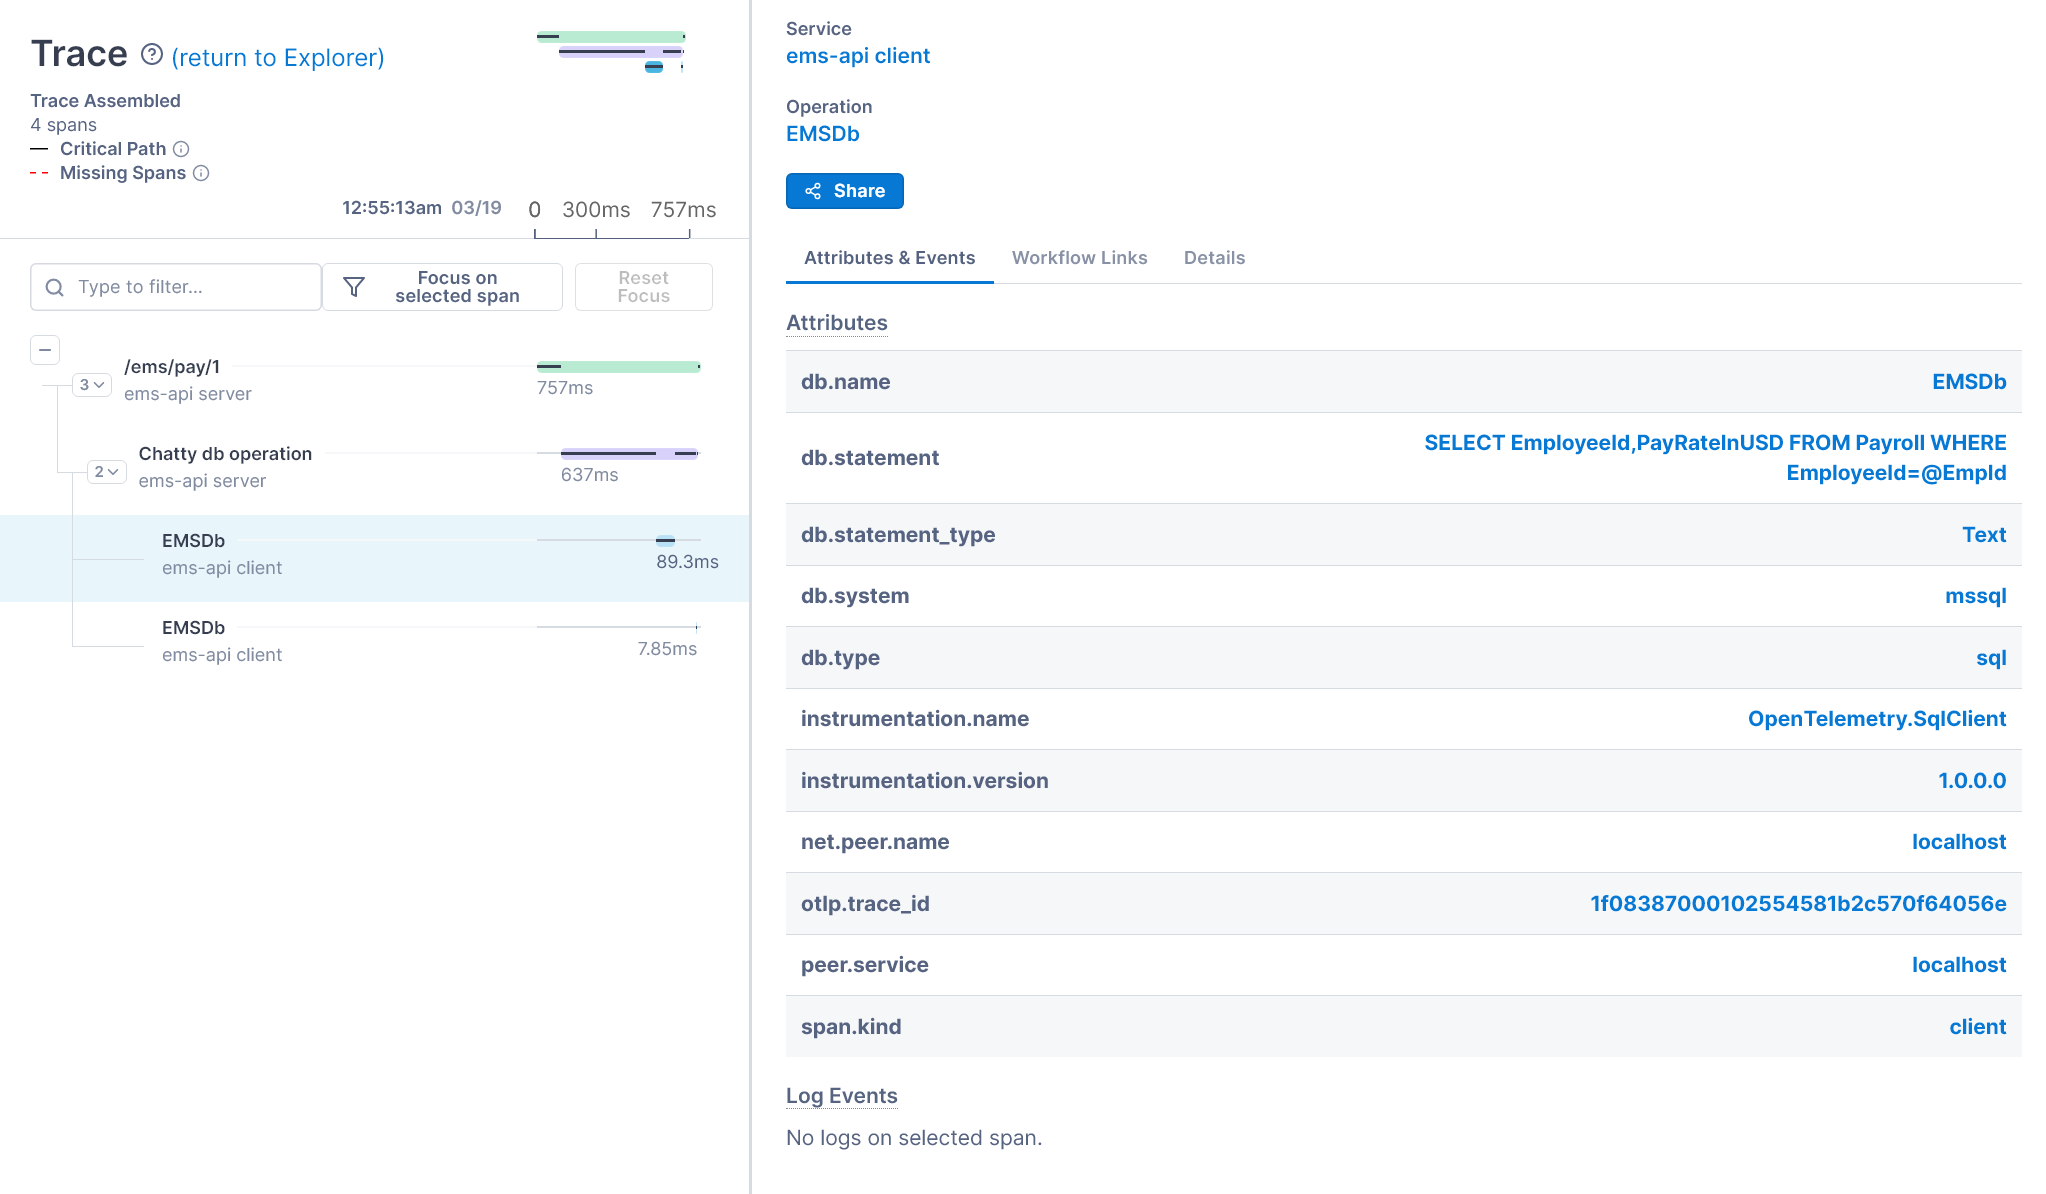
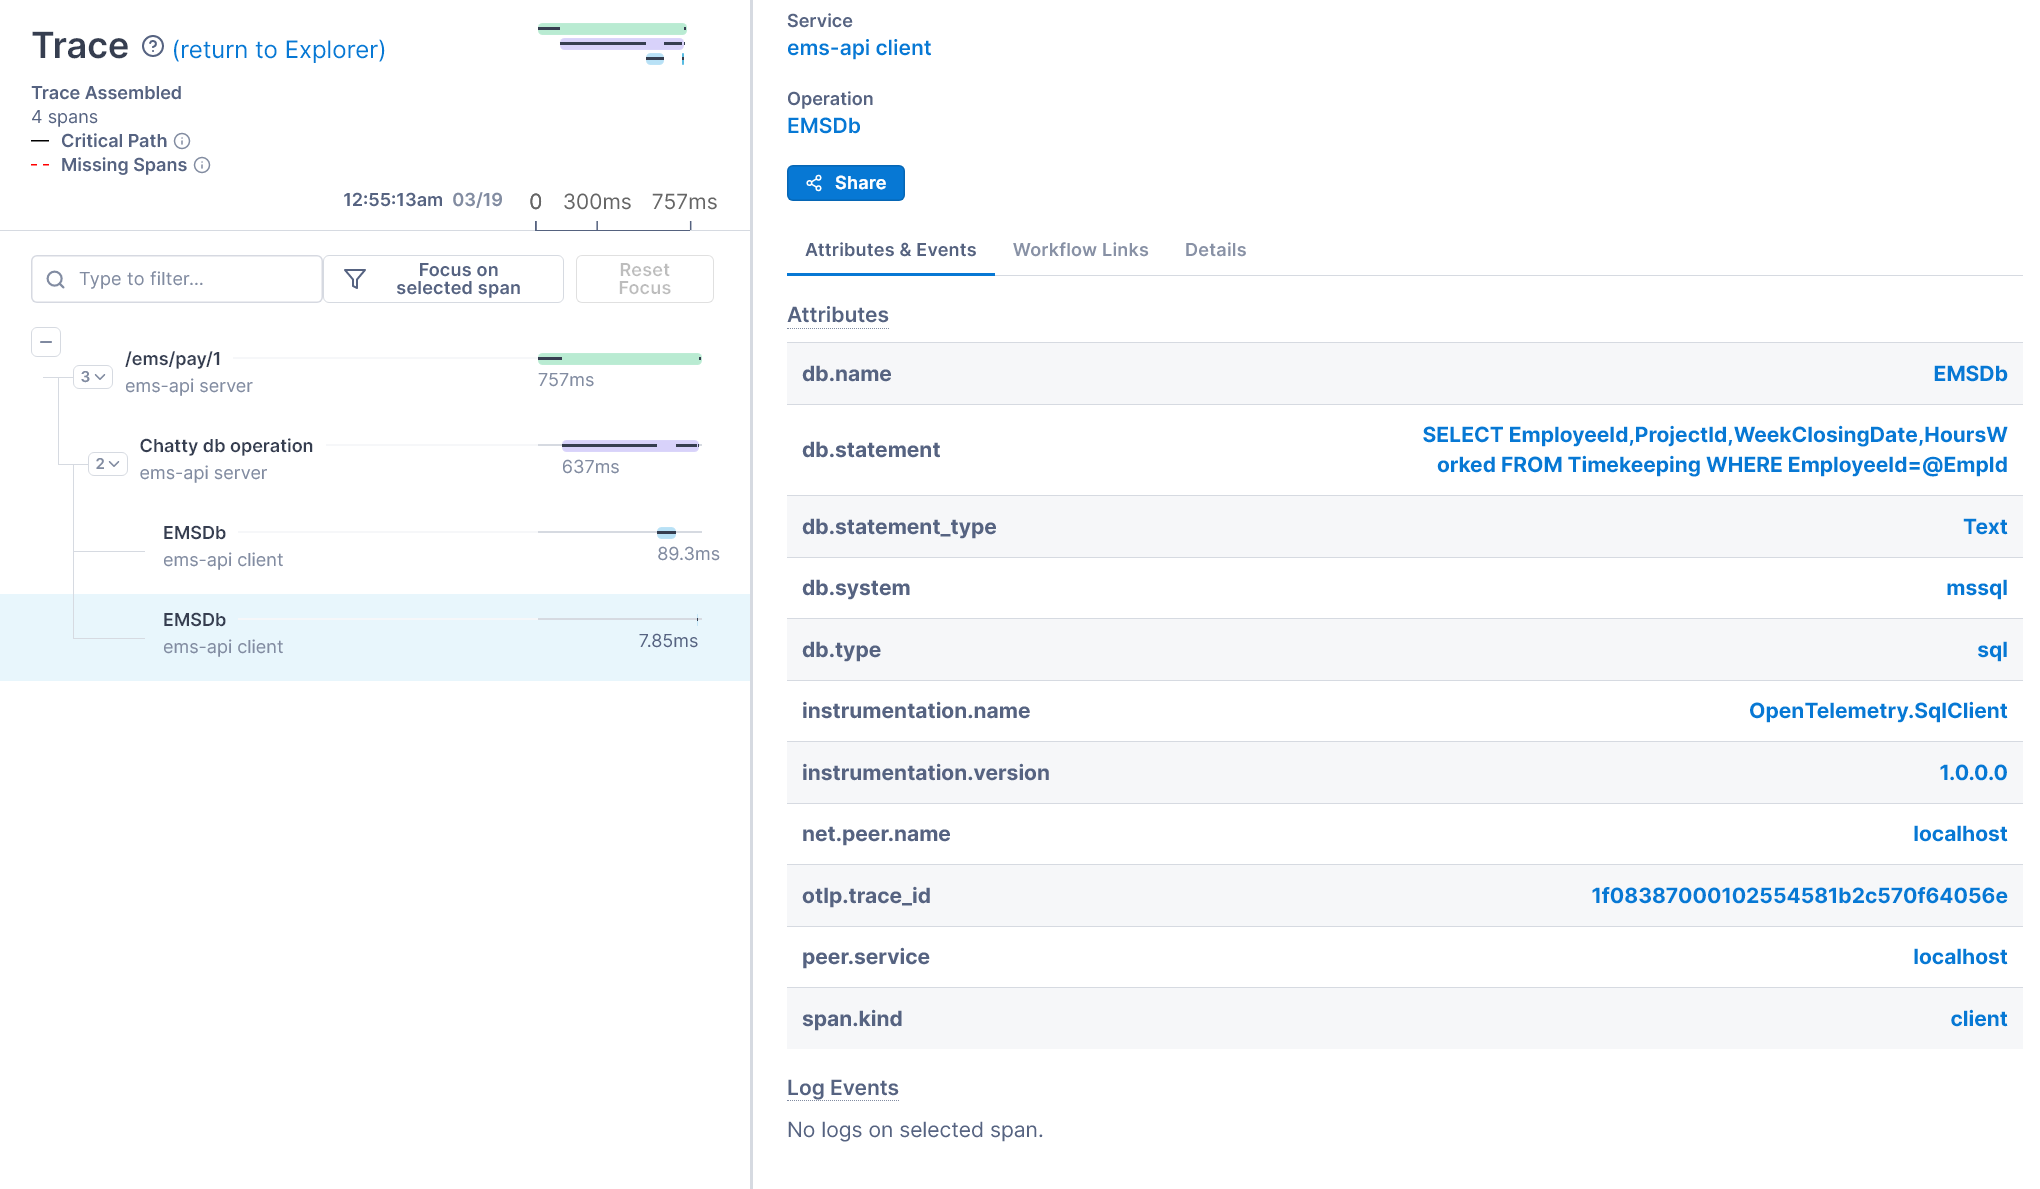
From these details, we can gain some important insights:
- The name of the database
- The SQL statement used in the database operation
- The type of SQL statement (text or stored procedure)
- The hostname of the service which made the request
- The duration of the database operation
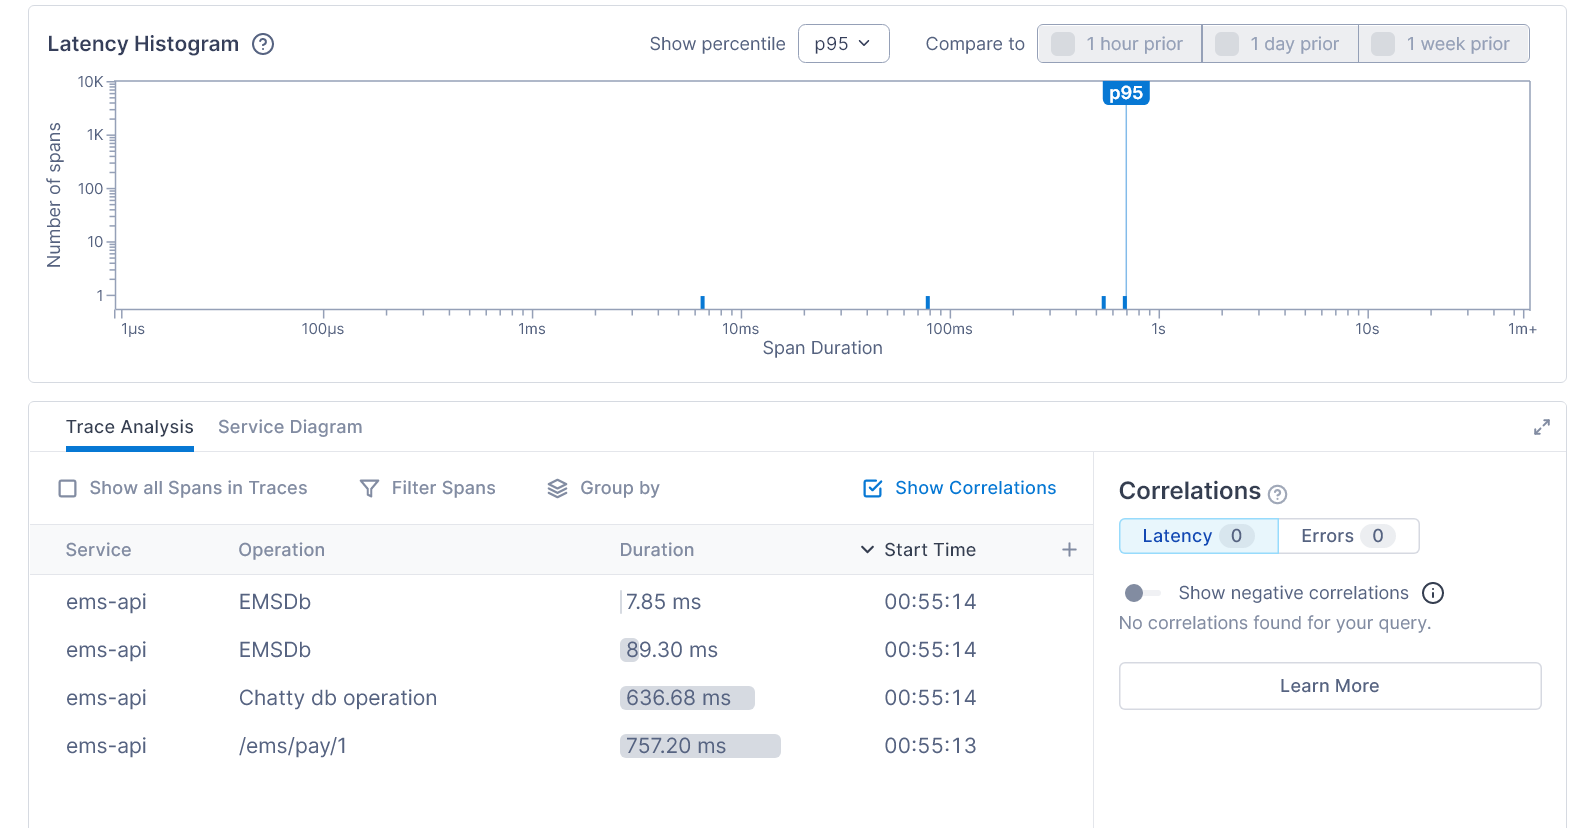
The chatty behavior of the endpoint is very evident from the trace. A dead giveaway is the presence of two database operations in a read operation and the absence of custom traces between them to record any business logic. To resolve this issue, we need to combine the queries so that they produce a single resultset.
Unoptimized Queries
Query performance is an important metric to monitor. If queries request a large amount of data (for example, by using the SELECT * approach or filtering data on non-indexed fields), then the performance of the user transactions will suffer. Let’s revisit the /emp/billing/pay-raise endpoint:
app.MapPost("/ems/billing/pay-raise/", async (SqlConnection db) => { using var activity = activitySource.StartActivity("Non optimized query", ActivityKind.Server); var recordsAffected = await db.ExecuteAsync("UPDATE Payroll SET PayRateInUSD = 300 WHERE PayRateInUSD < 300");return Results.Ok(recordsAffected);
})
.WithName("Pay-Raise").Produces(StatusCodes.Status200OK);
The query filters records on the PayRateInUSD field, which we haven’t indexed. Although this issue will not be evident in a database with a small number of records, such queries in large databases will take a lot of time. The query time is apparent in the traces collected for the endpoint, which is shown below:
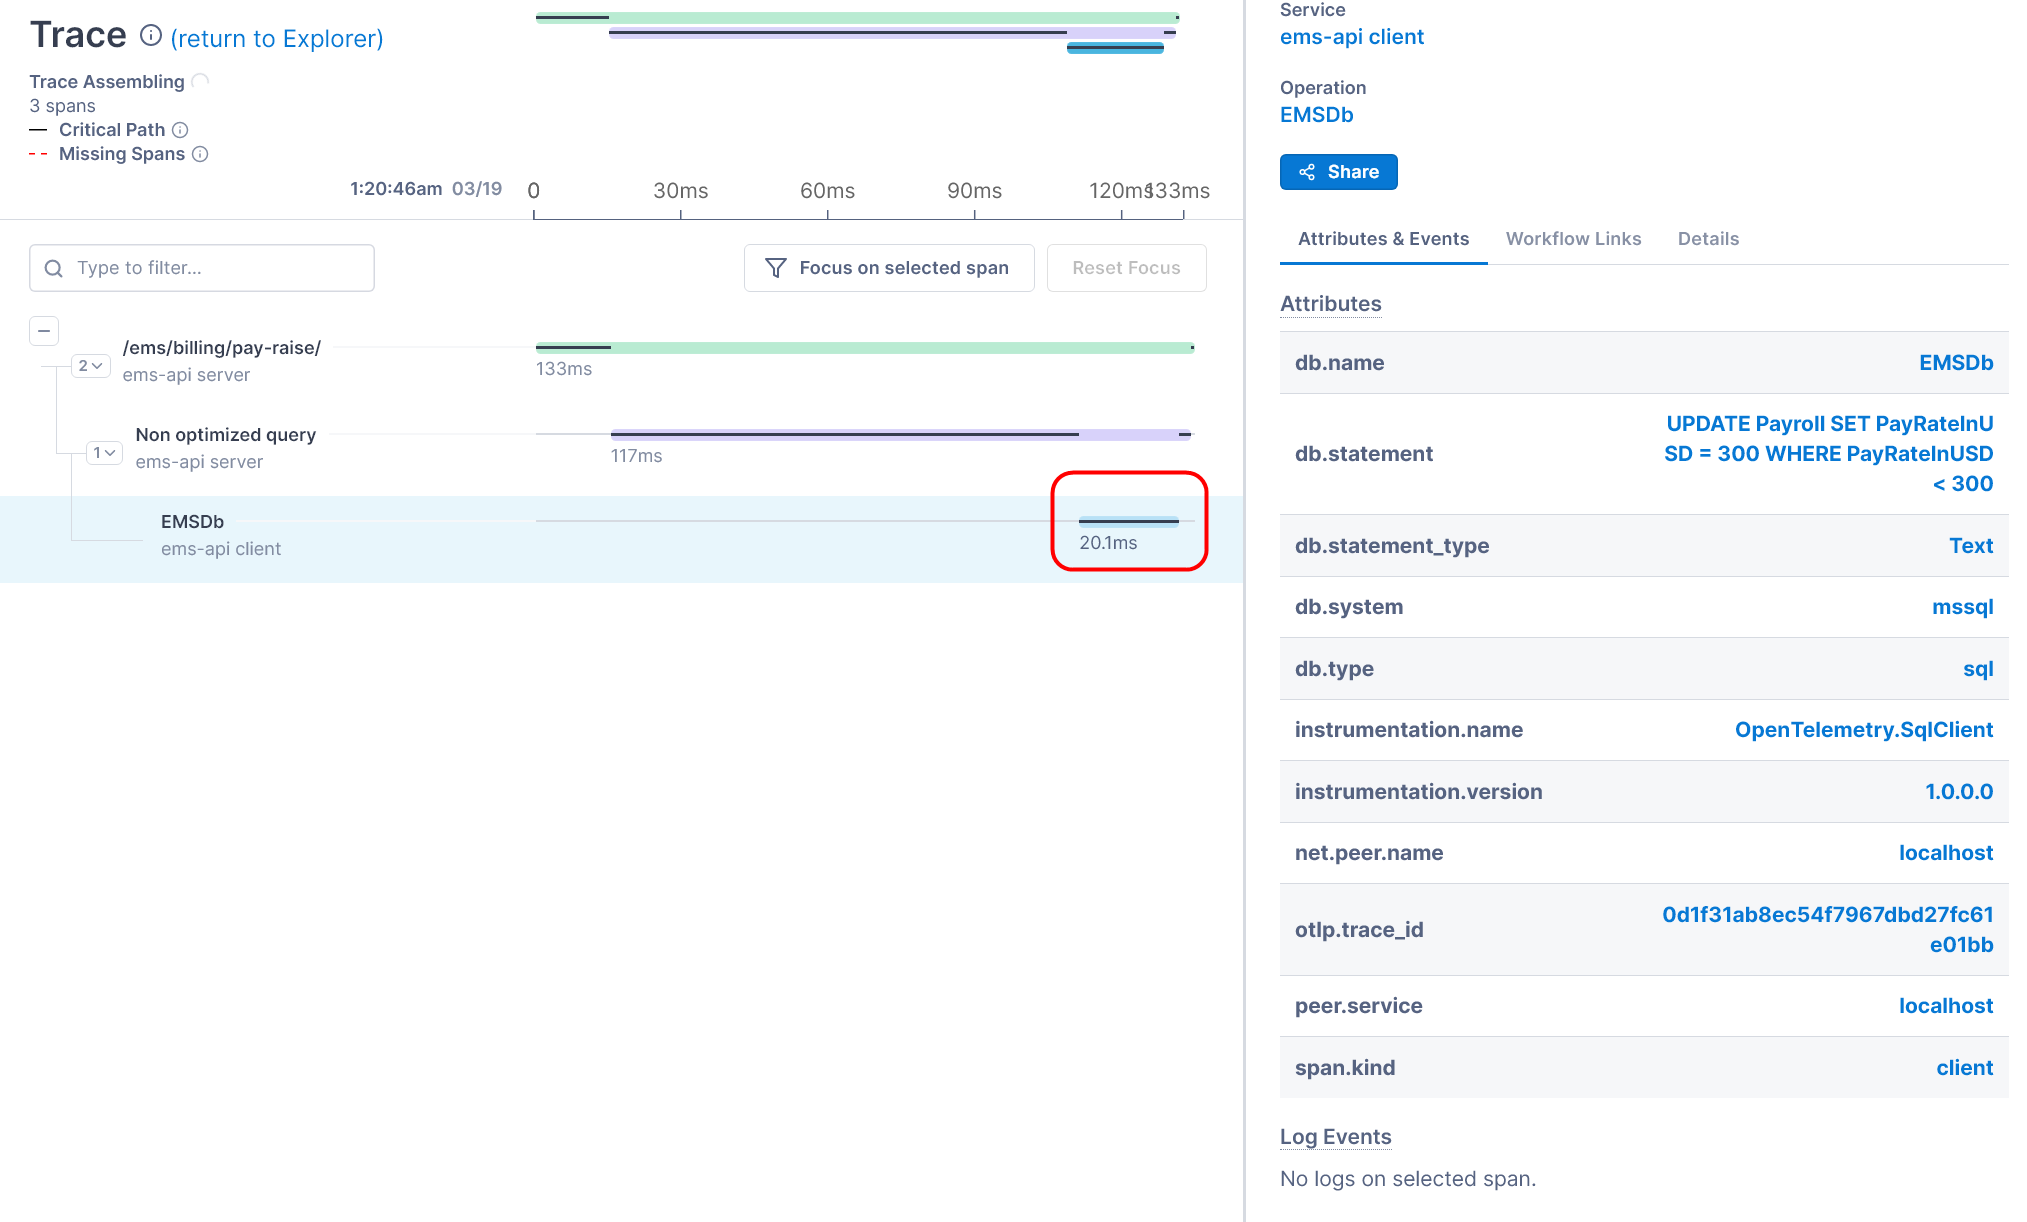
If the query duration exceeds the acceptable limit, you can inspect the operation further, indexing any fields used for filtering. This will speed up your database performance.
Database Locks
Database locks are one of the most complex issues to find because they only affect the operation waiting for a lock to be released. Meanwhile, the operation acquiring the lock proceeds unaffected. However, OpenTelemetry makes it easy to detect database locks because we can view the culprit operation and the operation waiting on the lock in the same trace. Let’s discuss the code behind our offending endpoint at /ems/payroll/remove/{empId}:
"SELECT EmployeeId,PayRateInUSD FROM Payroll WHERE EmployeeId=@EmpId", new { EmpId = empId });app.MapPost("/ems/payroll/remove/{empId}", async (int empId, SqlConnection db) => { using var activity = activitySource.StartActivity("Db lock", ActivityKind.Server);activity?.SetTag(nameof(Timekeeping.EmployeeId), empId);
Payroll payrollRecord = new();
async Task DeleteRecord()
{db.Open();
await using var tr = await db.BeginTransactionAsync();
await db.ExecuteAsync("DELETE FROM Payroll WHERE EmployeeId=@EmpId", new { EmpId = empId }, tr);The DELETE operation begins a transaction but does not commit it for some time. This operation locks the record that will be deleted once the transaction is committed. After giving the DELETE transaction a little head start, we execute a SELECT operation to read the same record. The SELECT operation can’t proceed unless the DELETE operation releases the lock. This is clearly evident from the OpenTelemetry trace of this operation:
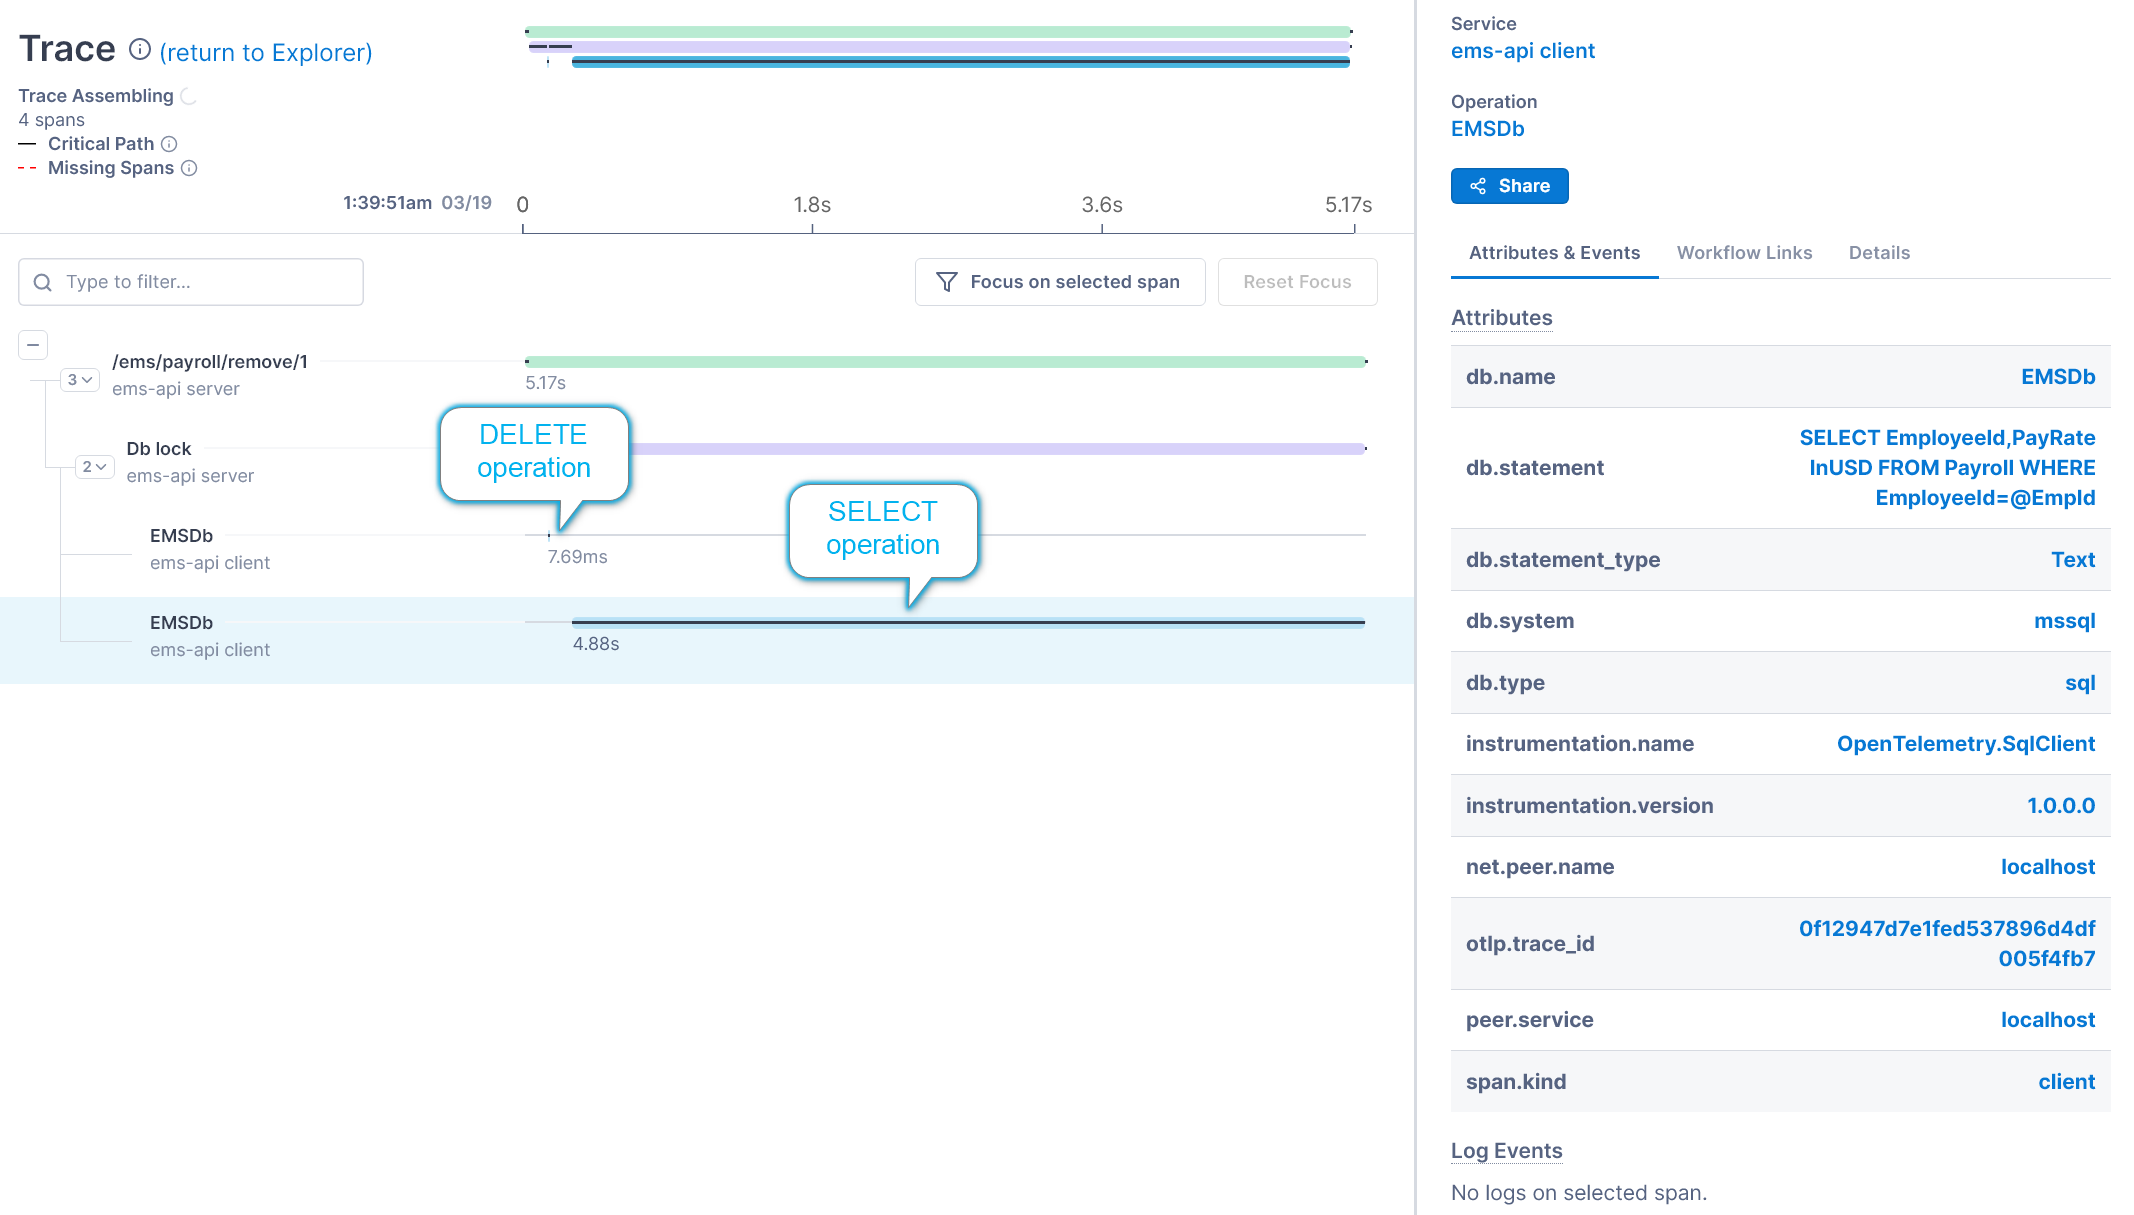
If you were to investigate these operations individually, you might assume that the SELECT operation is the source of the performance issue. However, the aggregated spans of the database operations point to the sequential dependency between the DELETE and SELECT operations, which will prompt you to consider their relationship with one another.
The solution for the issue is to immediately commit a transaction without waiting for any lengthy operations to complete.
Business Transactions Spanning Multiple Services
If your user’s transactions span multiple services, then you should measure the response times of the different parts of the application and network. The /ems/add-employee/{empId} endpoint simulates a business transaction spread across two services as follows:
using var innerActivity = activitySource.StartActivity("Second operation of business transaction", ActivityKind.Server);app.MapPost("/ems/add-employee/{empId}", async (int empId, SqlConnection db) => {using var activity =
activitySource.StartActivity("Multiple ops in a business transaction", ActivityKind.Server);activity?.SetTag(nameof(Timekeeping.EmployeeId), empId);
//op 1
await db.ExecuteAsync("INSERT INTO Payroll Values(@EmployeeId, @PayRateInUSD)", new Payroll { EmployeeId = empId, PayRateInUSD = 100 });
// Simulate service call by creating another span
Let’s look at the trace generated for this operation, which clearly shows database operations for each service.
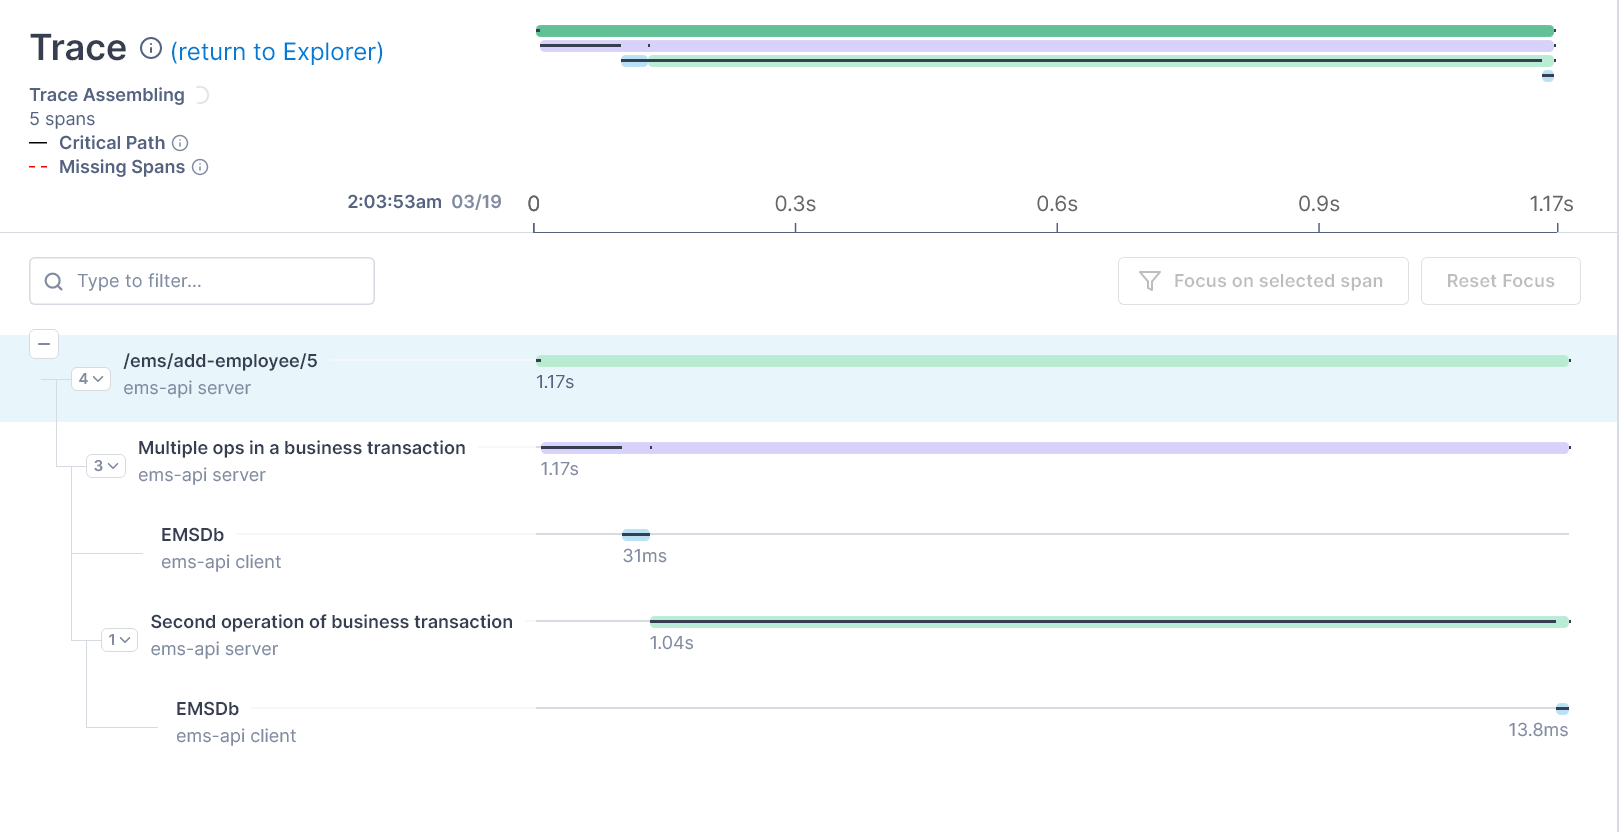
The solution to such issues can vary in complexity. For a simple fix, you can optimize the network performance by placing the services physically close to one another (for example, in the same data center). A more complex approach would be to remodel the application to be eventually consistent so that you can asynchronously complete a transaction.
Database Exceptions
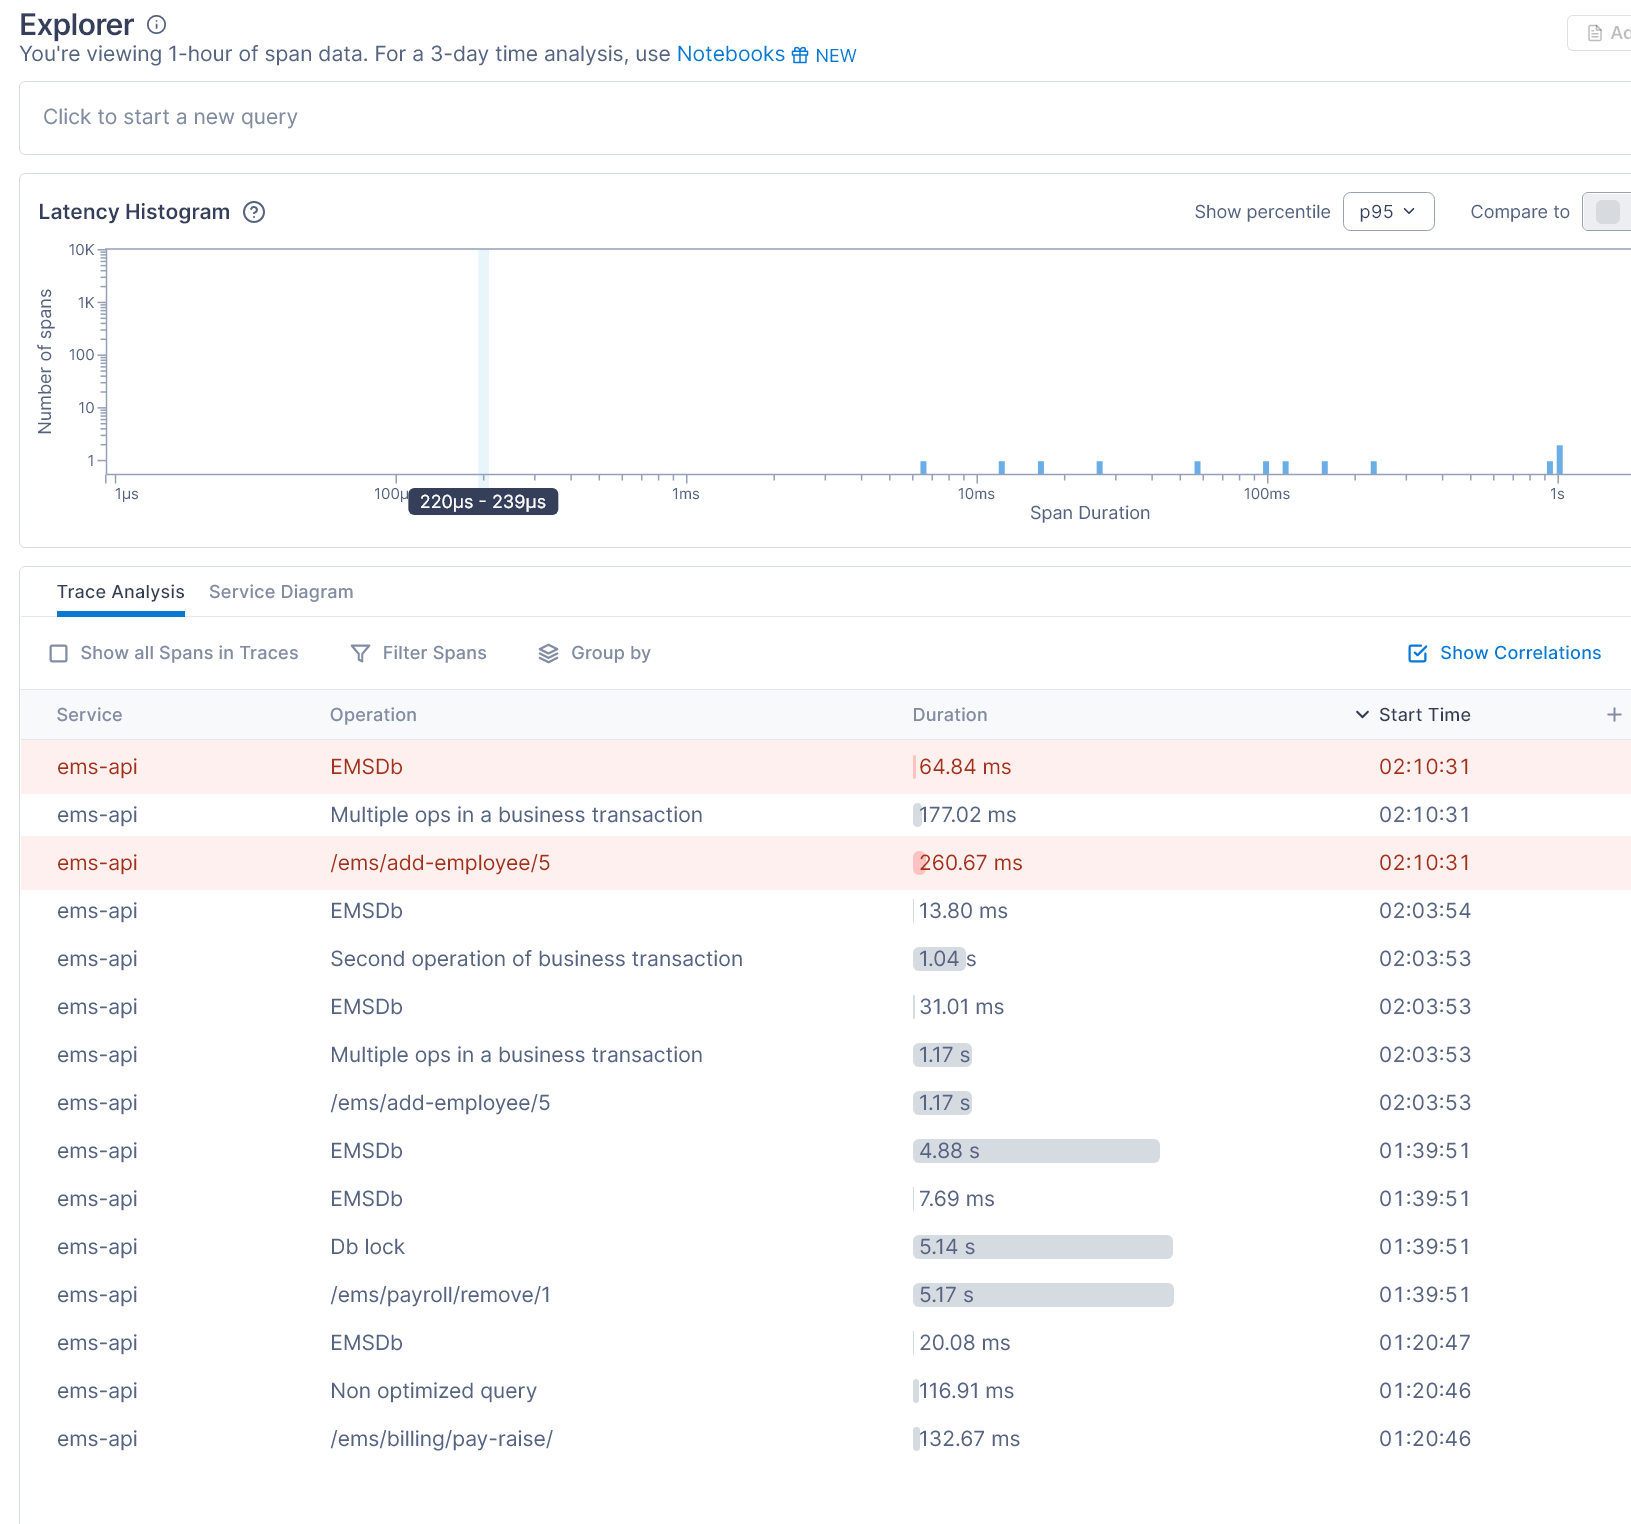
Our SQL client is instrumented to capture exceptions. Lightstep understands when spans carry exception details, highlighting such operations on the dashboard. We use the /ems/add-employee/{empId} endpoint to insert a duplicate record in the database, which throws an exception.
Lightstep highlights the exception in the Explorer window as follows:
Clicking on the operation shows us the exception details captured as an event.
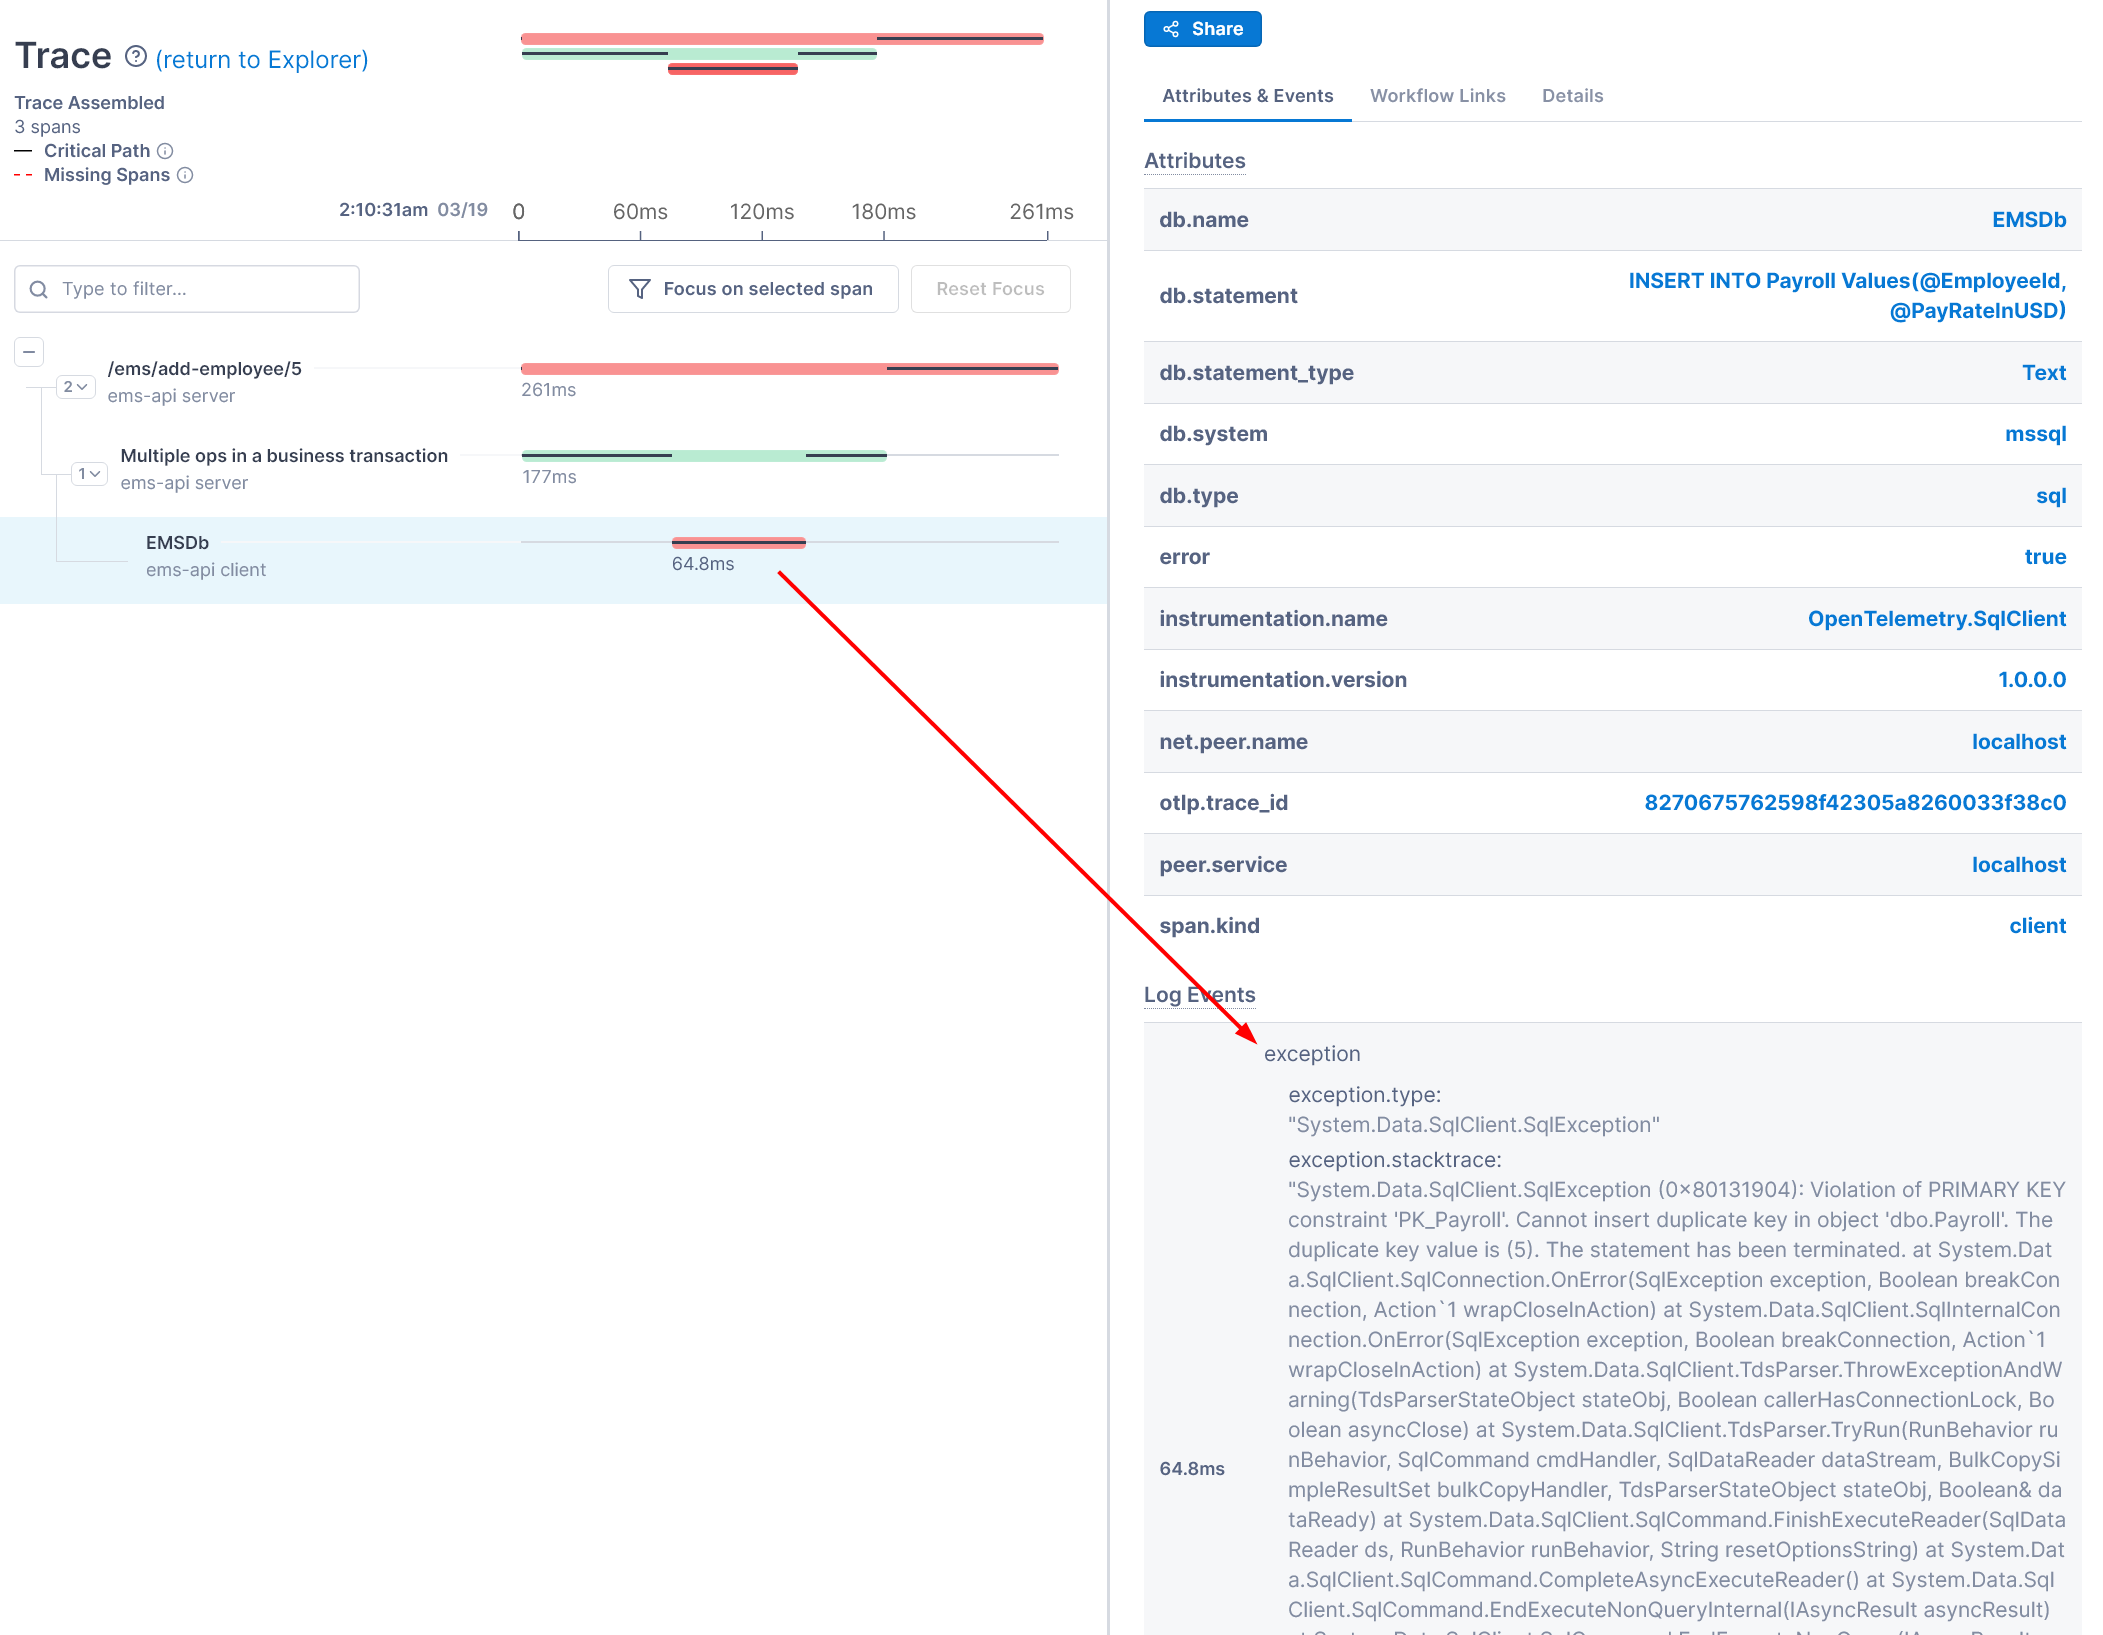
We can use OpenTelemetry to record critical state changes and exceptions in the form of events, using the information to debug issues when they occur.
Conclusion
This article discussed how OpenTelemetry can be used to easily detect performance issues in an application database. The performance of an application database should be monitored in concert with user transactions. This helps us to avoid making unnecessary, low-value database optimizations.
Without altering the database in any manner, we instrumented a simple application to surface several types of database performance issues. With sufficient context, we can either quickly fix the underlying issue, or we can confidently develop a plan to improve the performance of our database.
Recommend
About Joyk
Aggregate valuable and interesting links.
Joyk means Joy of geeK