

Web 前端实战(三):雷达图 - shiramashiro
source link: https://www.cnblogs.com/shiramashiro/p/16301511.html
Go to the source link to view the article. You can view the picture content, updated content and better typesetting reading experience. If the link is broken, please click the button below to view the snapshot at that time.
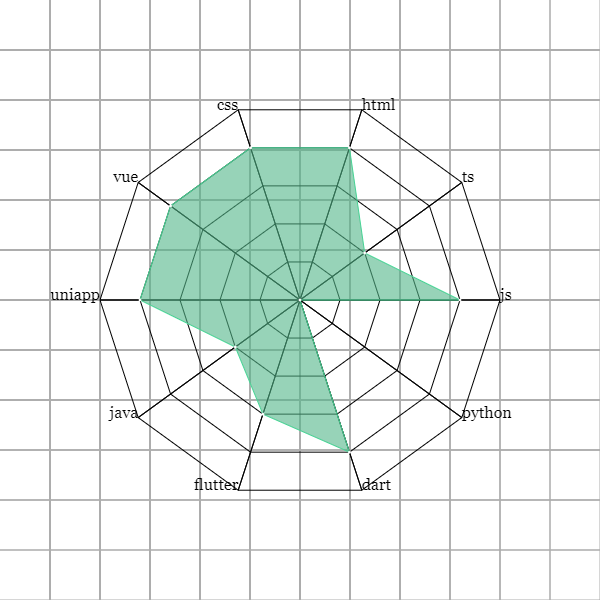
在《Canvas 线性图形(五):多边形》实现了绘制多边形的函数。本篇文章将记录如何绘制雷达图。最终实现的效果是这样的:
绘制雷达图
雷达图里外层
如动图中所示,雷达图从里到外一共有 6 层,所以,我们需要改造绘制多边形的函数:
点击查看绘制基础雷达图代码
function calcPolygonX(radarX, radius, increaseAngle) {
	return radarX + radius * Math.cos(increaseAngle);
}

function calcPolygonY(radarY, radius, increaseAngle) {
	return radarY - radius * Math.sin(increaseAngle);
}

// 绘制多边形的函数
function drawPolygon(radarMapTotalSides, radius, radarX, radarY, ctx) {
	let averageAngle = Math.PI * 2 / sides;
	let increaseAngle = 0;
	let targetX, targetY;

	ctx.beginPath();
	for ( let i = 0; i < radarMapTotalSides; i++ ) {
		targetX = calcPolygonX(radarX, radius, increaseAngle);
		targetY = calcPolygonY(radarY, radius, increaseAngle);
		ctx.lineTo(targetX, targetY);
		increaseAngle += averageAngle;
	}

	ctx.closePath();
	ctx.stroke();
}

// 绘制雷达图的函数
function drawRadarMap(radarLayers, polygonPerStep, radarMapTotalSides, radarX, radarY, ctx) {
	let radius = polygonPerStep;

	for ( let j = 0; j < radarLayers; j++ ) {
		drawPolygon(radarMapTotalSides, radius, radarX, radarY, ctx);
		radius = radius + polygonPerStep;
	}
}
polygonPerStep的意思是每一个多边形之间相差多少距离,radarMapTotalSides的意思是雷达图的多边形是几边形:
let canvas = document.getElementById("radar-map");
let ctx = canvas.getContext("2d");
drawRadarMap(5, 40, 10, 300, 300, ctx);
到目前为止我们就利用绘制多边形的函数drawPolygon成功绘制了一个雷达图的雏形:
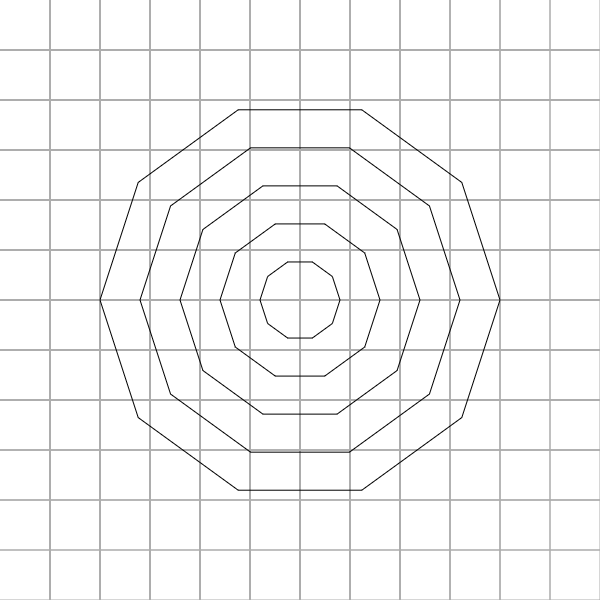
当前的雷达图还缺少了最外层每一个点的文本,以及连接雷达图中心到最外层点的直线。
连接雷达图里外层
连接雷达图里外层时,要在绘制多边形的时候保存每一层每一个点的坐标,也就是在drawPolygon函数中保存坐标信息。
保存点坐标
在drawRadarMap函数里面声明一个数组axis数组,它专门用于保存每层多边形的每个点坐标信息:
function drawRadarMap(radarLayers, polygonPerStep, radarMapTotalSides, radarX, radarY, ctx) {
	let axis = []; // 用于保存每一个多边形的每一个点坐标
	let radius = polygonPerStep;

	for ( let j = 0; j < radarLayers; j++ ) {
		drawPolygon(radarMapTotalSides, radius, radarX, radarY, axis, j, ctx);
		radius = radius + polygonPerStep;
	}
}
从顺时针开始的第一个点的坐标到最后一个点坐标,以及这些点坐标在第几层多边形上:
function drawPolygon(radarMapTotalSides, radius, radarX, radarY, axis, currentPolygonLayer, ctx) {
	let averageAngle = Math.PI * 2 / sides;
	let increaseAngle = 0;
	let targetX, targetY;

	ctx.beginPath();
	axis.push({ layer: currentPolygonLayer, coords: [] }); // 保存点坐标的数组,
	for ( let i = 0; i < radarMapTotalSides; i++ ) {
		targetX = calcPolygonX(radarX, radius, increaseAngle);
		targetY = calcPolygonY(radarY, radius, increaseAngle);
		ctx.lineTo(targetX, targetY);
		increaseAngle += averageAngle;
		axis[currentPolygonLayer].coords.push({ x: targetX, y: targetY }); // 添加点坐标到数组中
	}

	ctx.closePath();
	ctx.stroke();
}
drawPolygon函数新增了两个参数:axis 和 currentPolygonLayer。axis 就是保存没层多边形点的坐标数组;currentPolygonLayer 就是当前多边形在第几层多边形,比如第一层就是 0。
绘制直线函数
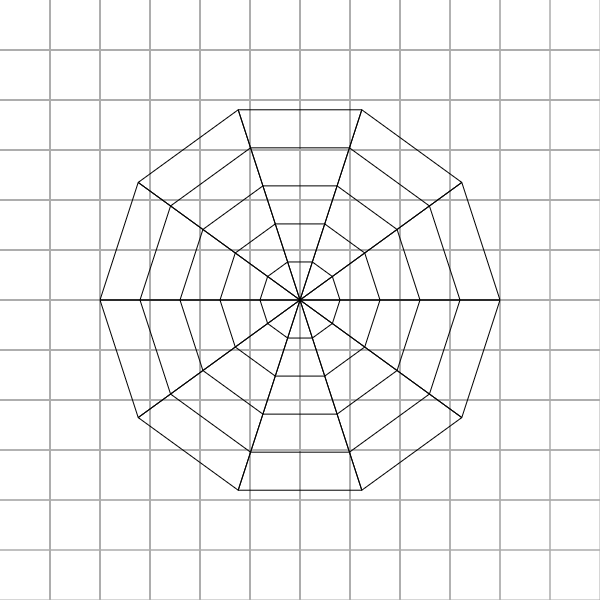
上面的工作是点坐标,目的就是连接雷达图中心点到最外层多边形的每一个点。所以,在这里我们新增一个函数,这个函数专门处理连接直线的函数drawStria:
function drawStria(radarLayers, axis, radarX, radarY, ctx) {
	let coords = axis[axis.length - 1].coords;
	for ( let i = 0; i < radarLayers; i++ ) {
		ctx.beginPath();
		ctx.moveTo(radarX, radarY);
		ctx.lineTo(coords[i].x, coords[i].y);
		ctx.closePath();
		ctx.stroke();
		drawPointText(data, coords, i, radarX, ctx);
	}
}
axis[length - 1].coords代表雷达图中最外层的多边形的所有点坐标。顺时针遍历其中元素,ctx.lineTo(coords[i].x, coords[i].y)从圆点开始依次连接最外层的多边形的点,从而构成一条条直线。
绘制雷达图外层文本
在雷达图最外层的多边形的每一个点添加文本,表示直线代表的是什么数据。
function drawPointText(data, axis, currentPoint, radarX, ctx) {
	ctx.font = `16px Georgia`;
	if ( axis[i].x <= radarX ) {
		ctx.textAlign = "right";
	} else {
		ctx.textAlign = "left";
	}
	ctx.fillText(data[currentPoint].title, axis[currentPoint].x, axis[currentPoint].y);
}
对于这个函数的几个参数讲解:
- data:顺时针开始最外层每一个点的文本;
- axios:最外层多边形每一个点的坐标信息;
- currentPoint:当前循环到的多边形的一个点坐标;
- radarX:雷达图中心坐标的 x 坐标轴。
在drawStria函数循环体内调用该函数完成最外层的文本渲染:

绘制数据区域
接下来就是雷达图最重要的部分了。雷达图中每一条直线上该文本所达到的值在此直线上进行移动,连接这些点构成一块区域,就是数据区域。
点击查看绘制数据区域的完整代码
function calcDataAreaTopX(areaTopLayer, axis, radarX, currentPoint) {
	if ( areaTopLayer < 0 ) {
		return radarX;
	} else {
		return axis[areaTopLayer].coords[currentPoint].x;
	}
}

function calcDataAreaTopY(areaTopLayer, axis, radarY, currentPoint) {
	if ( areaTopLayer < 0 ) {
		return radarY;
	} else {
		return axis[areaTopLayer].coords[currentPoint].y;
	}
}

function drawDataAreaTop(axis, currentPoint, radarX, radarY, ctx) {
	let x = calcDataAreaTopX(data[currentPoint].star - 1, axis, radarX, currentPoint);
	let y = calcDataAreaTopY(data[currentPoint].star - 1, axis, radarY, currentPoint);
	if ( i === 0 ) {
		ctx.moveTo(x, y);
	} else {
		ctx.lineTo(x, y);
	}
	return { x: x, y: y };
}

function drawDataArea(radarMapTotalSides, radius, axis, radarX, radarY, data, ctx) {
	ctx.beginPath();
	for ( let i = 0; i < radarMapTotalSides; i++ ) {
		drawDataAreaTop(axis, i, radarX, radarY, ctx);
	}
	ctx.closePath();
	ctx.strokeStyle = "rgba(68,226,155, 1)";
	ctx.stroke();
	ctx.fillStyle = "rgba(81,182,137, 0.6)";
	ctx.fill();
}
需要为数据函数提供一个data,这个是数据区域的信息,最外层多边形每一个点对应的值:
点击查看数据区域的数据
let data = [
    {
      title: "js",
      star: 4
    },
    {
      title: "ts",
      star: 2
    },
    {
      title: "html",
      star: 4
    },
    {
      title: "css",
      star: 4
    },
    {
      title: "vue",
      star: 4
    },
    {
      title: "uniapp",
      star: 4
    },
    {
      title: "java",
      star: 2
    },
    {
      title: "flutter",
      star: 3
    },
    {
      title: "dart",
      star: 4
    },
    {
      title: "python",
      star: 0
    }
];
以上就是绘制数据区域的函数的完整代码。drawDataAreaTop是圈画数据区域的函数,而drawDataArea完成最后的颜色填充工作。drawDataAreaTop接收以下几个参数:
- axis:顺时针开始最外层每一个点的文本;
- currentPoint:当前循环到的多边形的一个点坐标;
- radarX:雷达图中心坐标的 x 坐标轴;
- radarY:雷达图中心坐标的 y 坐标轴。
这里需要特别说明data[currentPoint].star - 1,因为 star 是从 0 开始,最大值为 5,必须要减 1,不然数组索引值越界。
调用雷达图函数
在绘制雷达图的函数下面添加drawStria和drawDataArea两个函数,完整一个完整的雷达图绘制
function drawRadarMap(radarLayers, polygonPerStep, radarMapTotalSides, radarX, radarY, ctx) {
	// ...
	// ...

	drawStria(radarMapTotalSides, axis, radarX, radarY, ctx);
	drawDataArea(radarMapTotalSides, axis, radarX, radarY, data, ctx);
}

drawRadarMap(5, 40, 10, 300, 300, ctx);
雷达图浮动面板
这一节是扩展雷达图的功能,当鼠标浮在数据区域节点之上时,就出现一个浮动面板,展示具体的数据信息。浮动面板和雷达图被包裹在一个 div 标签里,并设置为相对定位,浮动面板设置为绝对定位。
<div id="radar-wrap">
	<canvas id="radar-map" width="400" height="400">Your browser version is too late.</canvas>
	<div id="floating-panel"></div>
</div>
点击查看 CSS 代码
#radar-map {
    cursor: pointer;
    position: absolute;
    border: 1px solid rgba(110, 110, 110, 0.8);
    border-radius: 10px;
}

#radar-wrap {
    width: 400px;
    height: 400px;
    box-sizing: border-box;
    position: relative;
}

#floating-panel {
    position: absolute;
    display: none;
    border-style: solid;
    white-space: nowrap;
    z-index: 9999999;
    transition: left 0.4s cubic-bezier(0.23, 1, 0.32, 1) 0s, top 0.4s cubic-bezier(0.23, 1, 0.32, 1) 0s;
    background-color: rgba(50, 50, 50, 0.7);
    border-width: 0;
    border-color: rgb(51, 51, 51);
    border-radius: 4px;
    color: rgb(255, 255, 255);
    font: 14px / 21px "Microsoft YaHei";
    padding: 5px;
    left: 29px;
    top: 145px;
    pointer-events: none;
}
接下来就是最重要的 JS 代码,这里为了方便控制样式,我就用 JQuery 来实现。这里需要改造一下drawDataArea函数,我们要保存数据区域每一个点的坐标。
点击查看 JQuery 代码
drawFloatingPanel(axis) {
	let floatingPanel = $("#floating-panel");
	let timeout = null;
	$("#radar-map").on({
		mousemove: function (e) {
			if ( timeout != null ) clearTimeout(timeout);
			timeout = setTimeout(() => {
				axis.forEach((value, index) => {
					if ( (value.x >= e.offsetX - 5 && value.x < e.offsetX + 5) && (value.y >= e.offsetY - 5 && value.y < e.offsetY + 5) ) {
						$(floatingPanel).css({
							"display": "block", "left": `${ e.offsetX }px`, "top": `${ e.offsetY }px`
						});
						$(floatingPanel).empty().append(`
							<div class="tech">技术:${ value.title }</div>
							<div class="star">掌握程度:${ value.star } 颗星</div>
						`);
					}
				});
			}, 50);
		},
		mouseleave: function (e) {
			$(floatingPanel).css({ "display": "none" });
		}
	});
};
Recommend
About Joyk
Aggregate valuable and interesting links.
Joyk means Joy of geeK