
26

PyQt5系列教程(二十一)动态添加和移除布局中的控件.md
source link: https://xugaoxiang.com/2022/03/19/pyqt5-21-dynamic-add-remove-widget/
Go to the source link to view the article. You can view the picture content, updated content and better typesetting reading experience. If the link is broken, please click the button below to view the snapshot at that time.

软硬件环境
- Windows 10 64bit
- Anaconda3 with python 3.7
- PyQt5
使用 Qt Designer 来设计界面,左侧是2个按钮,右侧是一个垂直布局 VerticalLayout,然后再使用一个水平布局,效果如下图
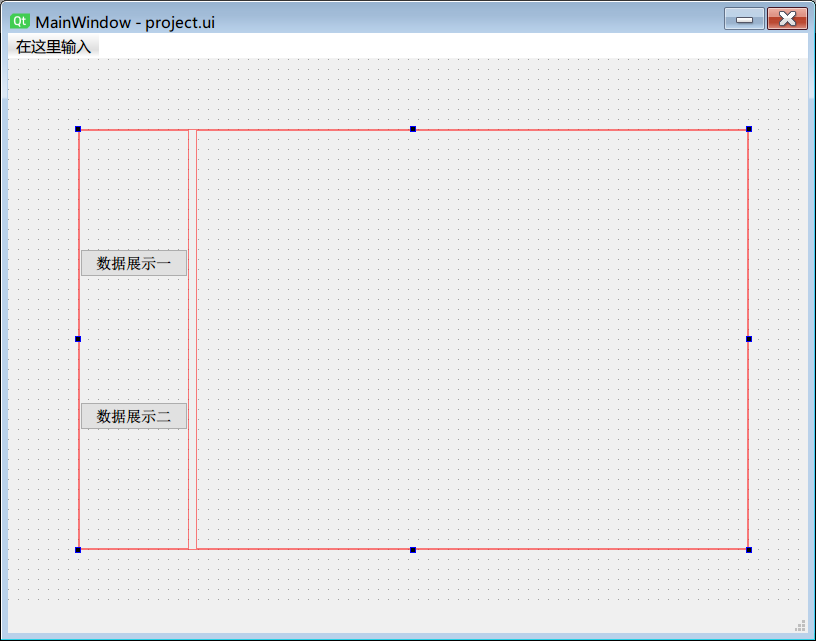
生成了 ui 文件,接着就可以进行代码转换了
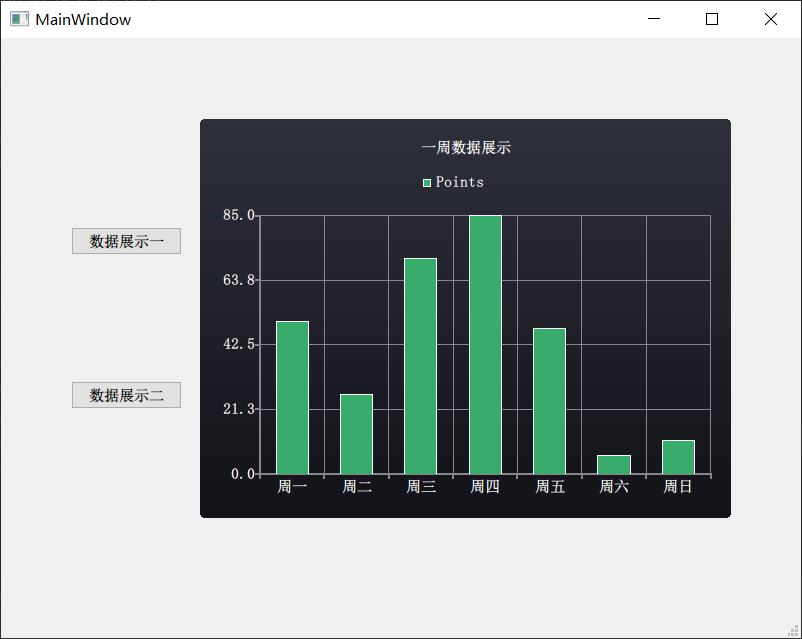
pyuic5.bat -o ui.py project.ui最后去写界面的业务逻辑,这里以上节中介绍过的画柱状图为例,2个按钮点击对应的槽函数,都是去展示柱状图,这部分代码是一样的。在第一次展示时,就需要将 QChartView 添加到布局 VerticalLayout 中,第二次点击时,就需要将原来绑定的控件先删除,然后再添加。
import sys
import random

from PyQt5.QtWidgets import QMainWindow
from PyQt5.QtWidgets import QApplication
from PyQt5.QtChart import QChart, QChartView, QBarSet, QBarSeries, QBarCategoryAxis

from ui import Ui_MainWindow

class MainWindow(QMainWindow, Ui_MainWindow):

    def __init__(self, parent=None):
        super(MainWindow, self).__init__(parent)
        self.setupUi(self)

        self.pushButton_1.clicked.connect(self.show_1)
        self.pushButton_2.clicked.connect(self.show_2)

    def show_1(self):
        set = QBarSet("Points")

        for i in range(7):
            # 随机7个样本数据
            set.append(random.randint(0, 100))

        # 若显示各部分所占百分比,用QPercentBarSeries
        series = QBarSeries()
        series.append(set)

        chart = QChart()
        chart.addSeries(series)
        chart.setTitle("一周数据展示")
        chart.setAnimationOptions(QChart.SeriesAnimations)
        chart.setTheme(QChart.ChartThemeDark)

        # 横轴数据
        categories = ["周一", "周二", "周三", "周四", "周五", "周六", "周日"]

        axis = QBarCategoryAxis()
        axis.append(categories)
        chart.createDefaultAxes()
        chart.setAxisX(axis, series)

        # 实例化chartview
        chartview = QChartView(chart)
        for i in range(self.verticalLayout.count()):
            self.verticalLayout.itemAt(i).widget().deleteLater()
        self.verticalLayout.addWidget(chartview)

    def show_2(self):
        set = QBarSet("Points")

        for i in range(7):
            # 随机7个样本数据
            set.append(random.randint(0, 100))

        # 若显示各部分所占百分比,用QPercentBarSeries
        series = QBarSeries()
        series.append(set)

        chart = QChart()
        chart.addSeries(series)
        chart.setTitle("一周数据展示")
        chart.setAnimationOptions(QChart.SeriesAnimations)
        chart.setTheme(QChart.ChartThemeDark)

        # 横轴数据
        categories = ["周一", "周二", "周三", "周四", "周五", "周六", "周日"]

        axis = QBarCategoryAxis()
        axis.append(categories)
        chart.createDefaultAxes()
        chart.setAxisX(axis, series)

        # 实例化chartview
        chartview = QChartView(chart)
        for i in range(self.verticalLayout.count()):
            self.verticalLayout.itemAt(i).widget().deleteLater()
        self.verticalLayout.addWidget(chartview)

if __name__ == '__main__':
    app = QApplication(sys.argv)
    windows = MainWindow()
    windows.show()
    sys.exit(app.exec_())
https://github.com/xugaoxiang/learningPyQt5
PyQt5系列教程
更多PyQt5教程,请移步
Recommend
About Joyk
Aggregate valuable and interesting links.
Joyk means Joy of geeK