

Is it possible to reinvent the spreadsheet app?
source link: https://uxdesign.cc/is-it-possible-to-reinvent-the-spreadsheet-app-c6208873c0a1
Go to the source link to view the article. You can view the picture content, updated content and better typesetting reading experience. If the link is broken, please click the button below to view the snapshot at that time.
Is it possible to reinvent the spreadsheet app?
This design is now over 40 years old.
Have you ever wondered why every spreadsheet app has to be green? Microsoft Excel, Google Spreadsheets, Apple’s Numbers.
Maybe because it’s a color of money spreadsheets are often used to count?
Or maybe because of this app, VisiCalc. It was created in 1981 and ran on Apple II. It was the first popular spreadsheet app and the killer app on this platform. And Apple II’s screen was all black and green.
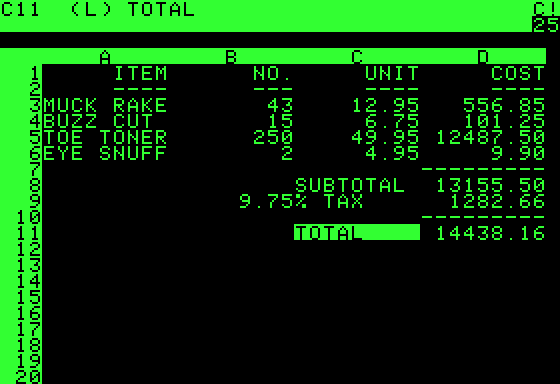
The design of the spreadsheet apps hasn’t changed for more than 40 years. The fundamental interaction concept is exactly the same as in VisiCalc. It is one of the most powerful, successful and most enduring designs ever. As for digital design, this is insane.
On the other hand, if you’re not a pro and you only use spreadsheets from time to time, they are rather difficult to use…
With power comes great complexity
You need to recognise the commands, formulas are hidden, there are thousands of features, options, menus, formats, etc. And, of course, you need at least some understanding of math, statistics and logic.
Every time I want to pin the top row of the sheet in Google Spreadsheets I need to google how to do it. Somehow I always forget. I mostly do very simple stuff, like estimations and budgeting, but when I want to do something more complex, I need to read Help. And Help sucks. Always.
Is it possible to reinvent the spreadsheet?
Or maybe, at least, augment it with some artificial intelligence to make things easier for people who aren’t exactly Excel ninjas?

I tried to design such an app and spent exactly one day on this exercise. And of course it had to be green.
Is it perfect? Not at all. I’m sure I didn’t think about a lot of stuff and use-cases. (Like creating charts for example.)
Is it better than today’s spreadsheets apps? Maybe, a little. You can decide. For me is still too close to them.
A lot of designers probably think that spreadsheets are the most boring apps in the world ever. But it was very difficult thing to try to improve this design.
Welcome to ML Excel
It’s a simple spreadsheet web application. The name is a pun on MS Excel, Machine Learning and my initials.
On the top of the screen we have 4 tabs: Sort, Filter, Formulas and Ominbox.
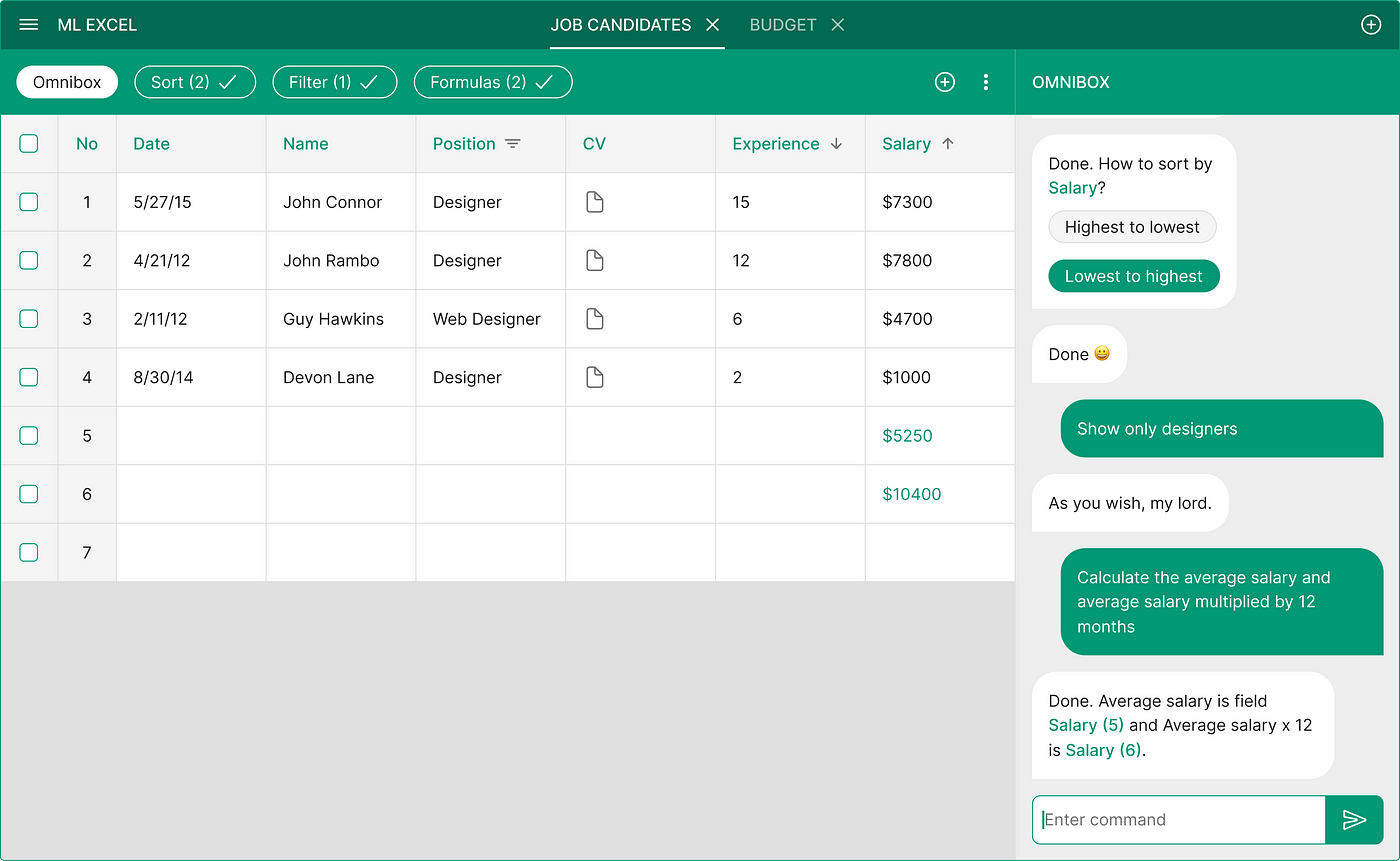
Let’s start with the Omnibox. It is a bot that uses NLP and understands natural language. It can be asked to perform various tasks: sorting, filtering, adding formulas, etc.
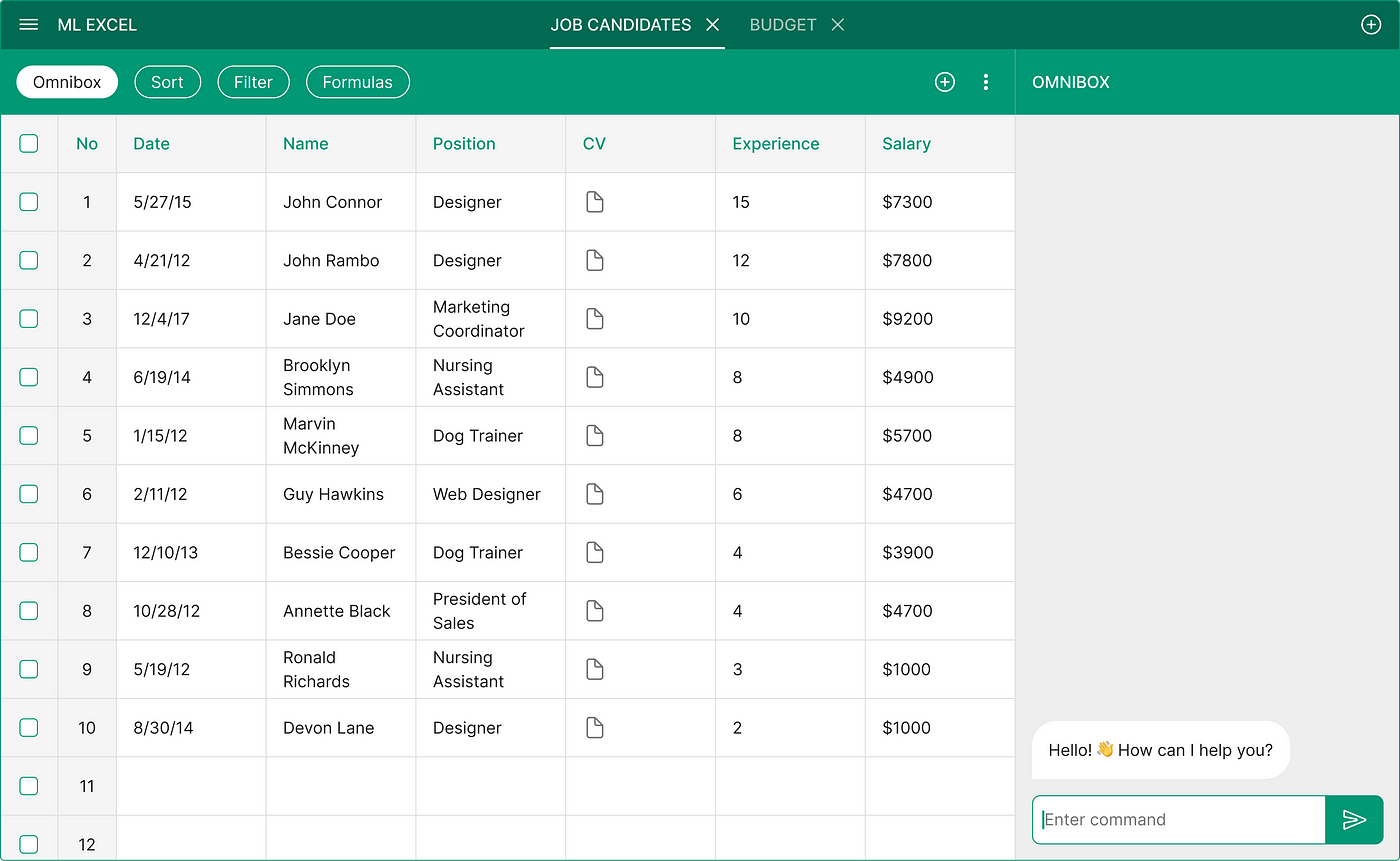
Here we have a spreadsheet with a list of job applicants from the recruitment form on your company’s website.
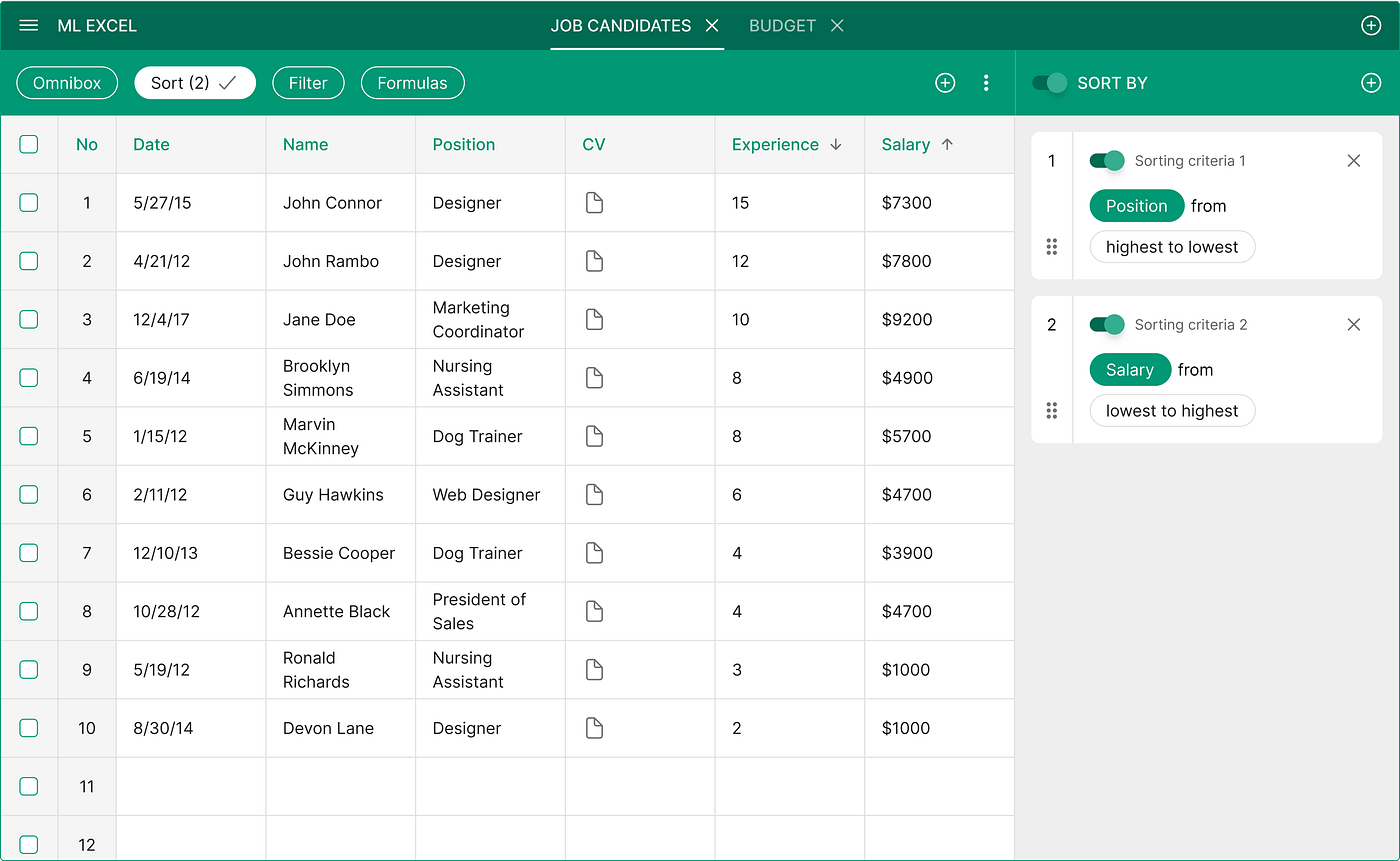
You can ask the bot to sort the candidates by years of experience and expected salary.
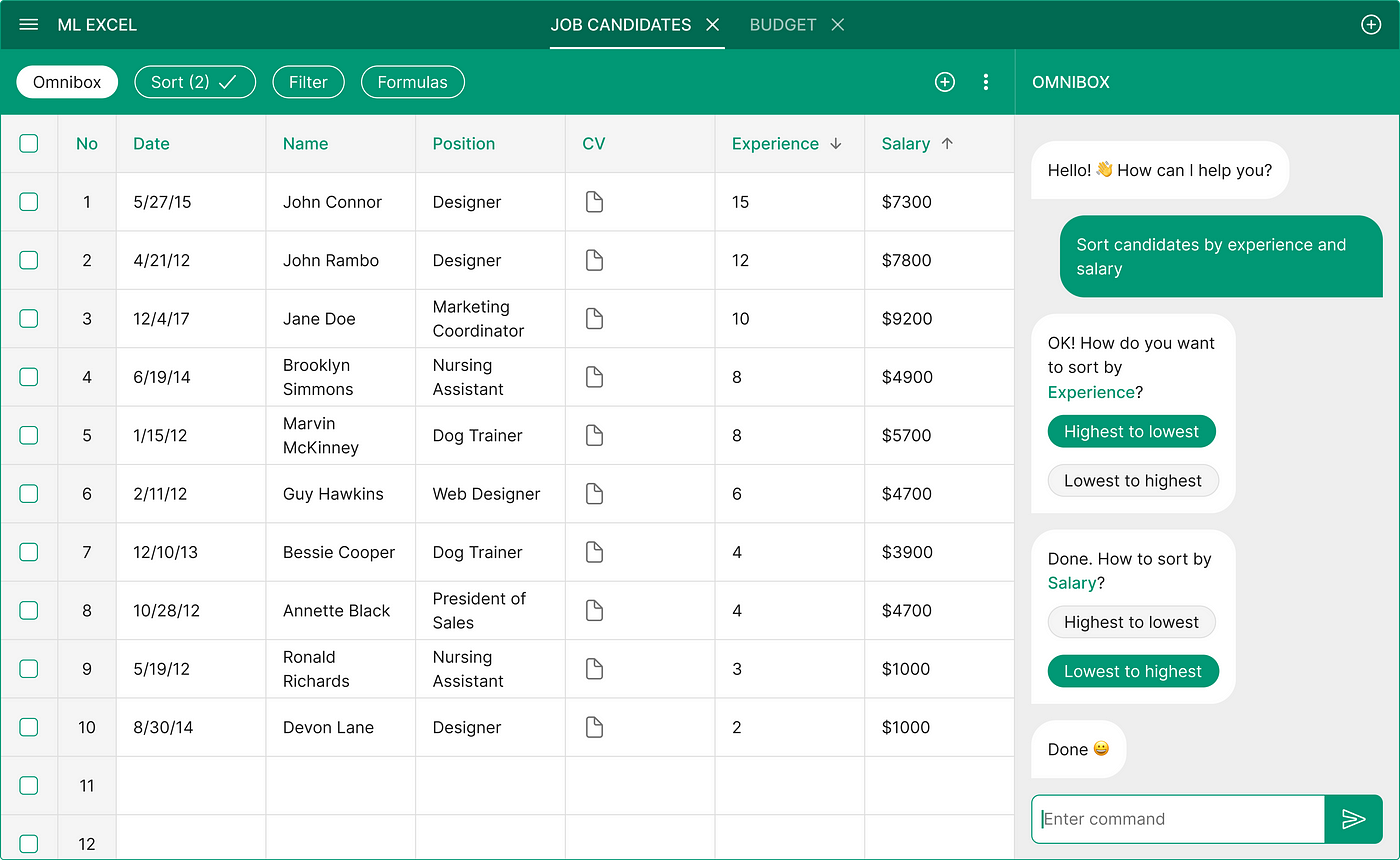
In the background the bot creates two sorting criteria in the Sort tab.
In this tab you can adjust the sorting criteria, change their order, temporary turn them off, delete them or add new criteria.
I’ll show you the manual editing when we get to the formulas.
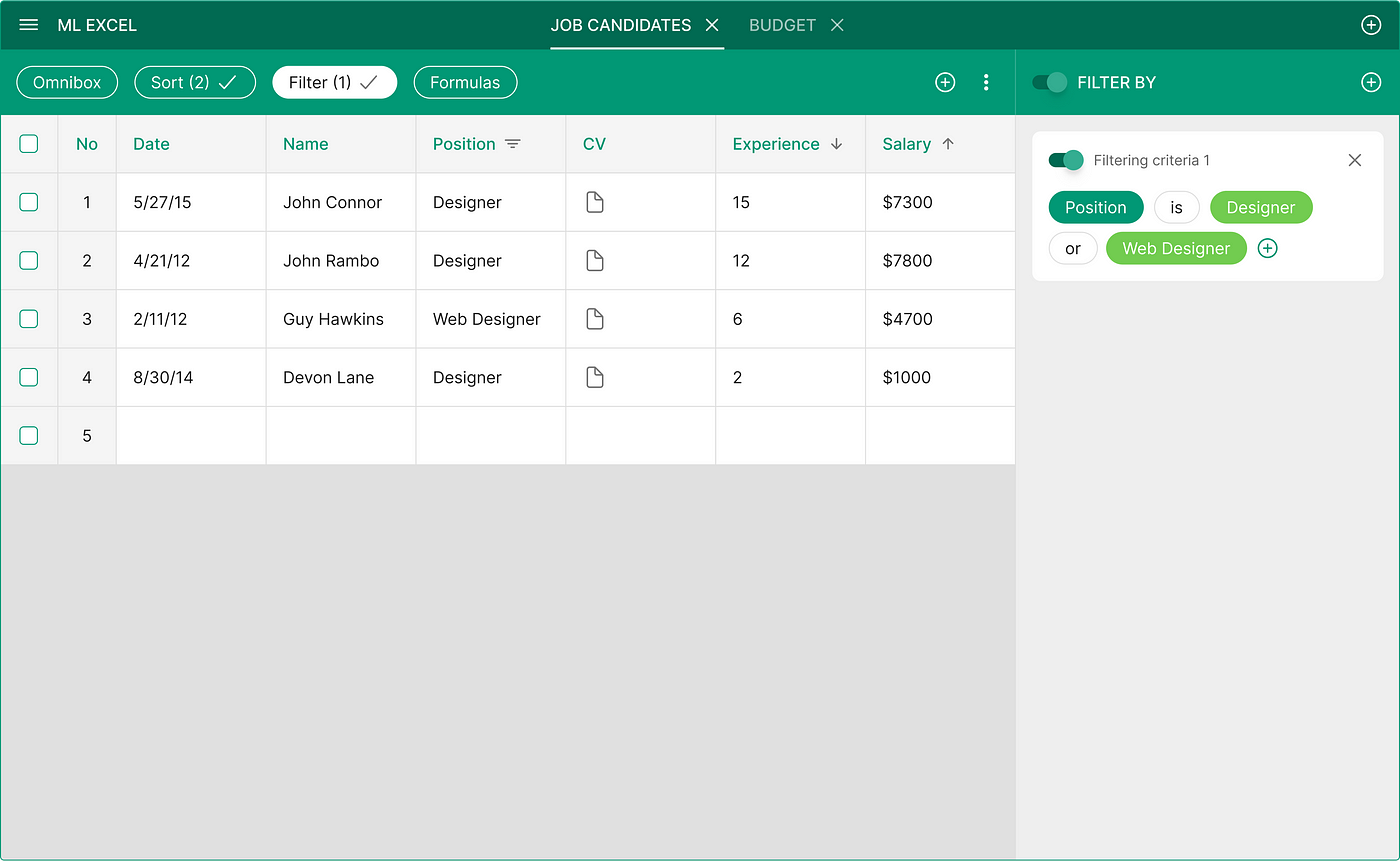
In the Filter tab you can manage and add filtering criteria.
For example you can filter the sheet to show only designers.
You can use logic operators and/or/not.
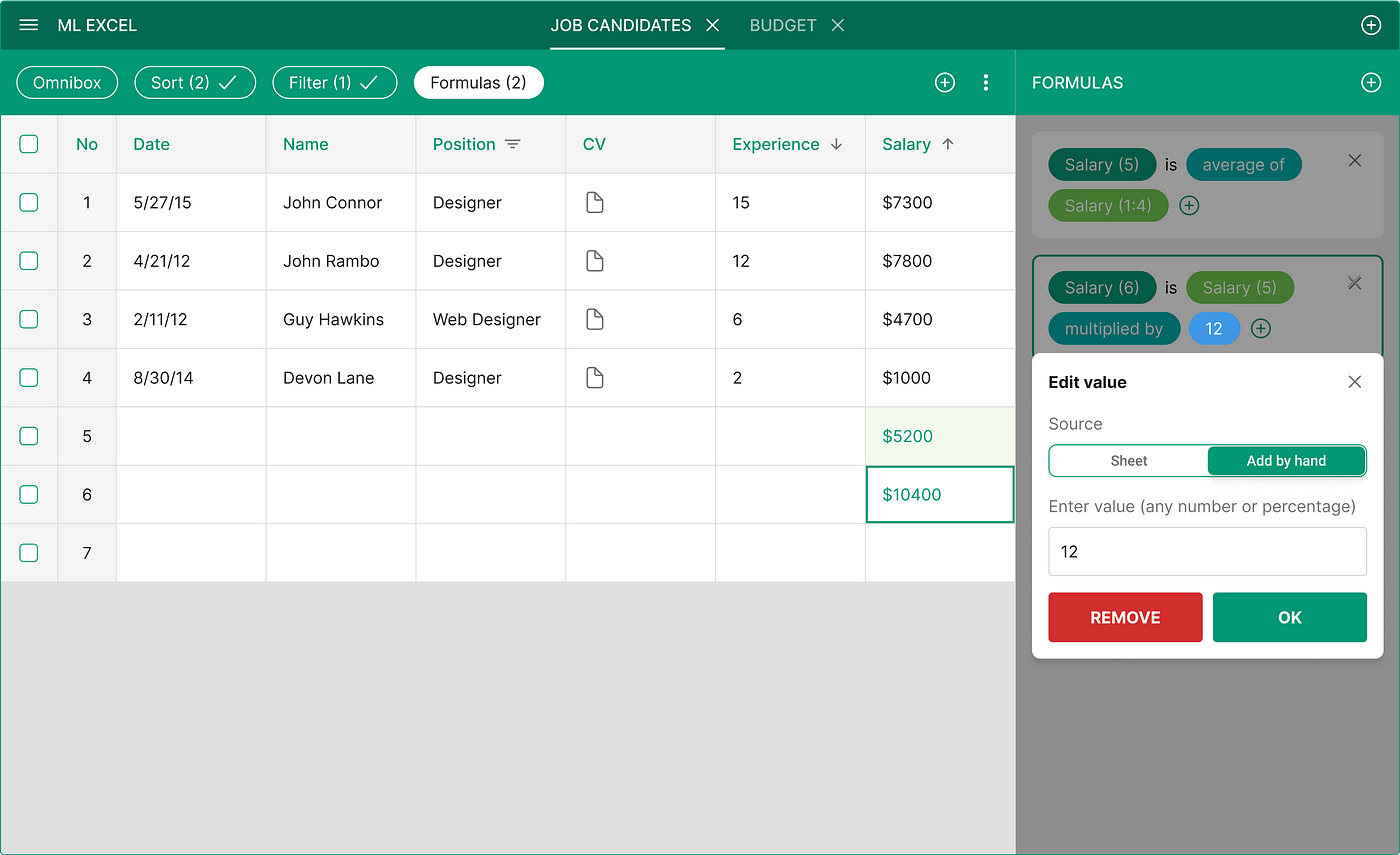
Now let’s add a simple formula manually.
Click on a field to open the Formulas panel.
If there is no formula yet, only the name of the selected field will be displayed.
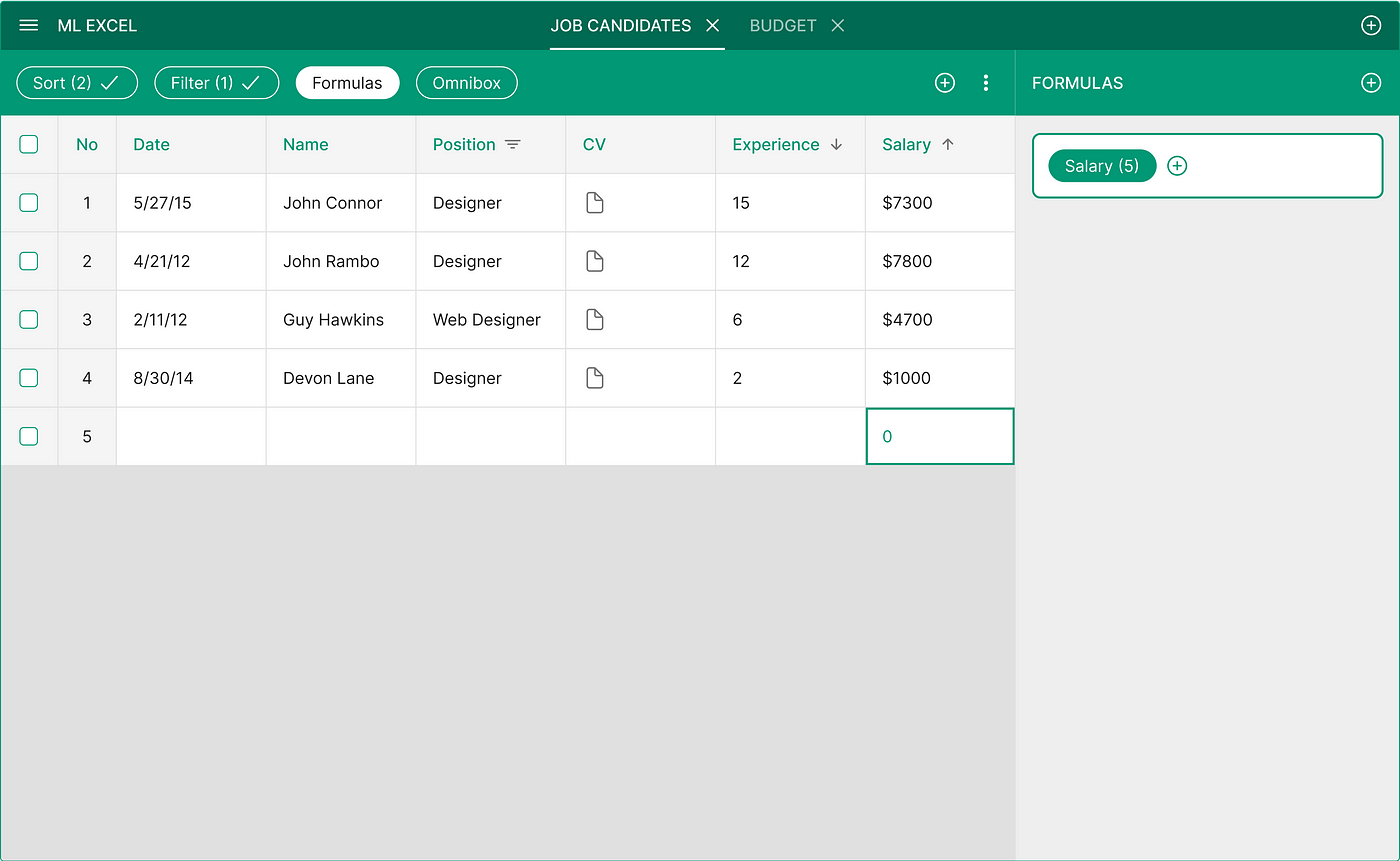
Click on a plus icon to add something!
As a second element of your formula you can choose calculation or another value.
Let’s say you want to see the average of the expected salary of a designer.
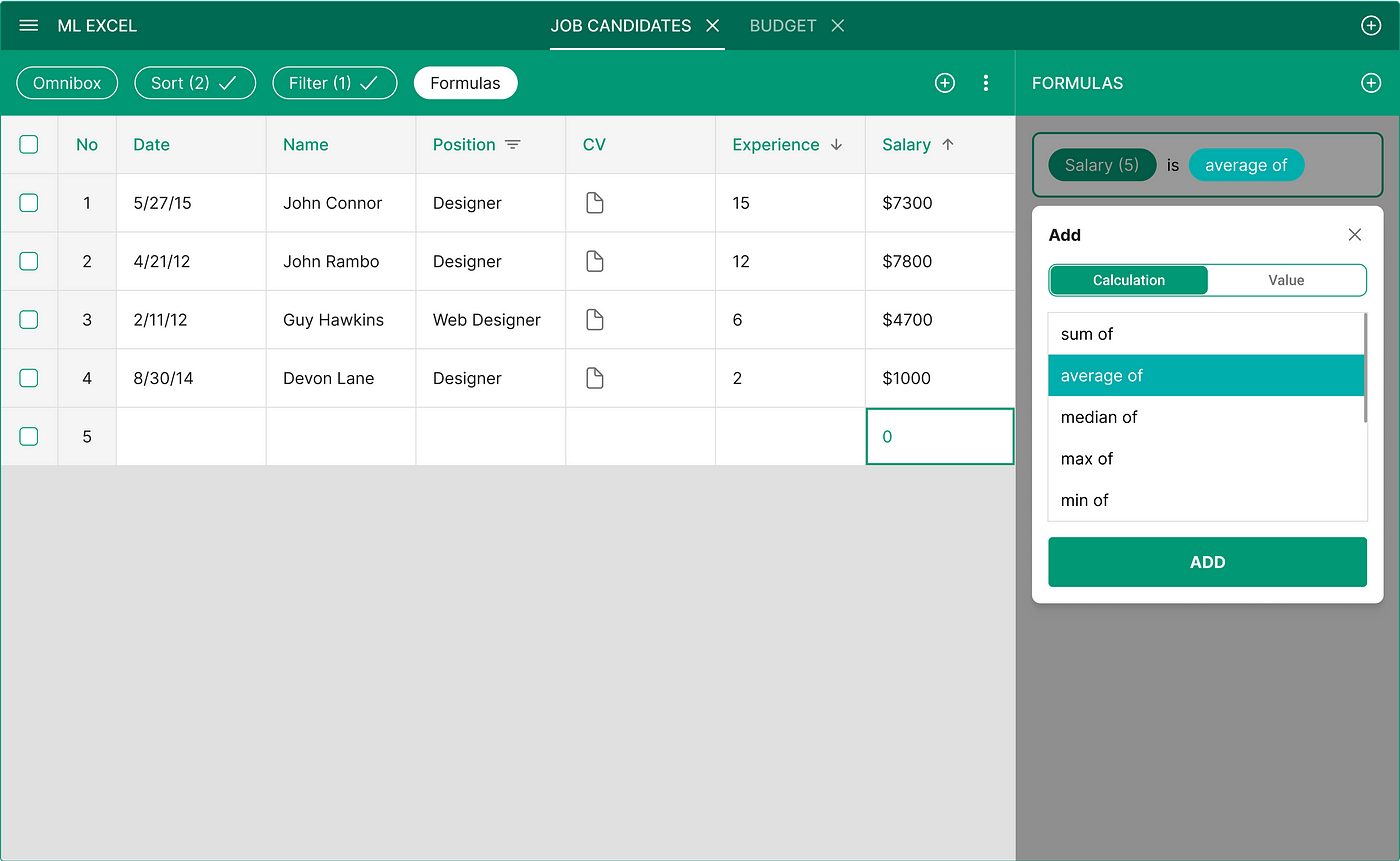
The system can predict that you probably want to see the average of the whole Salary column, so it will also automatically add this as a source value.
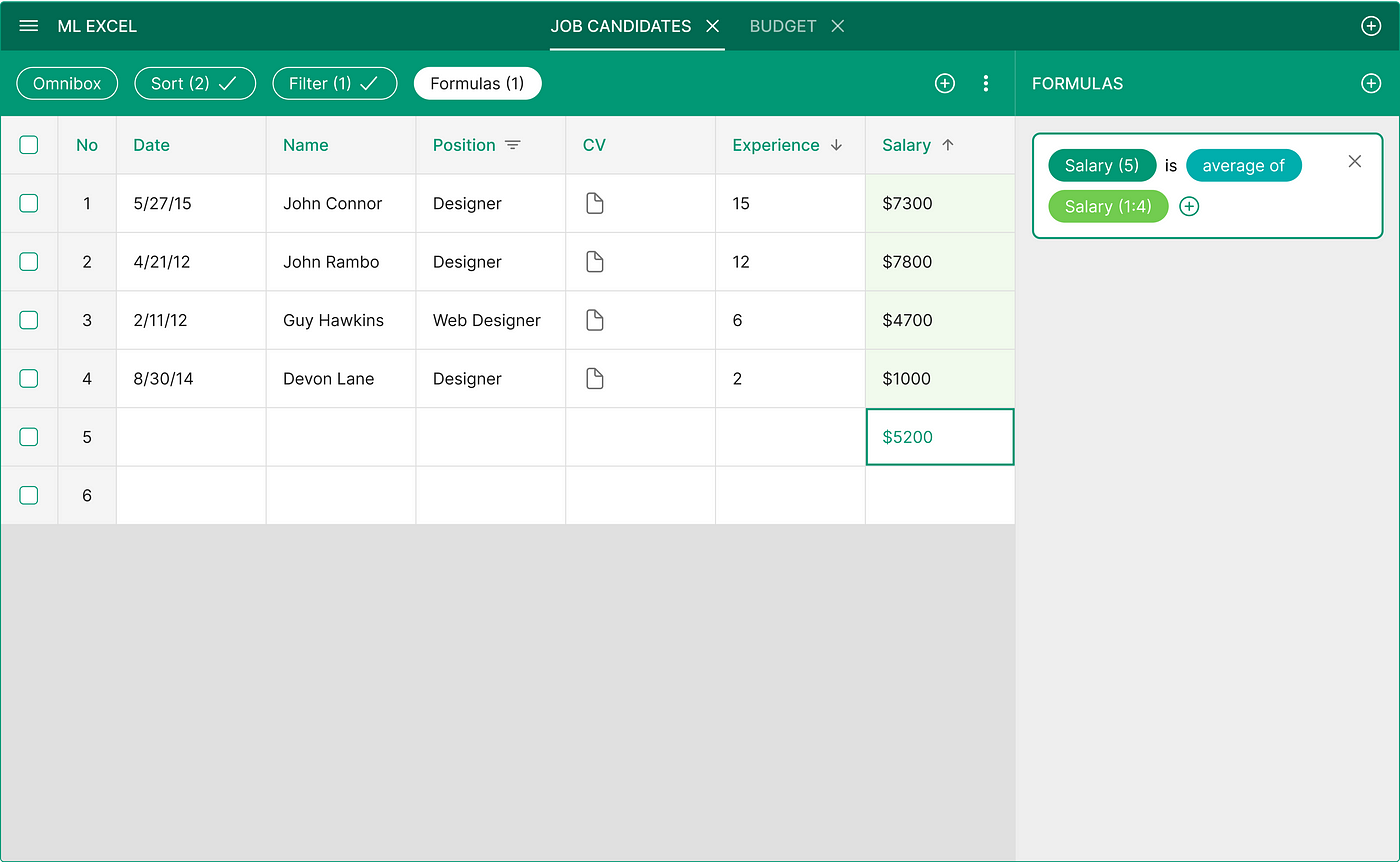
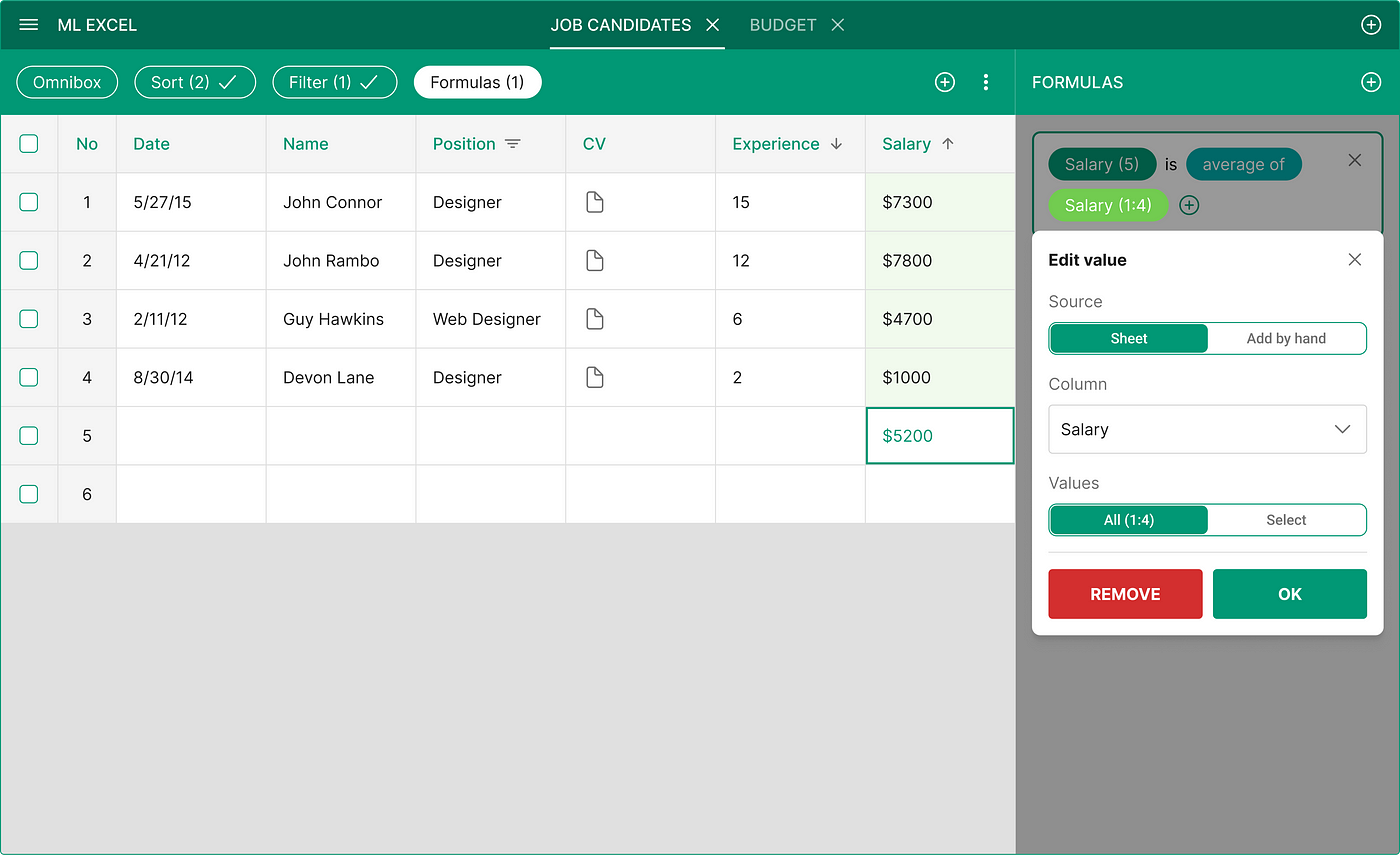
You can inspect or change the source range.
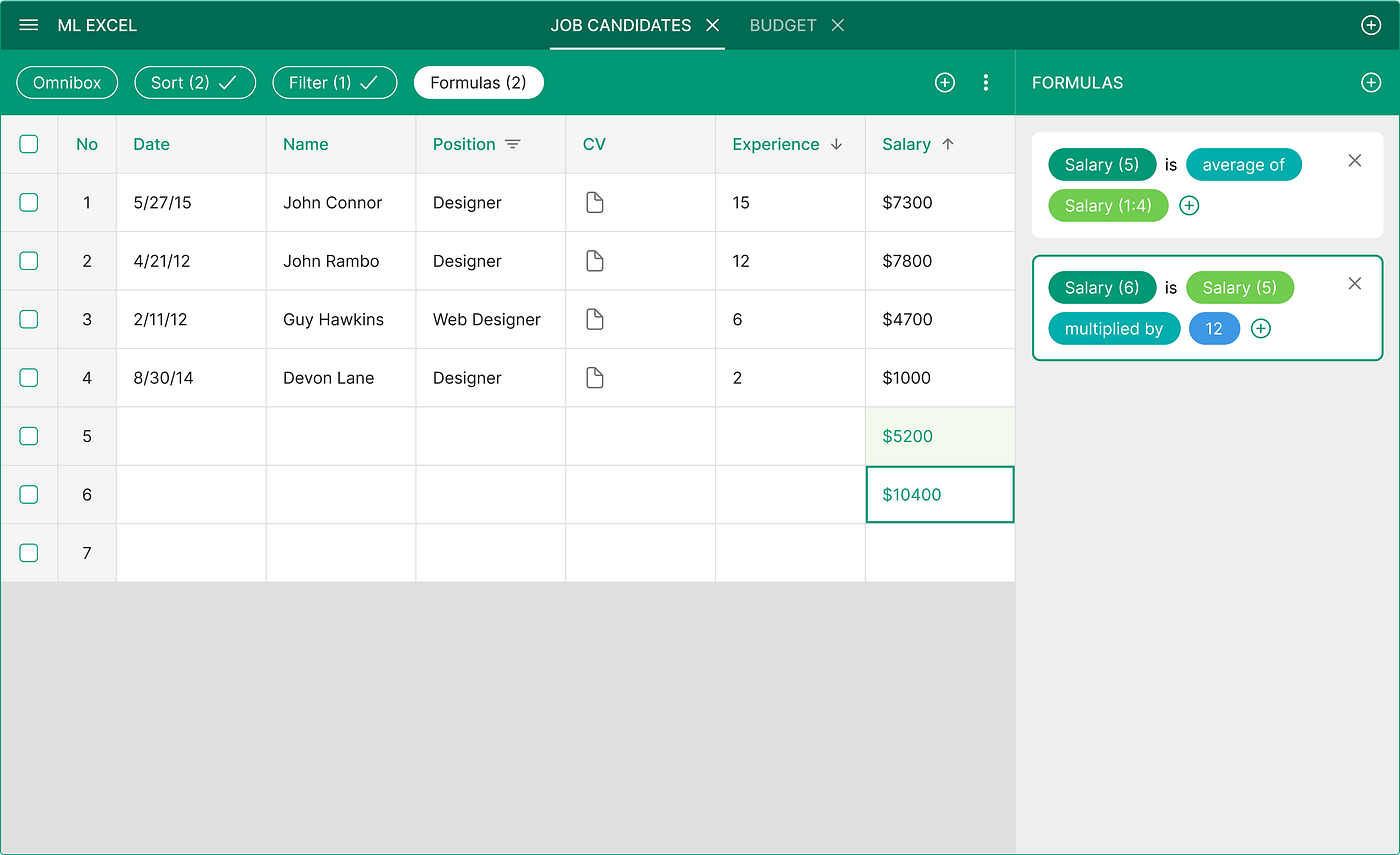
Here we have two formulas added in the Formulas panel: “average salary” and “average salary” x 12 (months).
Clicking on the formula will focus view one the corresponding field in the spreadsheet (and vice versa).
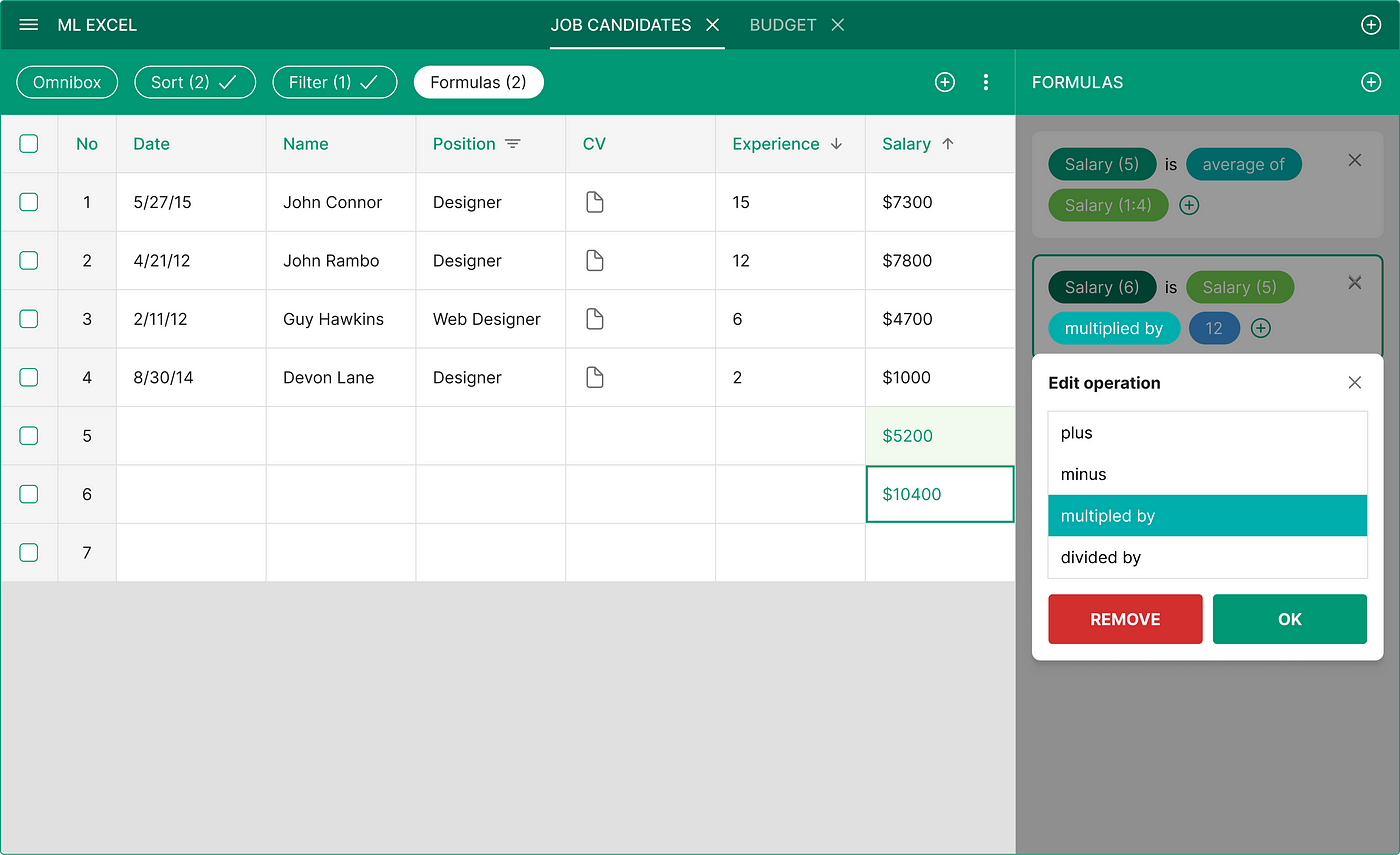
You can choose math operations.
You can also add values to the formula itself by hand.
Now let’s go back to the Omnibox.
Because instead of adding filters or formulas manually, you can always ask the bot to do this for you.
It’s so much faster and easier.
By the way, the size of the right panel is exactly the size of the mobile screen.

PS. If you want to see images in better quality check out my Behance page.
Recommend
About Joyk
Aggregate valuable and interesting links.
Joyk means Joy of geeK