

Learning analytics | Neural Designer
source link: https://www.neuraldesigner.com/blog/learning_analytics
Go to the source link to view the article. You can view the picture content, updated content and better typesetting reading experience. If the link is broken, please click the button below to view the snapshot at that time.

Learning analytics
5 applications of learning analytics
By Laura Álvarez, Artelnics. Mar 24, 2021

Every day a vast amount of data is generated by people and companies. This data generation has been growing exponentially in the last few years.
Many companies are integrating techniques that allow them to leverage the potential of this data by obtaining information from them.
We can apply these techniques in many fields. For example, when we talk about learning analytics, we refer to data analysis in the education field.
This post explains what learning analytics is and its most critical applications.
Contents:
What is learning analytics?
Learning analytics (LA) is a relatively new field of research that has been emerging in the sector of education.
It uses a set of tools to analyze the students' data. Thanks to this, it is possible to adapt each student's experience in their courses, providing more efficient and dynamic learning methods.
Learning analytics aims to predict and advise on learning, further supporting faculty in identifying student learning needs and improving pedagogical strategies.
The following graph shows how the learning analytics process works:
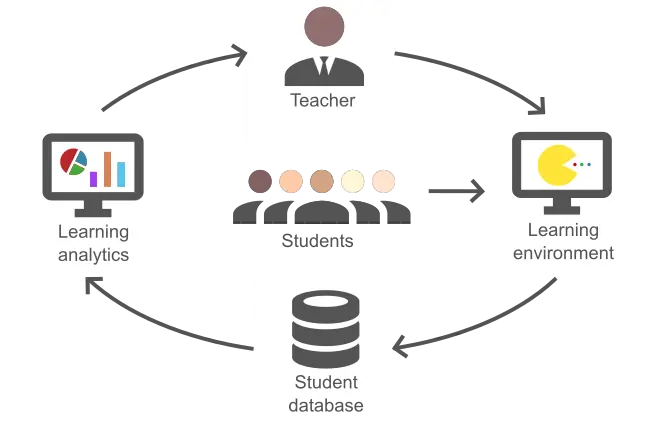
First, the teacher creates a learning environment, for example, a game or a quiz. Then the students perform this task, and all this data about each student (score, engagement, etc.) is stored in a database. Afterward, this data is analyzed to get information, identify influencing variables, predict scores, etc.
Thanks to this analysis, the teacher can modify the learning environment to be more efficient and adapted to the students' individual needs. Then the same process is repeated over and over.
There are many applications of learning analytics, all aimed at better adapting teaching methods to students. In the following sections, we explain the most important ones.
Student monitorization
Data visualization is the main application of learning analytics. It aims to help instructors visualize and analyze the ongoing activities of the students.
Once the data is stored, it is possible to create dashboards to easily visualized.
The next chart shows an example of a dashboard:
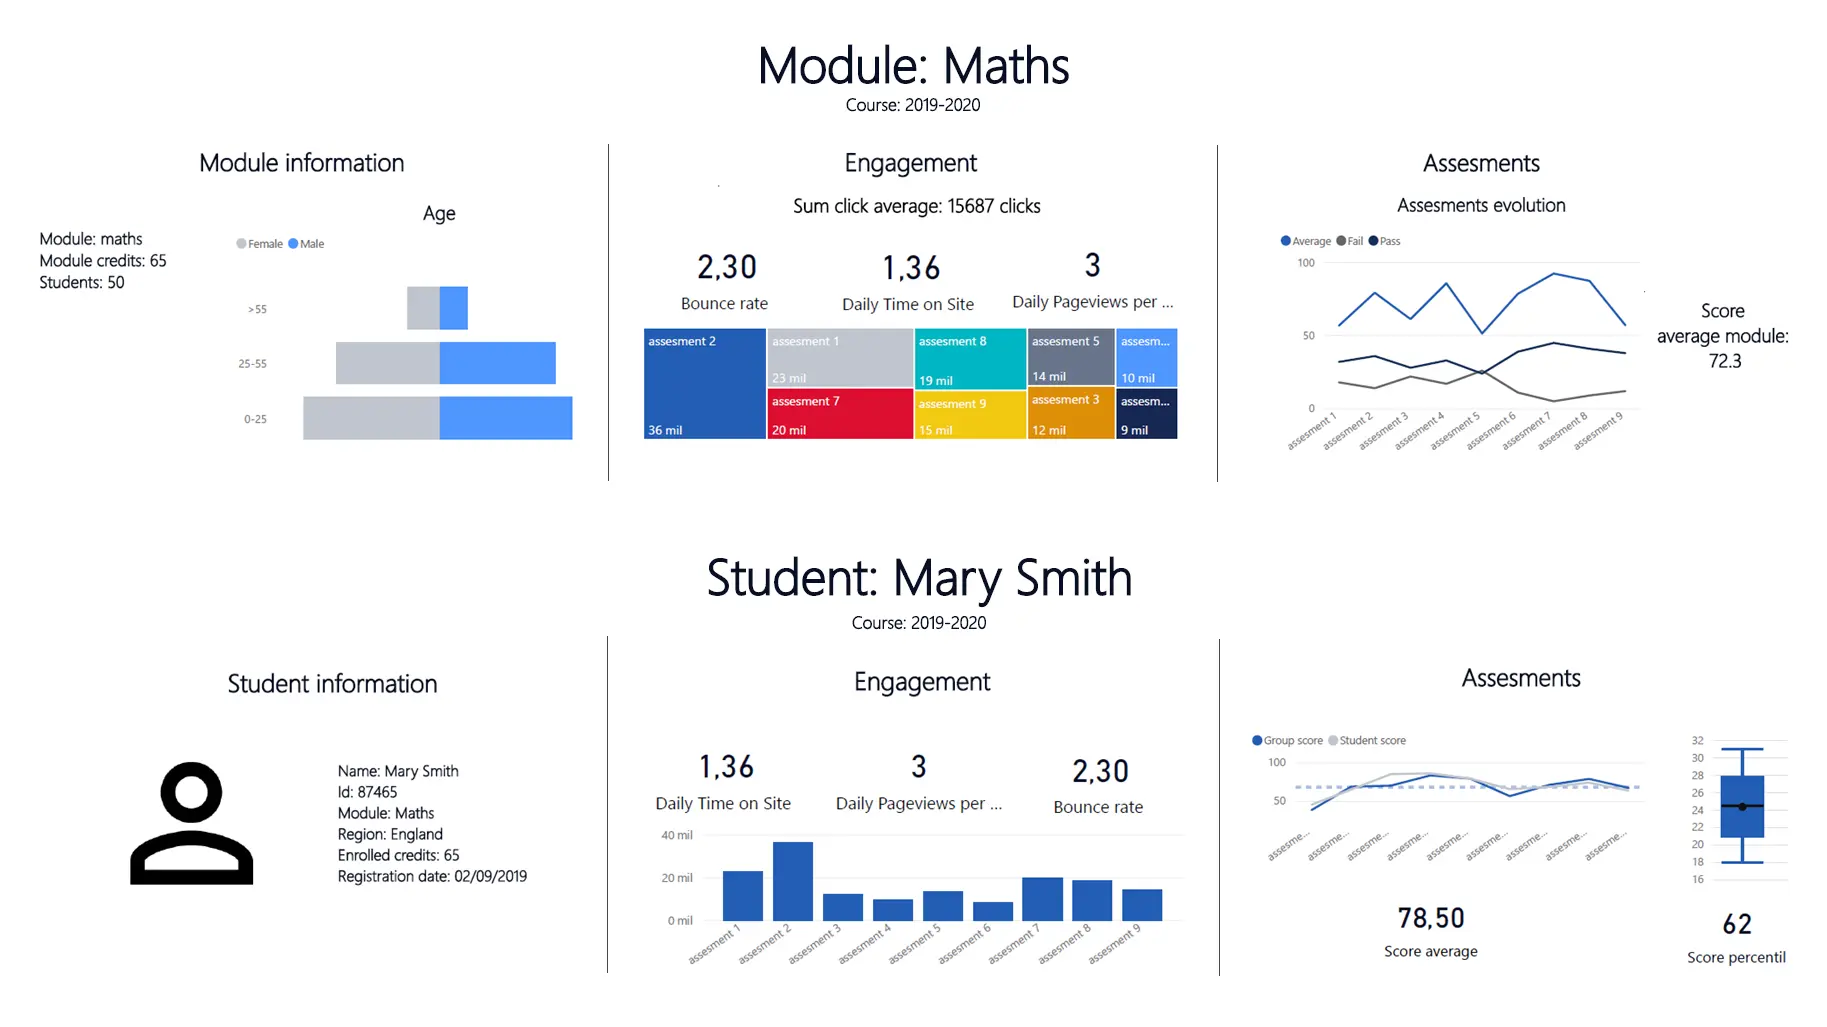
In this dashboard we can visualize information about a course (Maths) and about a student (Mary Smith).
The course visualization contains information about the Maths course. It includes credits and student numbers, score distribution according to gender, bounce rate, daily time on the site, distribution of the passes and fails in the different assessments, etc.
In the second part, we can visualize the data about a particular student, Mary Smith: some of her registration data, the engagement, and score charts.
There are many tools that can be used for student monitorization such as PowerBI or Tableau. These tools are used to find insights within a data and help create charts or graphs to provide visuals of the data.
Data visualization makes it easy to understand how your students engage with your content, so you know what is working and what is not and improve the methods.
Analysis of the factors influencing learning
Recognizing the most influencing factors is another key to improving the learning methods.
If the teacher or the learning organization recognizes which aspects are the most important, they can pay more attention.
To find these factors, we calculate the input-target correlations, which calculates the correlations of all the variables with the target variable, for instance, the score.
The following chart shows which factors most influence the variable final_score.
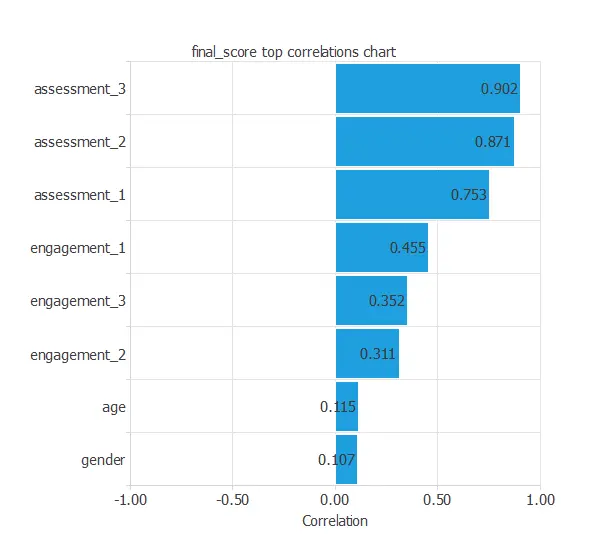
In this example the most influencing factors are the three assessments (assessment_3, assessment_2 and assessment_1) with a positive correlation, the better the assessment, the better the final grade.
The engagements (engagement_1, engagement_3 and engagement_2) also influence positively on the final score, but less than the assessments.
Finally, the variables sex and gender have almost no influence on the final grade.
Student outlier detection
Outlier detection is also essential, especially to detect these students with difficulties or irregular learning processes so that the teacher can adjust the learning methods to their needs.
In the following plot, we can observe the student score as a function of student engagement. The minimum score is 0, and the maximum is 10. The engagement is measured by the number of times a student interacts with the material that day.
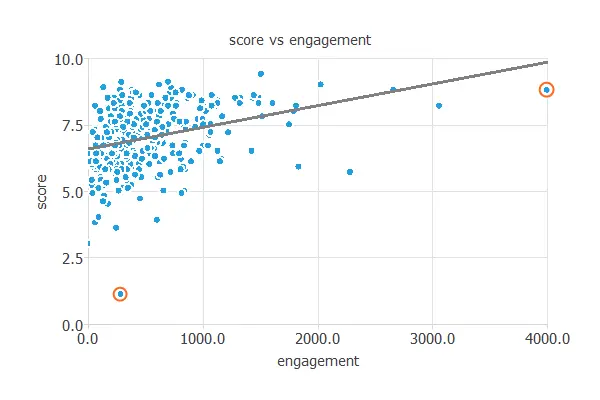
As we can see, there are two outliers selected with the orange circles.
Regarding the student on the top-right side, although he has a good score (around 9), he needs to study eight times more than most students who get that mark. This might indicate different things such as concentration problems or addiction to study, and the teacher should look at this student.
There is another one on the bottom-left side. This student studies the same amount of time as many of his classmates. However, he does not pass the exam and gets a bad score (around 1). Looking at the other students with the same engagement (around 300), we observe that most get to pass the exam. This could indicate that this student has learning difficulties, and the teacher should also study this case.
Overall, any case located far from the point massing should be reviewed as this person has a different learning process from the rest of the classmates and could indicate different learning problems.
Dropout and score prediction
Learning analytics is also used to predict scores and dropout probabilities.
It is possible to make predictions of a course: how many students will pass and how many will fail, which will be the churn rate, which will be the group average, etc. And it is also possible to make predictions of a specific student: his predicted score, the probability of dropout, etc.
The next chart shows an example about the predictions for the Maths course:
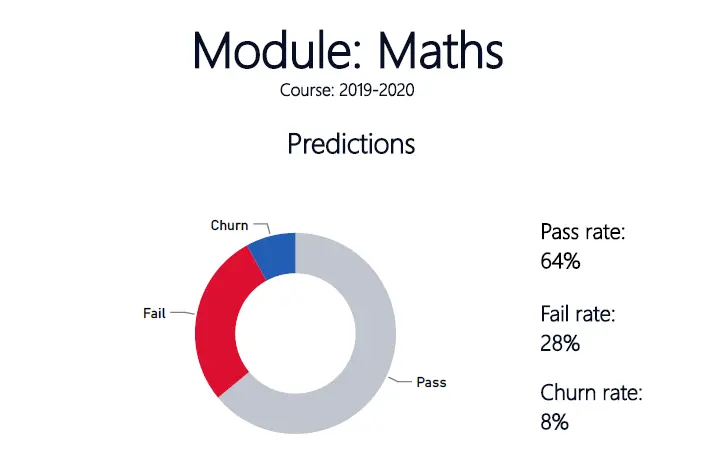
It is predicted that the Maths course will have a 64% pass rate, 28% fail rate and 8% churn rate.
The next chart shows the predictions for the student Mary Smith:
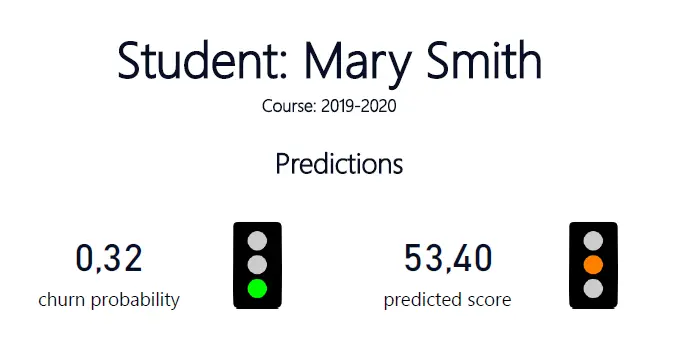
This student has a 32% probability of churn, and her predicted score is 53.40.
A common algorithm for this is neural networks.
Neural networks
Neural networks can be defined as a biologically inspired computational model that consists of a network architecture composed of layers of artificial neurons.
This structure contains a set of parameters, which can be adjusted to perform specific tasks. Some examples are to assess the risk of dropout or predict students' final scores.
The following graph illustrates an example of a neural network used to predict the final student scores:
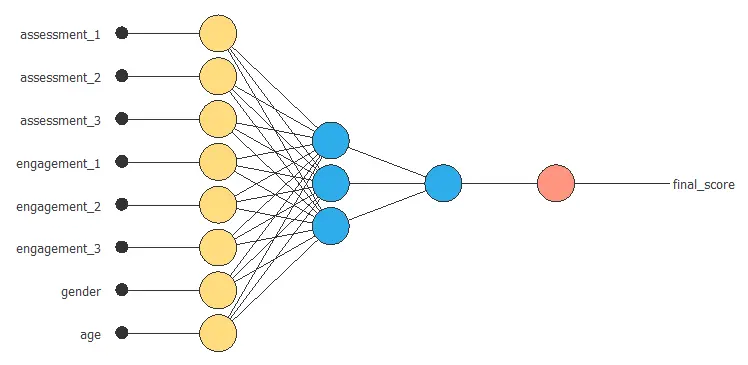
The input layer is shown in yellow, and it consists of 8 neurons, one for each variable.
There are two hidden layers (blue) in the example, the first one with three neurons and the second with only one neuron.
Finally, we can see the output layer in orange. Only one neuron corresponds to the output variable, the final score.
When we introduce the data for all the eight variables, the hidden layers of the neural network work to return a value for the output, the predicted final score.
Course recommendation
Recommendation to students is another of the learning analytics applications.
Different recommendation algorithms are based on different features, for instance, content-based, collaborative, or conversational recommendation approaches, etc. In the next chart are represented the content-based and collaborative filtering:
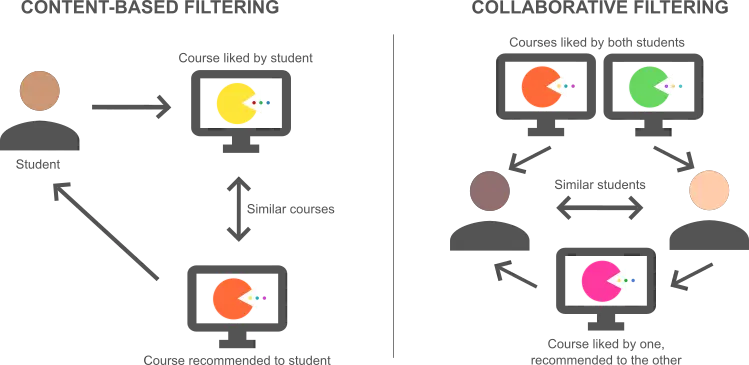
Content-based and conversational recommendation techniques allow students to interact with the course selection, while collaborative filtering uses the records of similar students to recommend courses to students.
These algorithms are used to match individual needs and interests. Finding the course that best suits these personal needs and interests help reduce the dropout probability and improve engagement.
All this information can also be helpful for the academic planning of courses and the further development of learning programs.
FLIP2G project
"Enhancing education and training through data-driven adaptable games in flipped classrooms (FLIP2G)" is a project framed in the Erasmus+ Programme of the European Union to support education, training, youth and sport in Europe.
This project is carried out by 7 European higher education institutions, schools, and private companies:
The Flip2G project aims to establish a Knowledge Alliance between higher education institutions, schools, and private companies to boost skills development and introduce novel, data-driven approaches to education and training.
The results will help establish a new pedagogical method that combines problem-based learning and flipped classrooms with game-based learning and produce informative insights into the learning process.
These techniques make it possible to elaborate engaging models that can foster motivation, generate custom learning pathways, and allow self-directed learning in education.


Conclusions
As seen in this post, learning analytics can improve students' learning experience.
Learning analytics can support teachers and educational organizations to provide personalized support to students and create new pedagogical models. It collects and processes educational data to visualize what has already happened, recognize the most influencing factors, detect students with difficulties or irregular learning processes, predict what might happen, and make course recommendations.
There are already organizations and projects such as Flip2G taking advantage of these techniques, and it is expected that many other educational organizations will also include them in the following years.
Related posts:
BUILD YOUR OWN
ARTIFICIAL INTELLIGENCE MODELS
BUY NOW >
Do you need help? Contact us | FAQ | Privacy | © 2022, Artificial Intelligence Techniques, Ltd.
</body
Recommend
About Joyk
Aggregate valuable and interesting links.
Joyk means Joy of geeK