
InfluxDB Terminal Dashboards with FluxDash
source link: http://vrecan.github.io/post/intro_fluxdash/
Go to the source link to view the article. You can view the picture content, updated content and better typesetting reading experience. If the link is broken, please click the button below to view the snapshot at that time.

InfluxDB Terminal Dashboards with FluxDash
28/Dec 2015
Overview
FluxDash is a dashboard terminal ui that is fully configurable through json files. You can either give it an indivudual json file or a folder and it will read any json file in the folder and attemp to turn it into a dashboard. You can then move between dashboard by pressing .
Features
- Sparklines
Sparklines are a simplified single stat linechart that gives you basic trending over time. Example json:
"sparklines": {
    "Height": 1,
    "lines": [{
        "from": "/system.cpu/",
        "title": "CPU",
        "where": "",
        "type": 2,

        "height": 1,
        "linecolor": 5,
        "titlecolor": 0
    }, {
        "from": "/system.mem.free/",
        "title": "System Free memory",
        "type": 3,
        "height": 1
    }, {
        "from": "/system.mem.cached/",
        "title": "System Cached memory",
        "type": 3,
        "height": 1
    }, {
        "from": "/system.mem.buffers/",
        "title": "System Buffers memory",
        "type": 3,
        "height": 1
    }]
}
- MultiSpark
A set of sparklines that have been expanded automatically based on a influxdb tag.
- Gauge
Gauge shows you the mean and max over the set time period.
- BarChart
BarChart is a graph that represents grouped data.
Json Definition
- Types:
    const(
    Short   = 1 #human readable numbers 100 1k 10m 1b
    Percent = 2 #Data should be treated as a percent
    Bytes   = 3 #human readable bytes 1b 30kb 1mb 10gb 1tb
    Time    = 4 #human readable time duration 1sec 5m 1h
)
- From: From is the measurement you are going to query in influxdb.
“/system.cpu.*/” example regex.
“system.cpu” example full measurement name.
- Where: Where allows you to add to the where clause in your influxdb query.
“service='name'“
“`service=‘name’ AND host=‘hostname’”
Example Dashboard
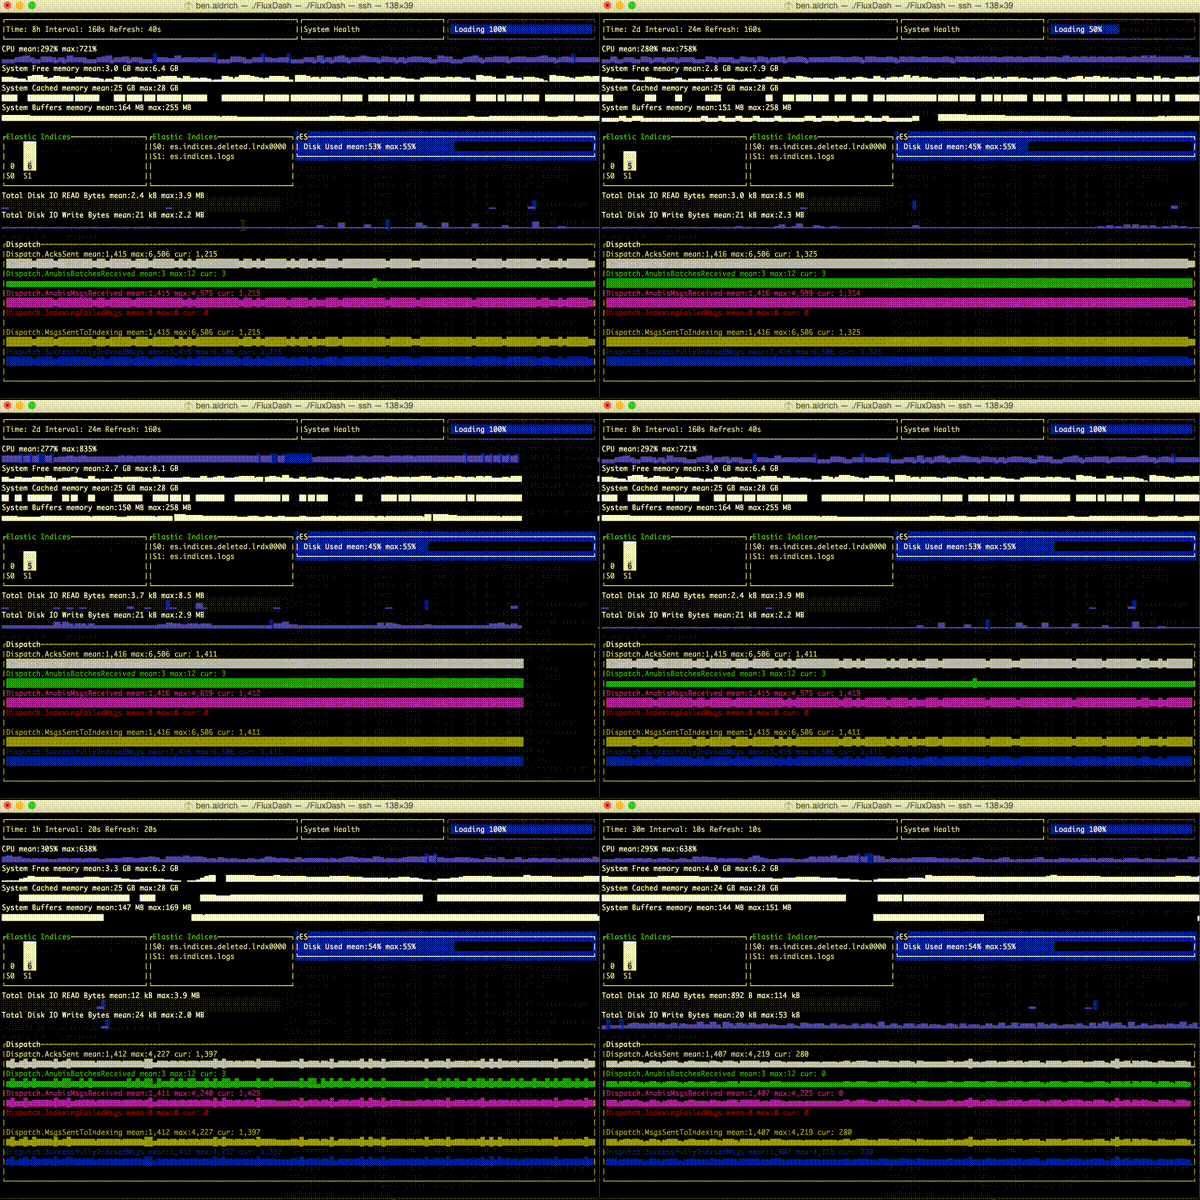
Here is an example dashboard. In the image below you will see that I am adjusting the time range of the queries for the dashboard. This is accomplished by pressing to move forward in time and to move back through the list of time ranges. Right now time ranges are hard coded to be:
{"15m", "30m", "1h", "8h", "24h", "2d", "5d", "7d"}
This will become configurable eventually but these are the most commonly used in our system.

You will also notice that the refresh and the group by interval are adjusted based on the time range. Again this will be come configurable at a later date.
{
    "rows": [{
        "height": 1,
        "span": 12,
        "offset": 0,
        "columns": [{
            "height": 1,
            "span": 6,
            "offset": 0,
            "timep": {
                "height": 3,
                "border": true
            }
        },{
            "height": 1,
            "span": 3,
            "offset": 0,
            "p": {
                "height": 3,
                "text": "System Health",
                "border": true
            }
        },
        {
            "height": 1,
            "span": 3,
            "offset": 0,
            "loading": {
                "height": 3,
                "border": true,
                "bordertop": true,
                "borderbottom": true,
                "borderright": true,
                "borderleft": true,
                "BarColor": 5,
                "BorderFg": 5
            }
        }]
    },
     {
        "height": 1,
        "span": 12,
        "offset": 0,
        "columns": [{
            "height": 1,
            "span": 12,
            "offset": 0,
            "sparklines": {
                "Height" : 1,
                "lines": [{
                    "from": "/system.cpu/",
                    "title": "CPU",
                    "where": "",
                    "type": 2,
                    "height": 1,
                    "linecolor" : 5,
                    "titlecolor": 0
                }, {
                    "from": "/system.mem.free/",
                    "title": "System Free memory",
                    "type": 3,
                    "height": 1
                },
                {
                    "from": "/system.mem.cached/",
                    "title": "System Cached memory",
                    "type": 3,
                    "height": 1
                },{
                    "from": "/system.mem.buffers/",
                    "title": "System Buffers memory",
                    "type": 3,
                    "height": 1
                }]
            }
        }]
    },
     {
        "height": 1,
        "span": 12,
        "offset": 0,
        "columns": [{
            "height": 1,
            "span": 3,
            "offset": 0,
            "barchart": {
                "height": 6,
                "from": "/es.indices/",
                "where": "service='gomaintain'",
                "borderLabel": "Elastic Indices"
            }
        },{
        "height": 1,
        "span": 6,
        "offset": 0,
        "gauge": {
            "height": 3,
            "from": "/es.*.FS.Used.Percent/",
            "where": "service='gomaintain'",
            "border": true,
            "BorderLabel": "ES",
            "bordertop": true,
            "borderbottom": true,
            "borderright": true,
            "borderleft": true,
            "BarColor": 5,
            "BorderBg": 5,
            "label": "Disk Used"
        }
    }]
},{
        "height": 1,
        "span": 12,
        "offset": 0,
        "columns": [{
            "height": 1,
            "span": 12,
            "offset": 0,
            "sparklines": {
                "Height" : 1,
                "lines": [{
                    "from": "/system.disk.[^dm|util].*.read.bytes/",
                    "title": "Total Disk IO READ Bytes",
                    "where": "",
                    "type": 3,
                    "height": 1,
                    "linecolor" : 5,
                    "titlecolor": 0
                },{
                    "from": "/system.disk.[^dm|util].*.write.bytes/",
                    "title": "Total Disk IO Write Bytes",
                    "where": "",
                    "type": 3,
                    "height": 1,
                    "linecolor" : 5,
                    "titlecolor": 0
                }]
            }
        }]
    },
         {
        "height": 1,
        "span": 12,
        "offset": 0,
        "columns": [{
            "height": 1,
            "span": 12,
            "offset": 0,
            "multispark": {
                "height": 3,
                "from": "/Dispatch.*/",
                "where": "service='godispatch'",
                "borderLabel": "Dispatch",
                "border" : true,
                "Bordertop" : true,
                "Borderbottom" : true,
                "Borderleft" : true,
                "Borderright" : true,
                "Borderfg": 4,
                "bg" : 1,
                "type": 1,
                "autocolor": true,
                "titlecolor": 6
            }
        }]
    }]
}
More Reading
Recommend
-
 133
133
The Influx Query Language Specification Introduction This is a reference for the Influx Query Language ("InfluxQL"). InfluxQL is a SQL-like query language for interacting with InfluxDB. It has been lovingly crafted to fee...
-
 126
126
InfluxDB InfluxDB is an open source time series platform. This includes APIs for storing and querying data, processing it in the background for ETL or monitoring and alerting purposes, user dashboards, and visualizing and exploring the d...
-
 155
155
InfluxDB中文文档 InfluxDB是一个用于存储和分析时间序列数据的开源数据库。 主要特性有: 内置HTTP接口,使用方便 数据可以打标记,这样查询可以很灵活 类SQL的查询语句 安装管理很简单,并且读...
-
 84
84
性能测试工具 JMeter 实时监控仪表板配置 (Grafana + InfluxDB)
-
 82
82
操作系统 : CentOS7.3.1611_x64 go语言版本:1.8.3 linux/amd64 InfluxDB版本:1.1.0 安装InfluxDB之后,在/usr/bin下会有如下几个文件: influxd influxdb服务器 influx influxdb命令行客户端 influx_insp...
-
 84
84
操作系统 : CentOS7.3.1611_x64 go语言版本:1.8.3 linux/amd64 InfluxDB版本:1.1.0 源码路径: github.com/influxdata/influxdb/cmd/influxd 程序入口(main.go): func main() { rand.Seed(time.Now().UnixNano...
-
 70
70
该文章不存在或者被删除 ...
-
 72
72
InfluxDB+cAdvisor+Grafana配置Docker监控 一、配置influxdb docker run -d \ -p 8083:8083 \ -p 8086:8086 \ --expose 8090 \ --expose 8099 \ --name influxsrv \ tutum/influxdb 默认用户名:roo...
-
 88
88
Readme.md Grafterm
-
 41
41
README.md blessed-contrib Build dashboards (or any other application) using ascii/ansi art and javascript. Friendly to terminals, ssh...
About Joyk
Aggregate valuable and interesting links.
Joyk means Joy of geeK