
What’s New in MATLAB R2022a?
source link: https://nhigham.com/2022/04/19/whats-new-in-matlab-r2022a/
Go to the source link to view the article. You can view the picture content, updated content and better typesetting reading experience. If the link is broken, please click the button below to view the snapshot at that time.

In this post I discuss some of the new features in MATLAB R2022a, focusing on ones that relate to my particular interests. See the release notes for a detailed list of the many changes in MATLAB and its toolboxes. For my articles about new features in earlier releases, see here.
Themes
MATLAB Online now has themes, including a dark theme (which is my preference). We will have to wait for a future release for themes to be supported on desktop MATLAB.
I recall that @nhigham was asking for this. Currently @MATLAB Online only at the moment though. Desktop MATLAB isn’t there yet
— Mike Croucher (@walkingrandomly) March 11, 2022
Economy Factorizations
One can now write qr(A,'econ') instead of qr(A,0) and gsvd(A,B,'econ') instead of gsvd(A,B) for the “economy size” decompositions. This is useful as the 'econ' form is more descriptive. The svd function already supported the 'econ' argument. The economy-size QR factorization is sometimes called the thin QR factorization.
Tie Breaking in the round Function
The round function, which rounds to the nearest integer, now breaks ties by rounding away from zero by default and has several other tie-breaking options (albeit not stochastic rounding). See a sequence of four blog posts on this topic by Cleve Moler starting with this one from February 2021.
Tolerances for null and orth
The null (nullspace) and orth (orthonormal basis for the range) functions now accept a tolerance as a second argument, and any singular values less than that tolerance are treated as zero. The default tolerance is max(size(A)) * eps(norm(A)). This change brings the two functions into line with rank, which already accepted the tolerance. If you are working in double precision (the MATLAB default) and your matrix has inherent errors of order (for example), you might set the tolerance to
, since singular values smaller than this are indistinguishable from zero.
Unit Testing Reports
The unit testing framework can now generate docx, html, and pdf reports after test execution, by using the function generatePDFReport in the latter case. This is useful for keeping a record of test results and for printing them. We use unit testing in Anymatrix and have now added an option to return the results in a variable so that the user can call one of these new functions.
Checking Arrays for Special Values
Previously, if you wanted to check whether a matrix had all finite values you would need to use a construction such as all(all(isfinite(A))) or all(isfinite(A),'all'). The new allfinite function does this in one go: allfinite(A) returns true or false according as all the elements of A are finite or not, and it works for arrays of any dimension.
Similarly, anynan and anymissing check for NaNs or missing values. A missing value is a NaN for numerical arrays, but is indicated in other ways for other data types.
Linear Algebra on Multidimensional Arrays
The new pagemldivide, pagemrdivide, and pageinv functions solve linear equations and calculate matrix inverses using pages of -dimensional arrays, while
tensorprod calculates tensor products (inner products, outer products, or a combination of the two) between two -dimensional arrays.
Animated GIFs
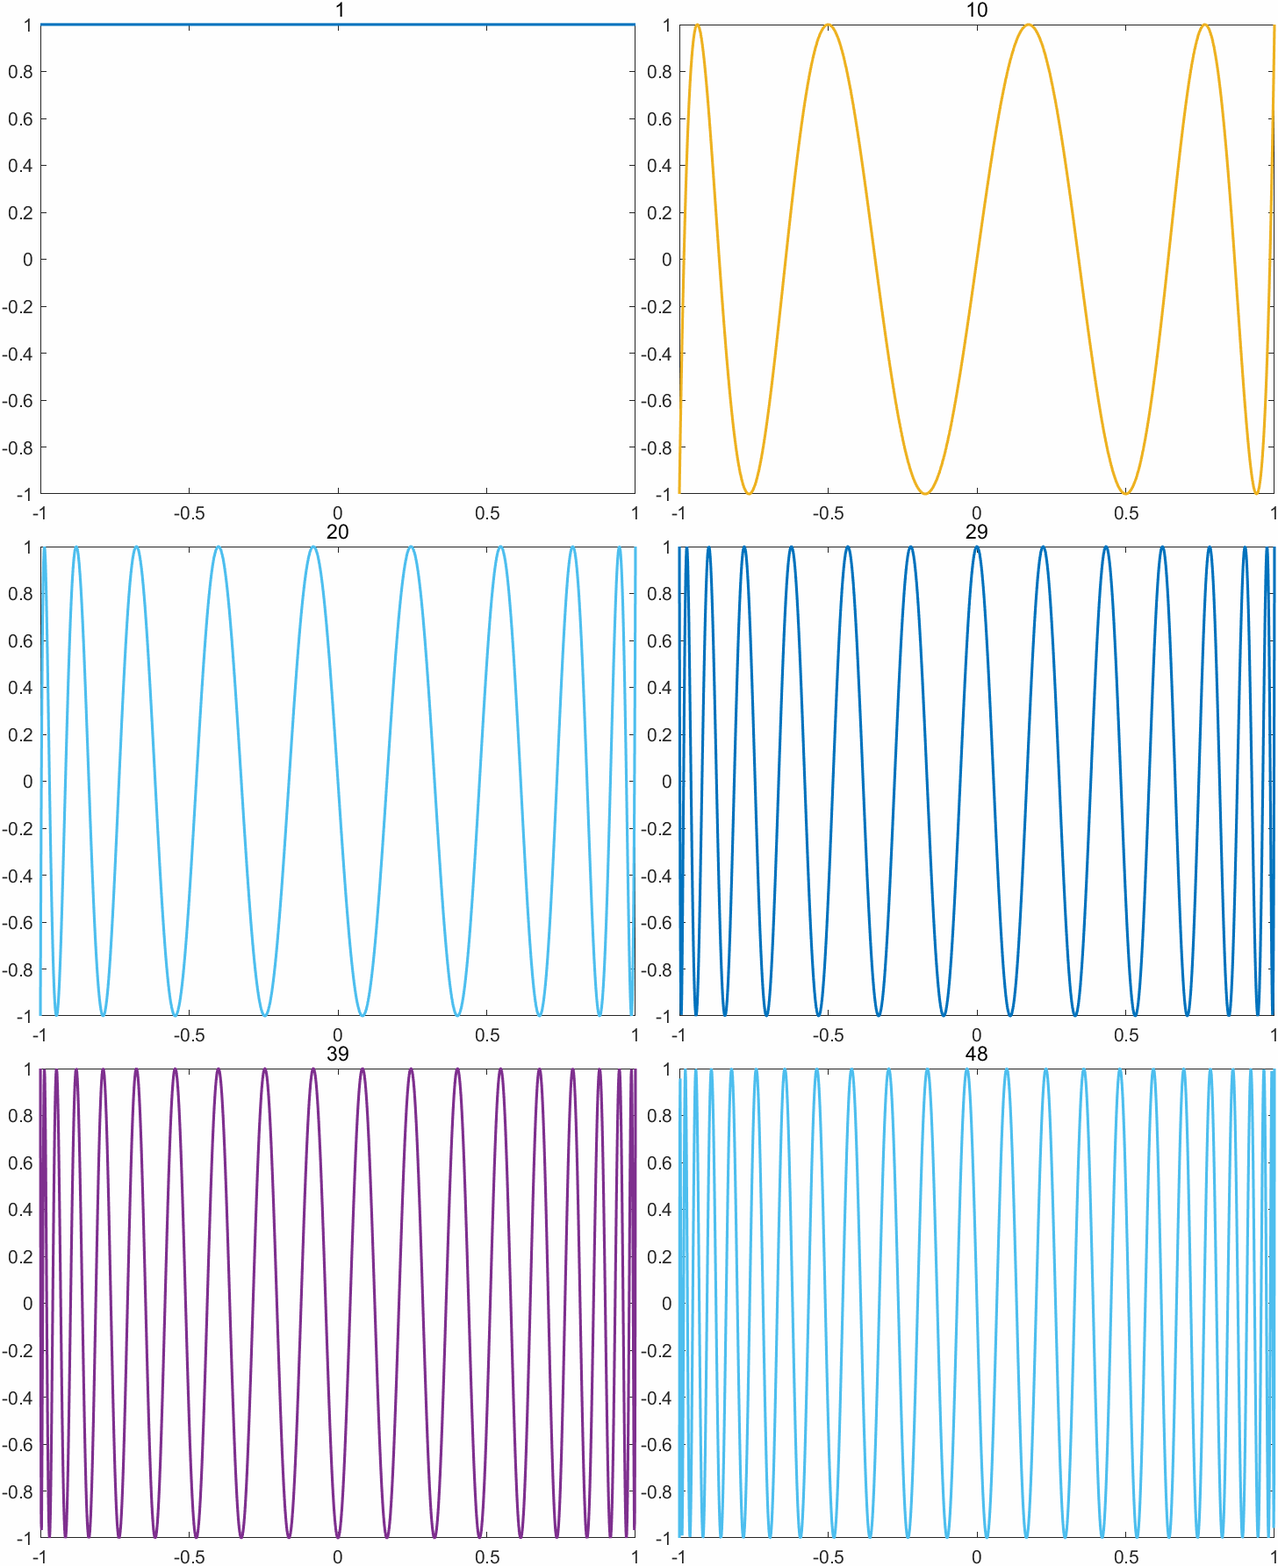
The append option of the exportgraphics function now supports the GIF format, enabling one to create animated GIFs (previously only multipage PDF files were supported). The key command is exportgraphics(gca,file_name,"Append",true). There are other ways of creating animated GIFs in MATLAB, but this one is particularly easy. Here is an example M-file (based on cheb3plot in MATLAB Guide) with its output below.
%CHEB_GIF  Animated GIF of Chebyshev polynomials.
%   Based on cheb3plot in MATLAB Guide.
x = linspace(-1,1,1500)';
p = 49
Y = ones(length(x),p);

Y(:,2) = x;
for k = 3:p
  Y(:,k) = 2*x.*Y(:,k-1) - Y(:,k-2);
end

delete cheby_animated.gif
a = get(groot,'defaultAxesColorOrder'); m = length(a);

for j = 1:p-1 % length(k)
    plot(x,Y(:,j),'LineWidth',1.5,'color',a(1+mod(j-1,m),:));
    xlim([-1 1]), ylim([-1 1])  % Must freeze axes.
    title(sprintf('%2.0f', j),'FontWeight','normal')
    exportgraphics(gca,"cheby_animated.gif","Append",true)
end

Recommend
-
 47
47
本书全面而系统地介绍了MATLAB算法和案例应用,涉及面广,从基本操作到算法应用,几乎涵盖MATLAB算法的所有重要知识。本书结合算法理论和流程,通过大量案例,详解算法代码,解决具体的工程案例,让读者更加深入地学习和掌握各种算法在不同案例中的应用。
-
 72
72
Hello Readers! Recently I’ve created Machine Learning...
-
 43
43
之前学习Matlab是为了参加一个数学建模的比赛,但是在慢慢的学习当中发现了matlab这款软件是真的有趣,真的非常有用,大家没事也可以去学习一下使用matlab。 在参加完建模比赛之后,matlab这个软件业一直没有卸载就放在我的电脑里面。直到...
-
 6
6
Implicit Expansion: A Powerful New Feature of MATLAB R2016b The latest release of MATLAB, R2016b, contains a feature called implicit expansion, which is an extension of the scalar expansion that has been part of MATLA...
-
 7
7
こんにちは.道家です. 新入社員の方,新入生の方,おめでとうございます!我が家では娘が新小学 1 年生となりました.入学式は保護者一人の参加だったため私は校門の前で写真を撮るのみでしたが,新たなフェーズに入った気分で少しワクワク(と...
-
 6
6
R2022a was MathWorks biggest release ever » The MATLAB Blog Every day, over 5000 MathWorkers s...
-
 6
6
ダークモード MATLAB:New Desktop for MATLAB » MATLAB ユーザーコミュニティー ※この投稿は 2023 年 3 月 17 日に The MATLAB blog (
-
 6
6
What’s New for Low-Code AI in MATLAB R2023a » Artificial Intelligence MATLAB provides low-code a...
-
 5
5
The evolution of Quantitative Finance in MATLAB (What’s New) » Quantitative Finance Hi Everyone,...
-
 10
10
MATLAB Portfolio Backtesting – A new app now on GitHub! » Quantitative Finance The following...
About Joyk
Aggregate valuable and interesting links.
Joyk means Joy of geeK