
11

Running my first Node.js project with Netbeans
source link: https://www.hhutzler.de/blog/running-first-node-js-project-netbeans/
Go to the source link to view the article. You can view the picture content, updated content and better typesetting reading experience. If the link is broken, please click the button below to view the snapshot at that time.

Node.js Overview
Node.js processing model
- Follows single threaded even loop processing model which can handle more and more concurrent requests easily
- Another important point to keep in mind that Node.js architecture has two types of threads
Main Thread (Single Thread)
- Called as internal thread as well, all the non I/O blocking requests are assigned using Main thread
Worker Thread(s)
- Used for assigning blocking I/O heavy requests
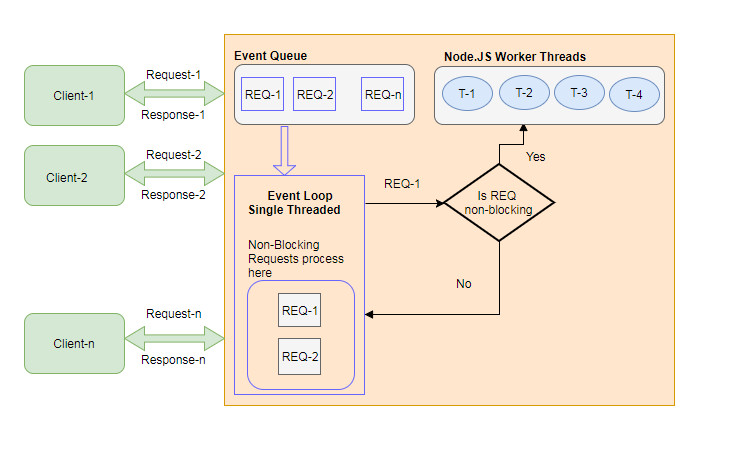
Here are the details on how the single threaded event loop based processing works
- Client sends the request to web sever
- Node.js web server receives client requests from different clients, puts them into a queue. This queue is called event queue
- Node.js has an internal component called event loop which runs the loop on event queue, assigns the request to a single thread if the request is non-blocking
- In case of blocking (I/O heavy) request, event loop will assign this to worker thread
- While worker thread is processing the request, event loop will continue to process other requests available in event queue
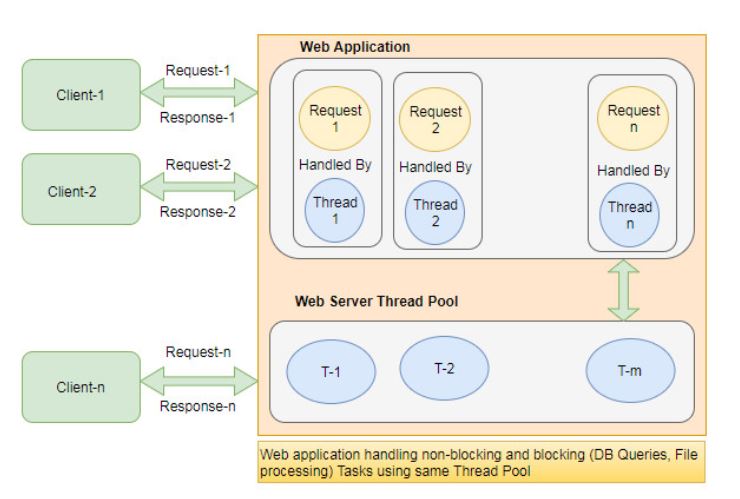
Node.js and Standard Webserver Flow-Diagramms
Node.js Flow Diagram
Standard Webserver Flow Diagram
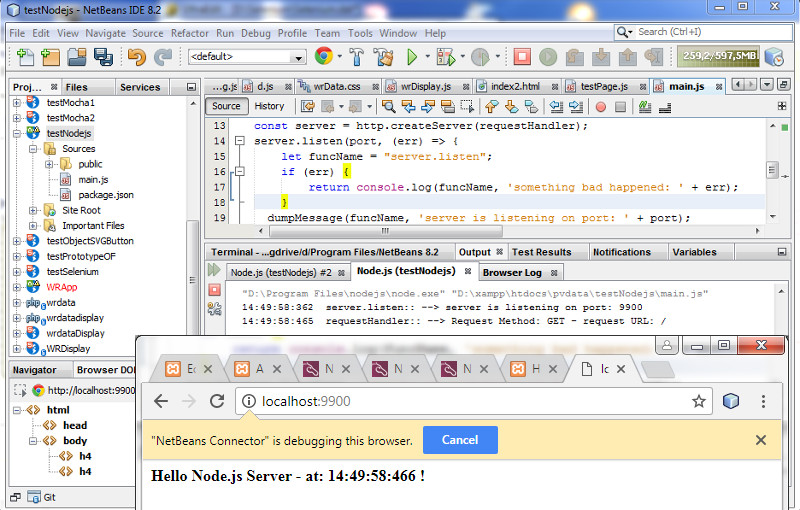
My First Node.js Web Application
How it works ?
- Netbeans runs our Code in 2 Steps
- Step1: Netbeans start a nodejs server process to execute HTTP server Code
- –> Our HTTP server is now listening on port : 9900
- Step2: Netbeans starts a Chrome Browser Windows and connects to Port 9900
- –> Our Browser display the Content provided by our Http Server
Run a first Node.js Project
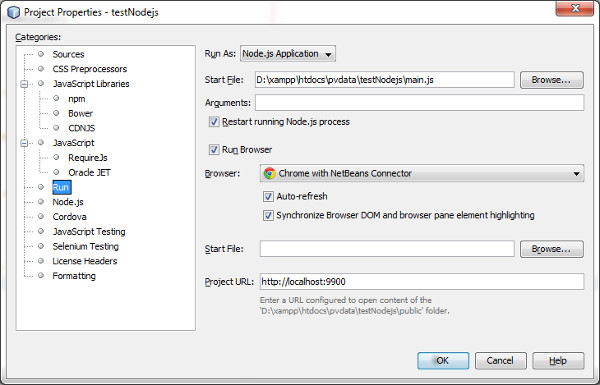
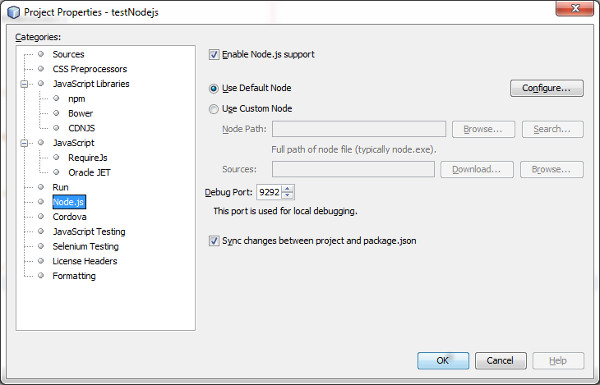
Setup a Node.js project properties within Netbeans
Step 1 : Configure Netbeans Project Run Methode Step 2 : Configure Node.js Properties
Add the following Code to main.js
const http = require('http');
const port = 9900;

const requestHandler = (request, response) => {
    let funcName = "requestHandler";
    if (request.method === 'GET' && request.url === '/' ){
        dumpMessage(funcName, "Request Method: GET - request URL: " + request.url);
        response.writeHead(200, {"Content-Type": "text/html"});
        response.end('Hello Node.js Server - at:  ' + getTime() + '!');
    }
};

const server = http.createServer(requestHandler);

server.listen(port, (err) => {
    let funcName = "server.listen";
    if (err) {
        return console.log(funcName, 'something bad happened: ' + err);
    }

  dumpMessage(funcName, 'server is listening on port: ' + port);
});

function dumpMessage(testName, mesg) {
    console.log(getTime() + testName + ":: --> " + mesg);
};

function getTime() {
    var ts = new Date();
    return ts.toLocaleTimeString()+ ":" + ts.getMilliseconds() + "  ";
};
Finally run the Node.js Code
Step 3 : Run the project
Run above Node.js project manaully
Start the http Server
D:\xampp\htdocs\pvdata\testNodejs> "D:\Program Files\nodejs\node.exe"  "D:\xampp\htdocs\pvdata\testNodejs\main.js"
17:14:42:536  server.listen:: --> server is listening on port: 9900
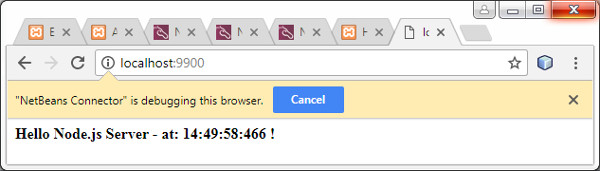
Redirect your browser to the Listening Adress of our Web Server: http://localhost:9900
Browser Output
Debugging a Node.js Application with Netbeans – Currently NOT working due to Netbeans Bug 271238
- Debugging the Node.js App with Netbeans 8.2 fails following Error
- This is unresolved NetBeans Bug 271238 – Node.js v8.1.3 cannot be debugged
"D:\Program Files\nodejs\node.exe" "--debug-brk=9292" "D:\xampp\htdocs\pvdata\testNodejs\main.js"
 (node:10116) [DEP0062] DeprecationWarning: `node --debug` and `node --debug-brk` are invalid.
Please use `node --inspect` or `node --inspect-brk` instead.

Done.
Debugging ourNode.js Application manually
Start the node.js process with inspect-brk option
- Enable inspector agent
- Listen on default address and port (127.0.0.1:9229)
- Break before user code starts
D:\xampp\htdocs\pvdata\testNodejs> node --inspect-brk main.js
Debugger listening on ws://127.0.0.1:9229/9391ed9f-a46d-4f49-bee2-b83d6dafb055
For help see https://nodejs.org/en/docs/inspector
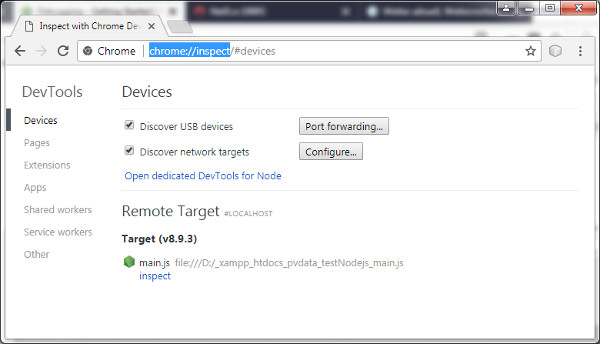
Attach Chrome Devtools 55+ to the Node.js Debugger process
- Open a Chrome DevTool 55+ Browser session with following URL: chrome://inspect
- Select : Open dedicated DevTools for Node
Attach Chrome DevTools to Node.js Inspector
CLI should respond with: Debugger attached
D:\xampp\htdocs\pvdata\testNodejs> node --inspect-brk main.js
Debugger listening on ws://127.0.0.1:9229/9391ed9f-a46d-4f49-bee2-b83d6dafb055
For help see https://nodejs.org/en/docs/inspector
Debugger attached.
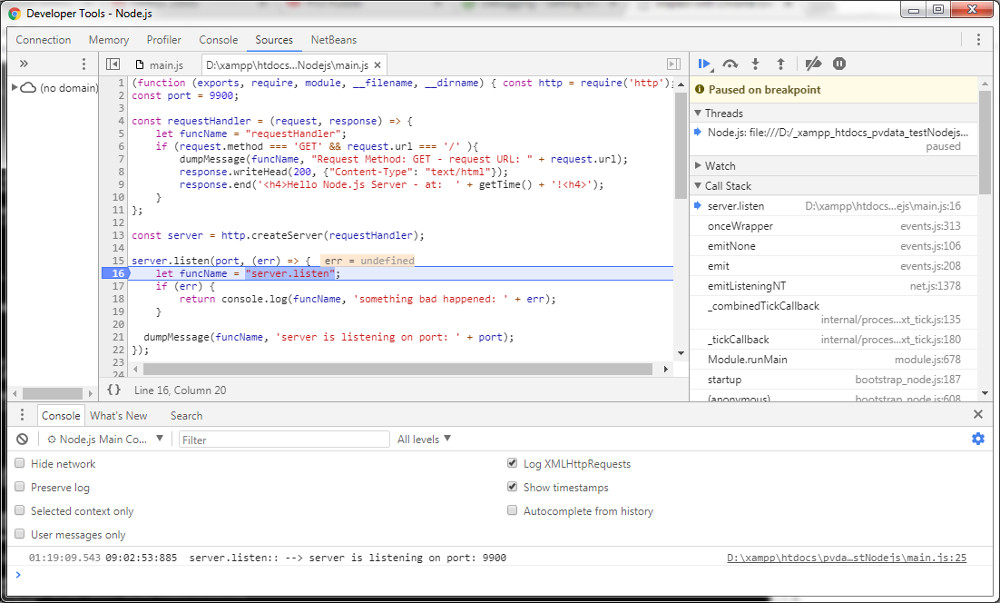
Start Debugging
Debug Node.js by viewing Sources and setting Breakpoint
Reference
Recommend
About Joyk
Aggregate valuable and interesting links.
Joyk means Joy of geeK