

Migrate Existing Xamarin.Forms Custom Renderers to .NET MAUI
source link: https://www.telerik.com/blogs/migrate-existing-xamarin-forms-custom-renderers-dotnet-maui-app
Go to the source link to view the article. You can view the picture content, updated content and better typesetting reading experience. If the link is broken, please click the button below to view the snapshot at that time.
Migrate Your Existing Xamarin.Forms Custom Renderers to .NET MAUI App
Xamarin.Forms evolved into a new framework—.NET MAUI. And from our practice in Xamarin.Forms, custom renderers and platform effects are widely used. Now we have .NET MAUI, where the renderers are replaced with handlers. So how do you reuse the custom renderers in a .NET MAUI app?
As we know, creating a custom renderer allows us to target a specific type of control on a specific platform. If you have a Xamarin.Forms application with custom renderers implemented, don’t worry—you can reuse them in your .NET MAUI app. ❤ In this blog post I will show you the magic for how to do it. 👌
For this magic I will use the HandlerChanged event introduced in .NET MAUI.
At the end we will have the following result:
Let’s Get Started
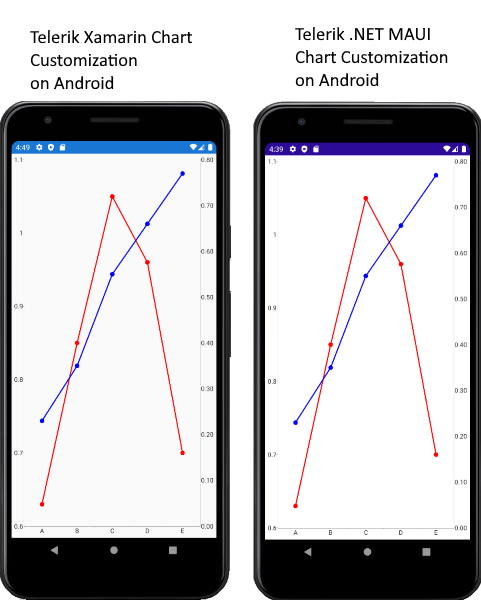
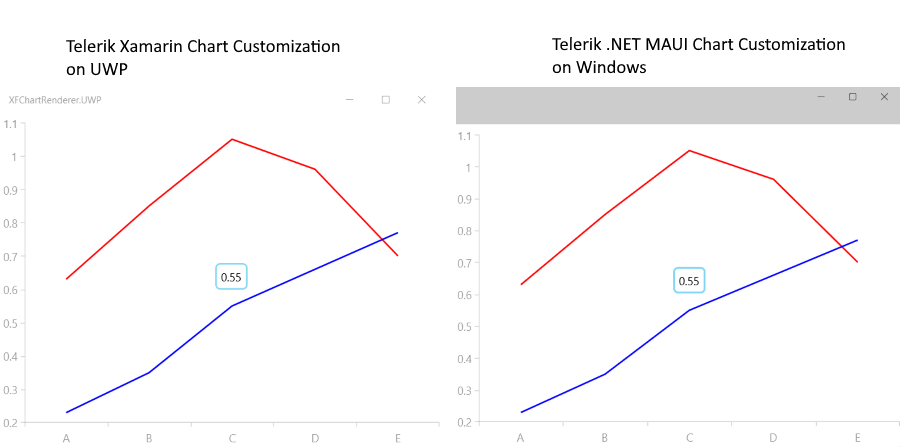
I have а Xamarin.Forms sample project named XFChartRenderer with custom renderers on Android and UWP. The project uses the Telerik UI for Xamarin Chart control. On UWP, the renderer is used for customizing the chart tooltip and the text in it. On Android, the renderer is used for adding multiple chart axes and displaying circle marks on the chart data point. The chart series used is LineSeries.
Android Renderer
using XFChartRenderer.Droid;[assembly: Xamarin.Forms.ExportRenderer(typeof(XFChartRenderer.MyCustomChart), typeof(CustomChartRenderer))]namespace XFChartRenderer.Droid{public class CustomChartRenderer : Telerik.XamarinForms.ChartRenderer.Android.CartesianChartRenderer{public CustomChartRenderer(Android.Content.Context context) : base(context){}protected override void OnElementChanged(Xamarin.Forms.Platform.Android.ElementChangedEventArgs<Telerik.XamarinForms.Chart.RadCartesianChart> e){base.OnElementChanged(e);if (this.Control != null){var series = this.Control.Series.ToArray();AddSecondaryVerticalAxis(series[1]);for (int i = 0; i < this.Control.Series.Size(); i++){Com.Telerik.Widget.Chart.Visualization.CartesianChart.Series.Categorical.LineSeries lineSeries = (Com.Telerik.Widget.Chart.Visualization.CartesianChart.Series.Categorical.LineSeries)this.Control.Series.Get(i);lineSeries.DataPointRenderer = new PointRenderer(lineSeries);}}}private void AddSecondaryVerticalAxis(Java.Lang.Object lineSeries){if (lineSeries is Com.Telerik.Widget.Chart.Visualization.CartesianChart.Series.Categorical.LineSeries){var series = lineSeries as Com.Telerik.Widget.Chart.Visualization.CartesianChart.Series.Categorical.LineSeries;Com.Telerik.Widget.Chart.Visualization.CartesianChart.Axes.LinearAxis verticalAxisBar = new Com.Telerik.Widget.Chart.Visualization.CartesianChart.Axes.LinearAxis();verticalAxisBar.HorizontalLocation = Com.Telerik.Widget.Chart.Engine.Axes.Common.AxisHorizontalLocation.Right;series.VerticalAxis = verticalAxisBar;}}}}And the PointRenderer.cs file which we use to render the circle mark on the chart data point:
namespace XFChartRenderer.Droid{public class PointRenderer : Java.Lang.Object, Com.Telerik.Widget.Chart.Visualization.CartesianChart.Series.Pointrenderers.IChartDataPointRenderer{private Com.Telerik.Widget.Chart.Visualization.CartesianChart.Series.Categorical.LineSeries lineSeries;public PointRenderer(Com.Telerik.Widget.Chart.Visualization.CartesianChart.Series.Categorical.LineSeries lineSeries){this.lineSeries = lineSeries;}public void RenderPoint(Android.Graphics.Canvas canvas, Com.Telerik.Widget.Chart.Engine.DataPoints.DataPoint dataPoint){Com.Telerik.Widget.Palettes.PaletteEntry entry = this.lineSeries.Palette.GetEntry(this.lineSeries, this.lineSeries.CollectionIndex);using (Android.Graphics.Paint paint = new Android.Graphics.Paint()){paint.Color = new Android.Graphics.Color(entry.Fill);canvas.DrawCircle((float)dataPoint.CenterX, (float)dataPoint.CenterY, 12, paint);}}}}UWP Renderer
using System.Linq;using XFChartRenderer.UWP;[assembly: Xamarin.Forms.Platform.UWP.ExportRenderer(typeof(XFChartRenderer.MyCustomChart), typeof(CustomChartRenderer))]namespace XFChartRenderer.UWP{public class CustomChartRenderer : Telerik.XamarinForms.ChartRenderer.UWP.CartesianChartRenderer{public CustomChartRenderer(){}protected override void OnElementChanged(Xamarin.Forms.Platform.UWP.ElementChangedEventArgs<Telerik.XamarinForms.Chart.RadCartesianChart> e){base.OnElementChanged(e);if (this.Control is Telerik.UI.Xaml.Controls.Chart.RadCartesianChart nativeChart){var toolTipBehavior = nativeChart.Behaviors.FirstOrDefault(a => a is Telerik.UI.Xaml.Controls.Chart.ChartTooltipBehavior);if (toolTipBehavior != null){var customDataTemplate = App.Current.Resources["CustomToolTipTemplate"] as Windows.UI.Xaml.DataTemplate;toolTipBehavior.SetValue(Telerik.UI.Xaml.Controls.Chart.ChartTooltipBehavior.ContentTemplateProperty, customDataTemplate);}}}}}And inside the UWP project we need to define the custom DataTemplate we will use for the tooltip: CustomToolTipTemplate.
<Application.Resources><DataTemplate x:Key="CustomToolTipTemplate"><Border BorderBrush="#80D6F4"CornerRadius="5"Padding="5"Background="Transparent"BorderThickness="2"><TextBlock Text="{Binding DataPoint.Value}"Foreground="Black" /></Border></DataTemplate></Application.Resources>Custom Chart Control
This is required if you want the customization to be applied only to a particular control, not to all instances.
Create a class MyCustomChart, which inherits from Telerik.XamarinForms.Chart.RadCartesianChart.
We will use the same class in the .NET MAUI app.
public class MyCustomChart : Telerik.XamarinForms.Chart.RadCartesianChart{}Chart Definition in XAML
We are going to use the same chart definition in both projects—Xamarin.Forms and .NET MAUI.
<local:MyCustomChart x:Name="myCustomChart"><telerikChart:RadCartesianChart.Palette><telerikChart:ChartPalette><telerikChart:ChartPalette.Entries><telerikChart:PaletteEntry FillColor="Red" StrokeColor="Red" /><telerikChart:PaletteEntry FillColor="Blue" StrokeColor="Blue" /></telerikChart:ChartPalette.Entries></telerikChart:ChartPalette></telerikChart:RadCartesianChart.Palette><telerikChart:RadCartesianChart.BindingContext><local:ViewModel /></telerikChart:RadCartesianChart.BindingContext><telerikChart:RadCartesianChart.HorizontalAxis><telerikChart:CategoricalAxis PlotMode="BetweenTicks" /></telerikChart:RadCartesianChart.HorizontalAxis><telerikChart:RadCartesianChart.VerticalAxis><telerikChart:NumericalAxis /></telerikChart:RadCartesianChart.VerticalAxis><telerikChart:RadCartesianChart.Series><telerikChart:LineSeries CategoryBinding="Category"ValueBinding="Value"DisplayName=" Data1"ItemsSource="{Binding Data1}" /><telerikChart:LineSeries CategoryBinding="Category"ValueBinding="Value"DisplayName=" Data2"ItemsSource="{Binding Data2}" /></telerikChart:RadCartesianChart.Series><telerikChart:RadCartesianChart.ChartBehaviors><telerikChart:ChartTooltipBehavior /></telerikChart:RadCartesianChart.ChartBehaviors></local:MyCustomChart>And the Namespaces Used
xmlns:telerikChart="clr-namespace:Telerik.XamarinForms.Chart;assembly=Telerik.XamarinForms.Chart" xmlns:local="clr-namespace:XFChartRenderer"The ViewModel and Business Model Are the Same in our .NET MAUI App
public class ViewModel{public ViewModel(){this.Data1 = GetCategoricalData();this.Data2 = GetCategoricalData2();}public ObservableCollection<CategoricalData> Data1 { get; set; }public ObservableCollection<CategoricalData> Data2 { get; set; }private static ObservableCollection<CategoricalData> GetCategoricalData(){var data = new ObservableCollection<CategoricalData> {new CategoricalData { Category = "A", Value = 0.63 },};return data;}private static ObservableCollection<CategoricalData> GetCategoricalData2(){var data = new ObservableCollection<CategoricalData> {new CategoricalData { Category = "A", Value = 0.23 },new CategoricalData { Category = "B", Value = 0.35 },new CategoricalData { Category = "C", Value = 0.55 },new CategoricalData { Category = "D", Value = 0.66 },new CategoricalData { Category = "E", Value = 0.77 },};return data;}}public class CategoricalData{public object Category { get; set; }public double Value { get; set; }}Reuse the Renderers in .NET MAUI Project
I used the Telerik UI for Xamarin Chart control, and the control is available in the Telerik UI for .NET MAUI suite. So I can migrate all Xamarin Chart customizations to .NET MAUI. 🎉
Step 1: Set up .NET MAUI.
Step 2: Create a .NET MAUI project.
For this step, I am going to use the Telerik UI for .NET MAUI project template. If you do not have a Telerik UI for .NET MAUI installed, here are the help topics for this:
❗ If you use the Telerik UI for .NET MAUI Project Template, you can skip registering the required renderers and handlers step.
My project is named MAUIChartCustomization.
Step 3: Copy the Custom Chart control, Chart definition in XAML, the ViewModel and Business model from Xamarin.Forms project to your .NET MAUI project.
❗ Add the following namespace where the chart control is defined in XAML:
xmlns:telerikChart="clr-namespace:Telerik.XamarinForms.Chart;assembly=Telerik.Maui.Controls.Compatibility" xmlns:local="clr-namespace:MAUIChartCustomization"Step 4: Inside the Platforms/Android folder of the .NET MAUI project, create a class PointRenderer.
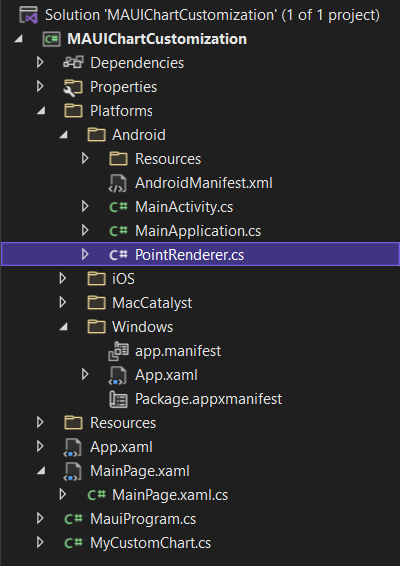
Step 5: Copy the content from the Xamarin.Android project PointRenderer.cs file in the PointRenderer.cs file in our .NET MAUI project:
namespace MAUIChartCustomization.Platforms.Android{public class PointRenderer : Java.Lang.Object, global::Com.Telerik.Widget.Chart.Visualization.CartesianChart.Series.Pointrenderers.IChartDataPointRenderer{private global::Com.Telerik.Widget.Chart.Visualization.CartesianChart.Series.Categorical.LineSeries lineSeries;public PointRenderer(global::Com.Telerik.Widget.Chart.Visualization.CartesianChart.Series.Categorical.LineSeries lineSeries){this.lineSeries = lineSeries;}public void RenderPoint(global::Android.Graphics.Canvas canvas, global::Com.Telerik.Widget.Chart.Engine.DataPoints.DataPoint dataPoint){global::Com.Telerik.Widget.Palettes.PaletteEntry entry = this.lineSeries.Palette.GetEntry(this.lineSeries, this.lineSeries.CollectionIndex);using (global::Android.Graphics.Paint paint = new global::Android.Graphics.Paint()){paint.Color = new global::Android.Graphics.Color(entry.Fill);canvas.DrawCircle((float)dataPoint.CenterX, (float)dataPoint.CenterY, 12, paint);}}}}❗ Note that here we use the global namespace alias to access the Native Android Chart namespaces.
Step 6: Go to Platforms/Windows folder and open the App.xaml file, then reuse the same DataTemplate from the XFChartCustomization project:
<maui:MauiWinUIApplication.Resources><ResourceDictionary><DataTemplate x:Key="CustomToolTipTemplate"><Border BorderBrush="#80D6F4"CornerRadius="5"Padding="5"Background="Transparent"BorderThickness="2"><TextBlock Text="{Binding DataPoint.Value}"Foreground="Black" /></Border></DataTemplate></ResourceDictionary></maui:MauiWinUIApplication.Resources>Step 7: As promised, we will use the HandlerChanged event to access the native view and apply our customizations. So subscribe to the RadCartesianChart.HandlerChanged event, and inside MyCustomChart_HandlerChanged use preprocessor directives for Android and Windows to access the native chart control.
Here is how the MainPage.xaml.cs looks:
namespace MAUIChartCustomization{[XamlCompilation(XamlCompilationOptions.Compile)]public partial class MainPage : ContentPage{public MainPage(){InitializeComponent();this.myCustomChart.HandlerChanged += MyCustomChart_HandlerChanged;}private void MyCustomChart_HandlerChanged(object sender, EventArgs e){var handler = ((MyCustomChart)sender).Handler;if (handler != null){#if ANDROIDvar nativeRenderer = handler.NativeView as Telerik.XamarinForms.ChartRenderer.Android.RadExtendedCartesianChartView;if (nativeRenderer != null){var series = nativeRenderer.Series.ToArray();for (int i = 0; i < nativeRenderer.Series.Size(); i++){Com.Telerik.Widget.Chart.Visualization.CartesianChart.Series.Categorical.LineSeries lineSeries = (Com.Telerik.Widget.Chart.Visualization.CartesianChart.Series.Categorical.LineSeries)nativeRenderer.Series.Get(i) as Com.Telerik.Widget.Chart.Visualization.CartesianChart.Series.Categorical.LineSeries;lineSeries.DataPointRenderer = new Platforms.Android.PointRenderer(lineSeries);}// Call this method to add a second vertical axisAddSecondaryVerticalAxis(series[1]);}#elif WINDOWSvar nativeChart = handler.NativeView as Telerik.UI.Xaml.Controls.Chart.RadCartesianChart;if (nativeChart != null){var toolTipBehavior = nativeChart.Behaviors.FirstOrDefault(a => a.GetType() == typeof(Telerik.UI.Xaml.Controls.Chart.ChartTooltipBehavior)) as Telerik.UI.Xaml.Controls.Chart.ChartTooltipBehavior;if (toolTipBehavior != null){var nativeApp = MauiWinUIApplication.Current;var toolTipCustomTemplate = nativeApp.Resources["CustomToolTipTemplate"] as Microsoft.UI.Xaml.DataTemplate;Telerik.UI.Xaml.Controls.Chart.ChartTooltipBehavior.SetContentTemplate(nativeChart.Series[0], toolTipCustomTemplate);}}#endif}}#if ANDROIDprivate void AddSecondaryVerticalAxis(Java.Lang.Object lineSeries){if (lineSeries is Com.Telerik.Widget.Chart.Visualization.CartesianChart.Series.Categorical.LineSeries){var series = lineSeries as Com.Telerik.Widget.Chart.Visualization.CartesianChart.Series.Categorical.LineSeries;Com.Telerik.Widget.Chart.Visualization.CartesianChart.Axes.LinearAxis verticalAxisBar = new Com.Telerik.Widget.Chart.Visualization.CartesianChart.Axes.LinearAxis();verticalAxisBar.HorizontalLocation = Com.Telerik.Widget.Chart.Engine.Axes.Common.AxisHorizontalLocation.Right;series.VerticalAxis = verticalAxisBar;}}#endif}New to Telerik UI for .NET MAUI? Try It & Share Your Feedback
If you are new to Telerik UI for .NET MAUI, you can learn more about it via the product page. The Telerik UI for .NET MAUI controls are currently in preview and they are free to experiment with, so don’t wait—jump on the cross-platform development bandwagon!
Recommend
About Joyk
Aggregate valuable and interesting links.
Joyk means Joy of geeK