

Streaming at Scale with Azure Event Hubs, Streaming Analytics, and Azure SQL Par...
source link: https://www.codeproject.com/Articles/5325169/Streaming-at-Scale-with-Azure-Event-Hubs-Streami-2
Go to the source link to view the article. You can view the picture content, updated content and better typesetting reading experience. If the link is broken, please click the button below to view the snapshot at that time.
The previous article in this three-part series set up an Event Hub and then streamed data from a CSV file using a small local Python application. This tutorial will process that Event Hub data using Azure Streaming Analytics, then write the data to an Azure SQL Database.
Creating an Azure SQL Server Database
Start by creating an Azure SQL Server database to receive the data. First, go to the Azure portal and search for “SQL database.” Then, click on the Create button.
To create an Azure SQL database, start by picking a subscription and resource group. Choose the previous article’s data-streaming-example resource group.
Next, enter a database name, like weather-db, since that’s the data this tutorial will process.
Next, pick a server. Since there is no server yet, click Create new. A new creation blade will open. Use a server name that is unique across Azure, such as example-weather-server.
It’s best to pick the same location as in the previous article, such as West Europe. Also, create an administrator username and password. Usually, this information should be secure, but for this example, feel free to choose something simple, like your first name and Welcome123!@#.
After accepting the server settings, the screen returns to the database creation blade to configure the compute and storage tier. These settings indicate how much data the user can store and how many cores or Data Transaction Units (DTUs) the database can use. The more cores or DTUs, the faster the database, but the higher the cost. A serverless database is also an option, in which case the user pays for what they use and gets dynamic scaling, but with dynamic pricing. The lowest tier — the Basic DTU tier — has 5 DTUs and can store up to 2GB of data. This tier is more than enough for most tests and only costs about $5 a month, so select that one.
Back in the database creation blade, pick the storage redundancy. Select locally redundant, since it’s least expensive. If a server goes down, the data is still available on another server in the same data center. However, it won’t be available if there happens to be an issue with the entire data center.
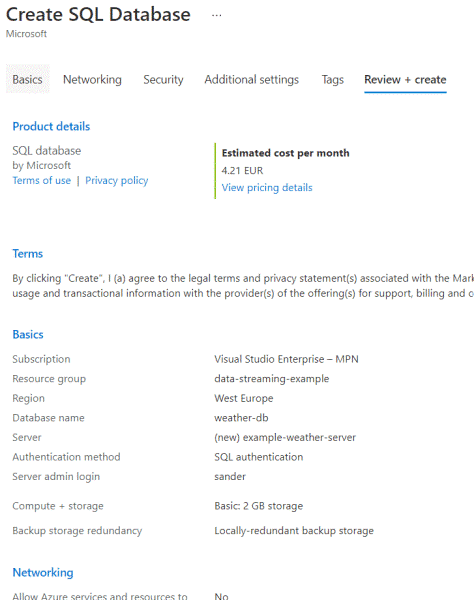
Next are networking, security, additional settings like initial data source and collation, and finally, tags. Skip through them all, go to the Review + create tab, and hit the Create button. The review should look something like this:
Alternatively, with the Azure CLI, first, create the server, then the database, using these commands:
az sql server create –resource-group "data-streaming-example" –name "example-weather-server"
   –admin-user sander –admin-password "Welcome123!@#" –location "West Europe"
az sql db create –resource-group "data-streaming-example" –server "example-weather-server"
   –name "weather-db" –tier Basic –capacity 5 –max-size "2GB"
Don’t forget to escape the exclamation mark in the admin password.
Note: The creation can take up to about 15 minutes.
Exploring Azure Streaming Analytics
Azure Streaming Analytics is a serverless service for analyzing real-time data in the cloud. It uses SQL syntax and is extensible with custom C# and JavaScript.
It’s easy to move data from the Event Hub to Streaming Analytics because of its native integration. In fact, in the previous article’s weather Event Hub, there is an Enable real-time insights from events button in the Process data options, right from the menu. From there, it is possible to try out some queries and create a Stream Analytics job right away. However, this tutorial will make a Stream Analytics job by different means.
Creating a Stream Analytics Job
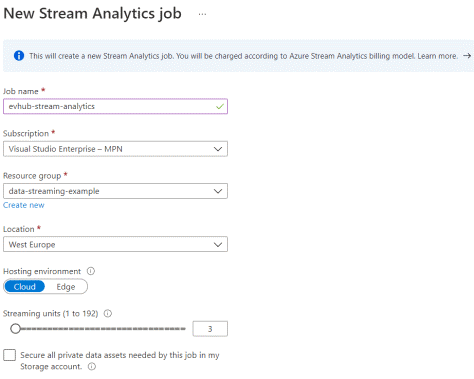
To create a Stream Analytics job, search for the term in the Azure portal, then click Create +. This action opens the creation blade, which is noticeably small. Enter a job name, subscription, resource group, and location. Use a name like evhub-stream-analytics and the same location as the Event Hub, such as West Europe.
Two properties need some explanation: the hosting environment and the streaming units. The hosting environment specifies running the streaming analytics in the cloud (the usual option) or on an edge device. The edge device is typically an on-premises Internet of things (IoT) device, which requires a gateway to connect to Azure. This tutorial uses the cloud.
The number of streaming units indicates how much data the job can compute simultaneously. More streaming units mean more memory and compute power. Since streaming analytics is serverless, users pay for usage, and billing increases the more streaming units they use. The default of three is fine for this article’s use case.
Another option saves private data, like a connection string, in a storage account of the user’s choosing. This tutorial doesn’t need this, so leave this option off.
The creation blade should now look like this screenshot:
Alternatively, using the Azure CLI, use this command:
az stream-analytics job create –job-name "evhub-stream-analytics"
   –resource-group "data-streaming-example" –location "West Europe" –compatibility-level "1.2"
The command requires having the streaming-analytics extension installed in the CLI. Running this from within the Azure portal prompts a question about installing it, so simply confirm.
To run this command within an automated environment, use az extension add –name stream-analytics.
Adding the Event Hub Input
The Stream Analytics job is initially in stopped mode. So, first add inputs and outputs to the job before starting it.
Simply navigate to Inputs from the blade menu to add an input and click + Add stream input. At this time, a user can add three inputs, Blob storage/ADLS Gen2 (Azure Data Lake Storage Gen2), Event Hub, or IoT Hub. Choose the Event Hub, and a new blade opens to select the Event Hub. This tutorial only has one Event Hub, set by default. If there are more, choose the correct one.
Then, provide an input alias, such as evhub-weather-input. It’s worth checking out the input format, which has CSV, Avro, other (XML), and JSON. The default is JSON, and the previous article’s code is sending JSON to the Event Hub, so that should be fine. Note that the original CSV is also usable and still has out-of-the-box support in Stream Analytics.
Adding the SQL Database Output
Next, add the SQL database as output. Simply go to Outputs, click the Add button, and select SQL Database. Name the output something like sql-weather-output. Then, select the resource group and database from the dropdowns and input a table name, like WeatherData.
Giving the Stream Analytics job access to the SQL Server requires additional work. To do this properly, see Microsoft's documentation. This tutorial takes a little shortcut.
First, find the Managed Identity in the analytics job and ensure it’s on. Then, go to the SQL Server and the Azure Active Directory option in the menu. Click Set admin, find the name of the analytics job, select it, and save. Then, go to Firewalls and virtual networks and select Yes to Allow Azure services and resources to access this server. This avoids safelisting the analytics job’s IP address. Finally, click + Add client IP, then save.
Add the WeatherData table to the Azure SQL instance as well. Connect using either the Azure portal or SQL Server Management Studio if the server firewall includes the client IP. Log in using the credentials from the Azure SQL creation blade.
The table should look like this:
CREATE TABLE [dbo].[WeatherData](
   [id] [int] IDENTITY(1,1) NOT NULL,
   [date] nvarchar(256) NULL,
   [city] nvarchar(256) NULL,
   [description] nvarchar(256) NULL,
   [EventProcessedUtcTime] datetime2 NULL,
   [PartitionId] [int] NULL,
   [EventEnqueuedUtcTime] datetime2 NULL
)
Test whether the input and outputs are configured correctly by clicking the Test button on both. If it fails at first, wait a few minutes and try again.
Querying Stream Analytics
Stream Analytics uses an SQL-like query to query data from the source. Set this in the menu’s Query option. This tutorial uses a simple query (below). Stream Analytics adds the EventProcessedUtcTime, PartitionId, and EventEnqueuedUtcTime.
SELECT [date]
   ,city
   ,[description]
   ,EventProcessedUtcTime
   ,PartitionId
   ,EventEnqueuedUtcTime
INTO [sql-weather-output]
FROM [evhub-weather-input]
Optionally, the user can use aggregates. Stream Analytics has a specific set of windowing functions that specify the period to group.
Viewing the Analytics in Action
Now, go back to the overview blade and start the Stream Analytics job. Either start now or schedule a start time.
Starting and stopping the job may take a minute or two. Once it’s running, start up the Python application from the first article, and data should appear in the Azure SQL table.
Next Steps
This article demonstrated setting up an Azure Stream Analytics job and connecting it to Event Hub and an Azure SQL database. Read the final article of this three-part series to transform the data more meaningfully and visualize using PowerBI.
To learn more about how to connect to your data sources, visualize and discover what's important, and share that with your team, check out our Reactor YouTube Introduction into Data Analysis using Power BI.
Recommend
About Joyk
Aggregate valuable and interesting links.
Joyk means Joy of geeK