

An Introduction to Guided Network Troubleshooting
source link: https://blogs.vmware.com/management/2022/02/an-introduction-to-guided-network-troubleshooting.html
Go to the source link to view the article. You can view the picture content, updated content and better typesetting reading experience. If the link is broken, please click the button below to view the snapshot at that time.
With the release of vRealize Network Insight 6.5 Cloud, a new capability was introduced that’s called Guided Network Troubleshooting (GNT). All about making your life easier, Guided Network Troubleshooting does exactly what the name suggests: it guides you through the network troubleshooting process. Welcome to a deep dive into this capability!
Troubleshooting network issues has always been a labor of love (or hate). Someone comes up to you with the statement that “the network is broken.” After asking a bit further, it turns out a VM is having intermittent connectivity issues. You start looking at the VMs network topology and the surrounding network devices, checking metrics, logs, and configuration. After a few hours (or days, depending on the complexity of the network) and checking many of your network devices, you figure out a router is having congestion that is affecting the VM traffic. Guided Network Troubleshooting works to automate a lot of these manual steps into a single process.
Figure 1 – Troubleshooting Session DashboardStarting a Troubleshooting Session
Let’s say you start a troubleshooting session on an application with multiple VMs. Here’s a brief overview of what GNT takes care of:
- Map out all relationships & dependencies for each VM in the application
- Analyze all metrics for anomalies and root causes
- Check for alerts on the VMs and all their relations and let you correlate them to see if there are any alerts related to each other.
Each of these steps provides a world of data and insight. Let’s dive into it!
Relationships & Dependencies
Usually, figuring out what port is connected where and which upstream device is handling a VMs network traffic is the hardest part. Not anymore!
Let’s say you’re troubleshooting an application. That application can be hosted using multiple VMs. Those VMs can be in different networks, on different vSphere hosts, in different racks, and on different top-of-rack switches, the list goes on and on.
When you start an incident troubleshooting session, Guided Network Troubleshooting will figure out the relationships of the application and show you the dependencies. It goes through all the dependencies and checks whether there are any anomalies on those dependencies. That means, if there’s an indirect problem that’s causing performance issues for an application – you’ll be able to tell within seconds.
Figure 2 – Interactive Relationship DiagramThere are a ton of problems detected in the above relationship diagram. But if you follow the red indicators, you’ll notice that the application consists of four VMs, and only the GNT-Edge-1 VM, which is the NSX-T Edge, is having issues. Following the rabbit hole entirely, you can tell that it’s not the Edge itself that is having issues, but it’s the vSphere host that is hosting the NSX-T Edge. You’ll see in the anomalies and metrics chapter, what issues that host is having. 
Currently, the relationships that are visualized, are:
- vSphere Hosts
- VMs in the same Application & Hosts (Peer VMs)
- NSX-T Edges & NSX-T Transport Nodes
- Top-of-Rack Switch Ports
- Traffic Flows
- Used Network Services (i.e., HTTP, LDAP, DNS, etc.)
- VMware Cloud on AWS components:
- SDDC & SDDC Group
- Direct Connect & Policy Based VPNs for connectivity
- VMware Transit Gateway
- NSX-T T0 and T1 Gateway
This list will continue expanding in future releases, as we add more functionality.
Detected Anomalies and Root Causes
Getting insight into the relationships and dependencies of the application you’re troubleshooting is one thing, but to top it off, Guided Network Troubleshooting also positions the right metric charts in the right place. That place is right next to the relationship diagram:
Figure 3 – Metrics, Anomalies, Root Causes, and InsightsThere’s a ton to unpack here. The view on the right displays the metrics and alerts for the object you’re focused on. If you go through the relationship diagram and select something else like a vSphere host, the metrics will focus on that host. Let’s go through each section.
Insights (1)
On the relationship diagram, there are a few key insights. These insights highlight the most relevant anomalies that are detected on the application. In the example above, it’s already pointing out that there’s an anomaly with the network traffic rate of the NSX-T Edge that is hosting the application we’re focusing on. Always start with these insights to see what’s the probable cause of an issue.
Metrics, Anomalies & Root Causes (2 & 3)
Then there is the enormous overview of all metrics vRealize Network Insight has on the objects. When you focus on an application, the metrics for supporting objects (VMs, hosts, NSX-T Edges, switch ports) are visible and each time you dive deeper into the relationship diagram, the metrics change focus to the object you’ve selected.
Because there’s a huge number of types of metrics, Guided Network Troubleshooting also puts the most relevant metrics on top. Taking what we’ve learned with the Analytic Threshold feature, there’s a baseline created of each metric – and a machine learning algorithm detects any anomalies from that baseline. Saving you from having to manually inspect the metrics.
Once Guided Network Troubleshooting has found anomalies, you can flag anomalies that stand out as root causes. Think about massive spikes in traffic, or a spike in disk write latency, anything significant enough that could impact the performance of an application or VM. When selecting a root cause, you can close the incident troubleshooting session, or keep it open (i.e., to select more root causes).
Figure 4 – Selecting a Root CauseAlert Timeline (4)
Below the metrics panel, there is the alert timeline showing you the alerts and configuration changes that have occurred during the period you’ve selected. Let’s say there’s an Analytic Threshold alert configured for a VM inside the application, based on packet loss percentage. If that threshold is violated, an alert goes off. The timeline shows the time that alert was fired, but also when it was remediated.
Figure 5 – Alerts and Changes TimelineA configuration change can also cause issues for the infrastructure. That’s why you’ll see configuration changes (VM updates, NSX-T reconfigurations, vMotions, the list goes on) also mentioned on the timeline. If all of the metrics weren’t enough, this will give you full visibility on what’s been going on with this application.
Collaborate
While you are troubleshooting a network issue using vRealize Network Insight, it’s possible that another colleague needs to look at something, either on a VM or the security policies. To enable collaboration, Guided Network Troubleshooting has built-in features to make it easy to share notes in a troubleshooting session and to share the session with multiple people.
Notes
On the bottom of every troubleshooting session page, you’ll find a place to make notes as you go:

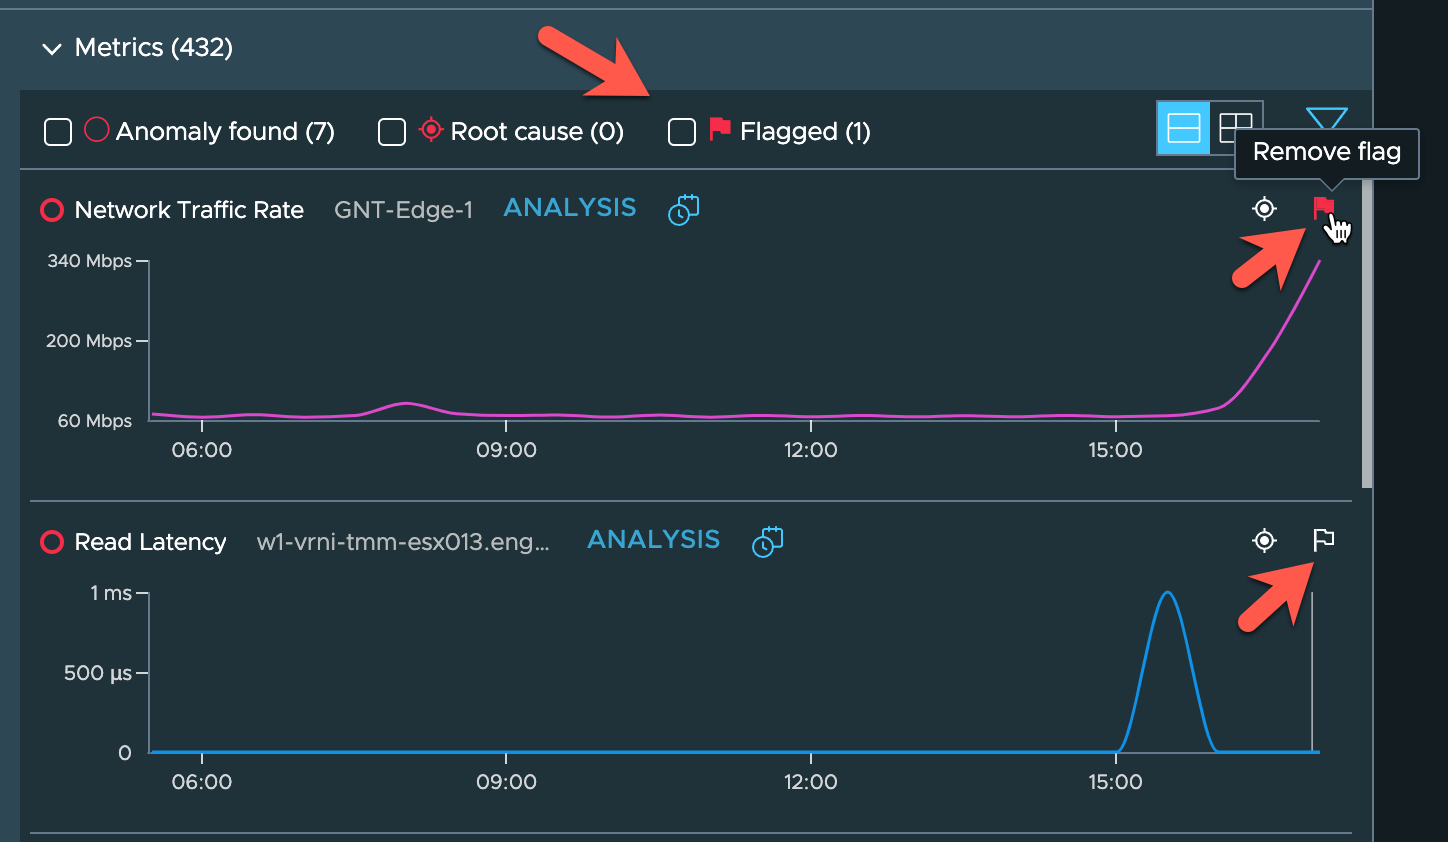
Flagging Metrics
It’s also possible to flag metrics that you find interesting or are possibly a part of the problem. These flags are stored within the troubleshooting session and your colleagues will see them as well. Click the flag icon to flag or unflag the metric charts. Filter on them to see only the flagged metrics to get quicker to the anomalies that your colleagues marked as interesting.
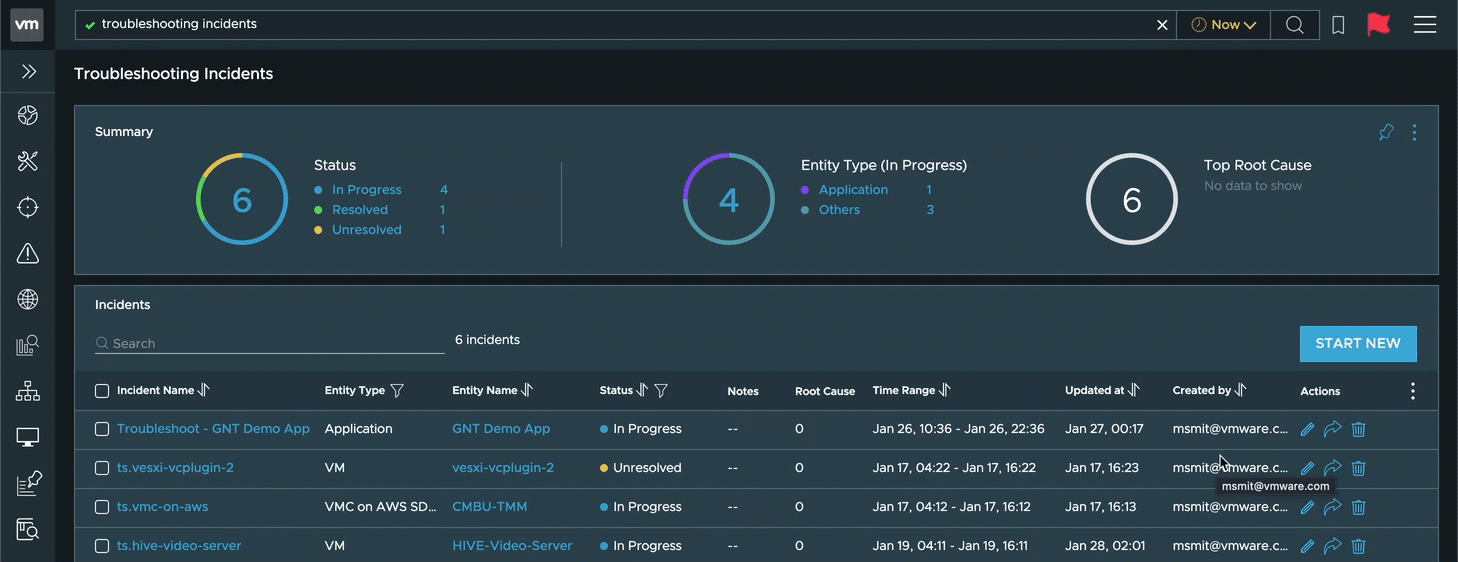
Sharing Troubleshooting Incidents
All troubleshooting sessions are publicly accessible for all that can access vRealize Network Insight to make it easy to collaborate with your peers. There’s also a button on each session to access the right link quickly:
Closing Incidents
After finding the root cause of an incident, you can close the troubleshooting session and mark it as Resolved and add remarks about what the problem was and how you fixed it. These remarks show up in any future troubleshooting sessions on the same object (VMs, Application, etc.) and it’s a huge time saver to know about any previous incidents and what their solution was. Maybe it’s the same problem again, and you have the solution right there!
Figure 9 – Closing a Troubleshooting SessionThere’s also an option to mark it as Unresolved. Perhaps the problem went away on its own, without any proper explanation and without having any impact anymore. That’s why the unresolved option is there, to mark a session closed, but knowing that there wasn’t a fix applied. You can again use the remarks field to explain why it’s been marked as unresolved.
Conclusion
Guided Network Troubleshooting is poised to save you a bunch of time on troubleshooting network issues by doing a ton of the heavy lifting. We’re very excited about the amount of time it’ll save our customers.
If you are a vRealize Network Insight Cloud customer, Guided Network Troubleshooting is already available in your instance! If you are not yet a customer, check out our 30-day free trial of vRealize Network Insight Cloud.
Related Posts:
 Low-Cost Migrations to VMWare Cloud on AWS with…
Martijn Smit
Martijn is a proud Dutchman (stroopwafels!) and has spent around 15 years as an IT professional, mostly focused on network operations. He has been with VMware for 3 years. He…
Recommend
About Joyk
Aggregate valuable and interesting links.
Joyk means Joy of geeK