
4

使用Matplotlib轻松绘制股票K线图
source link: https://zmister.com/archives/38.html
Go to the source link to view the article. You can view the picture content, updated content and better typesetting reading experience. If the link is broken, please click the button below to view the snapshot at that time.
K线图是看懂股票走势的最基本知识,K线分为阴线和阳线,阴线和阳线都包含了最低价、开盘价、最高价和收盘价,一般的K线如下图所示:
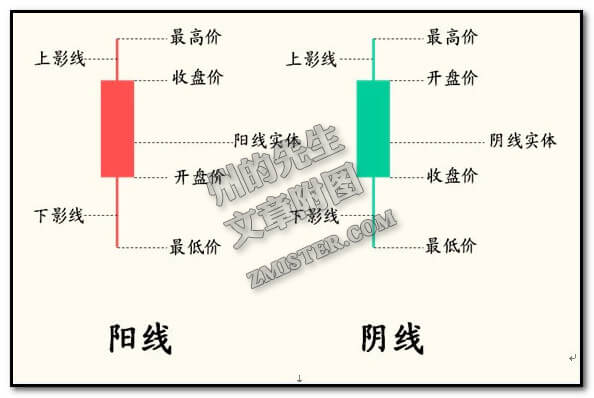
度娘说:K线图源于日本德川幕府时代(1603~1867年),被当时日本米市的商人用来记录米市的行情与价格波动,后因其细腻独到的标画方式而被引入到股市及期货市场。通过K线图,我们能够把每日或某一周期的市况现完全记录下来,股价经过一段时间的盘档后,在图上即形成一种特殊区域或形态,不同的形态显示出不同意义。
在使用Python进行股票分析的过程中,我们可以很容易的对K线图进行绘制,下面介绍两种情形下的K线图绘制:
一、股票数据来源于Matplotlib
# 导入需要的库
import tushare as ts
import matplotlib.pyplot as plt
import matplotlib.finance as mpf
%matplotlib inline
# 设置历史数据区间
date1 = (2014, 12, 1) # 起始日期,格式:(年,月,日)元组
date2 = (2016, 12, 1) # 结束日期,格式:(年,月,日)元组
# 从雅虎财经中获取股票代码601558的历史行情
quotes = mpf.quotes_historical_yahoo_ohlc('601558.ss', date1, date2)
# 创建一个子图
fig, ax = plt.subplots(facecolor=(0.5, 0.5, 0.5))
fig.subplots_adjust(bottom=0.2)
# 设置X轴刻度为日期时间
ax.xaxis_date()
# X轴刻度文字倾斜45度
plt.xticks(rotation=45)
plt.title("股票代码:601558两年K线图")
plt.xlabel("时间")
plt.ylabel("股价(元)")
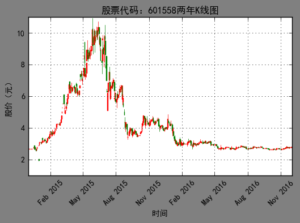
mpf.candlestick_ohlc(ax,quotes,width=1.2,colorup='r',colordown='green')
plt.grid(True)
绘制出来的K线图如下:
二、股票数据来源于Tushare
因为从Tushare中获取到的数据为Pandas的DataFrame结构,需要将其转换为matplotlib.finance.candlestick_ohlc()方法能够处理的数据结构。
from matplotlib.pylab import date2num
import datetime
# 对tushare获取到的数据转换成candlestick_ohlc()方法可读取的格式
data_list = []
for dates,row in hist_data.iterrows():
# 将时间转换为数字
date_time = datetime.datetime.strptime(dates,'%Y-%m-%d')
t = date2num(date_time)
open,high,low,close = row[:4]
datas = (t,open,high,low,close)
data_list.append(datas)
# 创建子图
fig, ax = plt.subplots()
fig.subplots_adjust(bottom=0.2)
# 设置X轴刻度为日期时间
ax.xaxis_date()
plt.xticks(rotation=45)
plt.yticks()
plt.title("股票代码:601558两年K线图")
plt.xlabel("时间")
plt.ylabel("股价(元)")
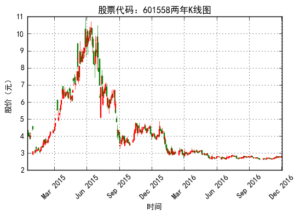
mpf.candlestick_ohlc(ax,data_list,width=1.5,colorup='r',colordown='green')
plt.grid()
同样也能绘制会一样的K线图:
嗯,是不是很简单?
Recommend
About Joyk
Aggregate valuable and interesting links.
Joyk means Joy of geeK