

How To Use OpenTelemetry With AWS Lambda - DZone Cloud
source link: https://dzone.com/articles/how-to-use-opentelemetry-with-aws-lambda
Go to the source link to view the article. You can view the picture content, updated content and better typesetting reading experience. If the link is broken, please click the button below to view the snapshot at that time.
How to Use OpenTelemetry With AWS Lambda
In this guide, you will learn exactly how to deploy a tracing-enabled lambda with OpenTelemetry
Join the DZone community and get the full member experience.
Join For FreeLambda is the AWS solution for serverless functions.
OpenTelemetry is an open-source meant to create traces and send them to a backend and gain visibility.
The observability-aware developer which has serverless lambdas as part of his stack will surely tackle the need to connect OpenTelemetry with lambda.
If you are such a developer, this guide is for you.
Today, I’ll show you exactly how to deploy a tracing-enabled lambda with OpenTelemetry.
This article is part of the Aspecto Hello World series, where we tackle distributed services-related topics for you. Our team searches the web for common issues, then we solve them ourselves and bring you complete how-to guides. Aspecto is an OpenTelemetry-based distributed tracing platform for developers and teams of distributed applications.
The Setup
Create a new directory for your project, and add the following package.json (or this packages to your existing project):
{
 "name": "lambda-otel-post",
 "version": "1.0.0",
 "description": "",
 "main": "handler.js",
 "dependencies": {
   "@opentelemetry/api": "1.0.2",
   "@opentelemetry/instrumentation": "0.25.0",
   "@opentelemetry/auto-instrumentations-node": "0.25.0",
   "@opentelemetry/instrumentation-aws-lambda": "0.25.0",
   "@opentelemetry/instrumentation-http": "0.25.0",
   "@opentelemetry/sdk-trace-base": "0.25.0",
   "@opentelemetry/sdk-trace-node": "0.25.0",
   "axios": "^0.24.0"
 },
 "devDependencies": {},
 "scripts": {
   "test": "echo \"Error: no test specified\" && exit 1"
 },
 "author": "",
 "license": "ISC"
}
Run installs:
npm installAdd the handler.js
This code is a simple lambda entry point that contains a call to an external API and returns a message.
Later on, we will want to make sure that a span has been created for this HTTP call, and also for the actual lambda invocation.
'use strict';

const axios = require("axios");

module.exports.hello = async (event) => {
 const todoItem = await axios('https://jsonplaceholder.typicode.com/todos/1');

 return {
   statusCode: 200,
   body: JSON.stringify(
     {
       message: 'Some Message Here',
       input: event,
     },
     null,
     2
   ),
 };

 // Use this code if you don't use the http event with the LAMBDA-PROXY integration
 // return { message: 'Go Serverless v1.0! Your function executed successfully!', event };
};
Add the Lambda Wrapper File That Enables Tracing With OpenTelemetry
Let’s add the following lambda-wrapper.js file:
const { SimpleSpanProcessor, ConsoleSpanExporter } = require("@opentelemetry/sdk-trace-base");
const { NodeTracerProvider } = require('@opentelemetry/sdk-trace-node');
const { AwsLambdaInstrumentation } = require('@opentelemetry/instrumentation-aws-lambda');
const { registerInstrumentations } = require('@opentelemetry/instrumentation');
const { getNodeAutoInstrumentations } = require("@opentelemetry/auto-instrumentations-node");

const provider = new NodeTracerProvider();
provider.addSpanProcessor(new SimpleSpanProcessor(new ConsoleSpanExporter()))
provider.register();

registerInstrumentations({
 instrumentations: [
   getNodeAutoInstrumentations(),
   new AwsLambdaInstrumentation({
     disableAwsContextPropagation: true
   })
 ],
});
Notice I am using ConsoleSpanExporter, which writes all the telemetry data to the console.
In production, you would probably want to have this sent to some other tool like Jaeger or an observability vendor.
For this blog post, however, this exporter will do.
A note on disableAwsContextPropagation
Another thing you’re probably wondering is why I added disableAwsContextPropagation:true.
The reason for this is the lambda instrumentation is trying to use the X-Ray context headers by default (even when we’re not using X-Ray), causing us to have a non-sampled context and a NonRecordingSpan.
To fix this, we use the disableAwsContextPropagation flag.
More information about this can be found here and in the instrumentation docs.
Deploy The Lambda
There are various ways of deploying lambda to S3 and this is not the scope of the tutorial.
I chose to use a serverless framework, but you can also use AWS CLI / other forms to do this.
If you use serverless, this is the serverless.yml file.
Do not forget to set the correct region & function name.
service: lambda-otel-post

# You can pin your service to only deploy with a specific Serverless version
# Check out our docs for more details
frameworkVersion: '2'

provider:
 name: aws
 runtime: nodejs12.x
 lambdaHashingVersion: 20201221
 environment:
   NODE_OPTIONS: --require lambda-wrapper


 region: eu-west-2

functions:
 tom-otel-lambda-post:
   handler: handler.hello
Add Environment Variable
For the tracing code to run, we need to make sure Node requires it before any other file has been required.
That’s why we need to add this value for the NODE_OPTIONS environment variable: “–require lambda-wrapper”.
If you use serverless with the file above, it is done for you automatically.
If not, head to the configuration section of the deployed lambda and set it:
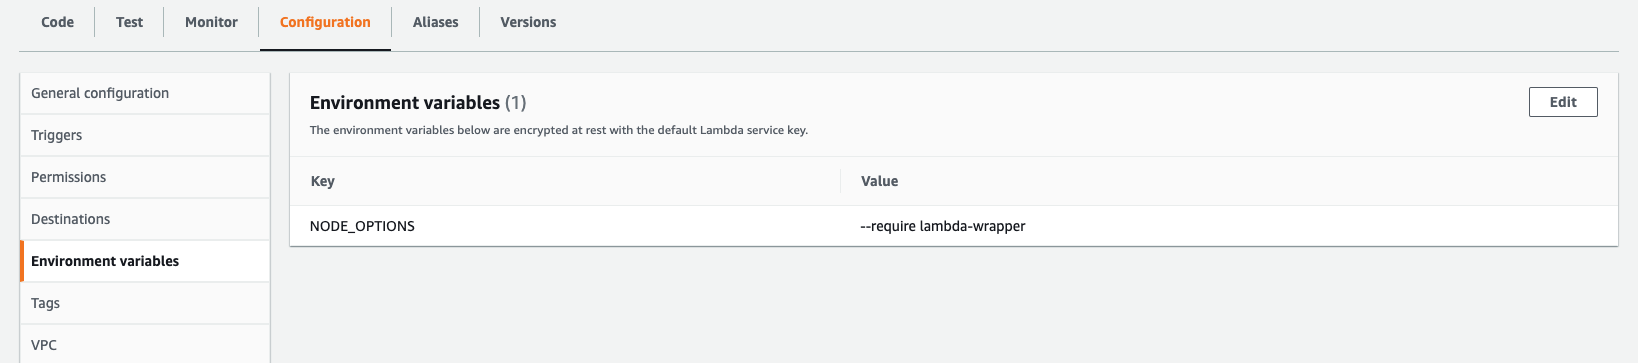
The reason for this necessity is that the wrapper file must be included before any other file for the OpenTelemetry instrumentations to work properly.
Calling the Lambda Function
Now when you run your lambda(I used the built-in AWS console’s test utility), you should expect to see 2 spans being created – one for the lambda invocation, and the other for the outgoing HTTP call.
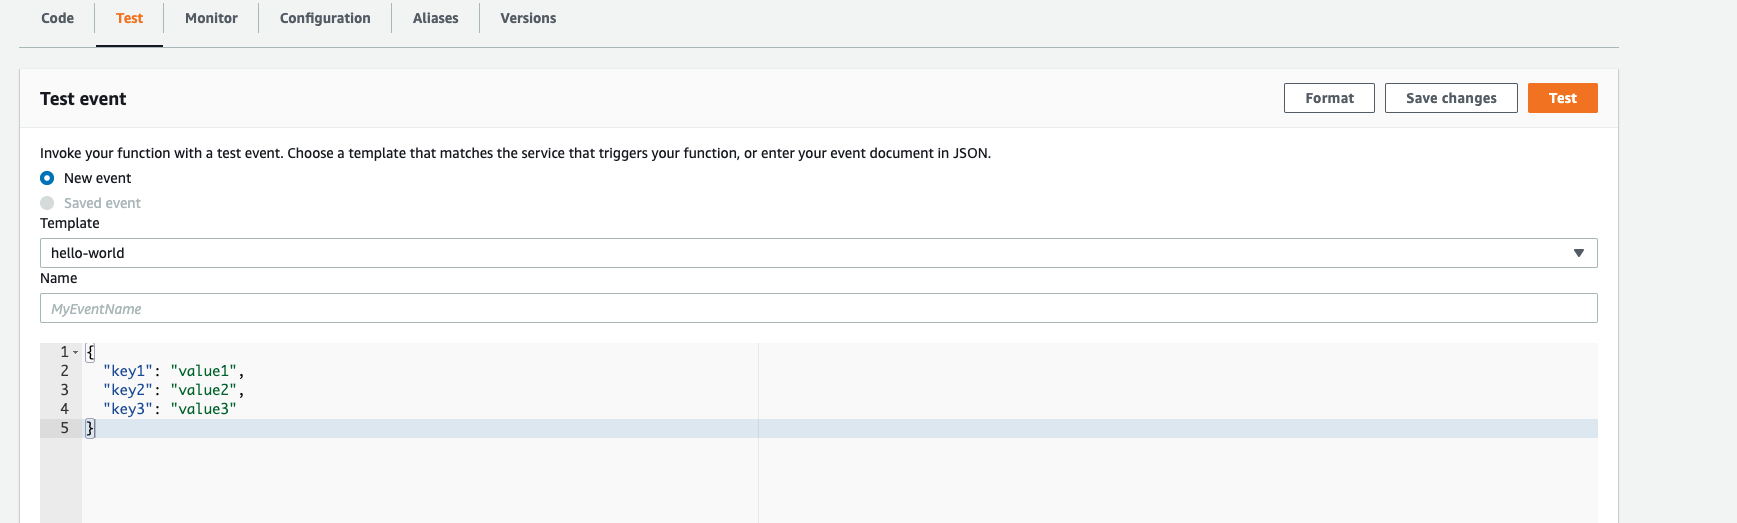
The AWS console UI for invoking the lambda function
Indeed, that’s what we get:
This Is the Outgoing HTTP span
{
  traceId: '4f373b61315c23fa47605a72b94ab59e',
  parentId: '7ce4ab2283755eda',
  name: 'HTTPS GET',
  id: '54c07955525dad7f',
  kind: 2,
  timestamp: 1635332193754154,
  duration: 82864,
  attributes: {
    'http.url': 'https://jsonplaceholder.typicode.com/todos/1',
    'http.method': 'GET',
    'http.target': '/todos/1',
    'net.peer.name': 'jsonplaceholder.typicode.com',
    'net.peer.ip': '104.21.4.48',
    'net.peer.port': 443,
    'http.host': 'jsonplaceholder.typicode.com:443',
    'http.response_content_length_uncompressed': 83,
    'http.status_code': 200,
    'http.status_text': 'OK',
    'http.flavor': '1.1',
    'net.transport': 'ip_tcp'
  },
  status: { code: 1 },
  events: []
}
And the lambda invocation span:
{
  traceId: '4f373b61315c23fa47605a72b94ab59e',
  parentId: undefined,
  name: 'lambda-otel-post-dev-tom-otel-lambda-post',
  id: '7ce4ab2283755eda',
  kind: 1,
  timestamp: 1635332193747990,
  duration: 93019,
  attributes: {
    'faas.execution': 'ed075caa-4d54-44f8-96b4-b96085acbf9a',
    'faas.id': 'arn:aws:lambda:eu-west-2:MY-AWS-ID:function:lambda-otel-post-dev-tom-otel-lambda-post',
    'cloud.account.id': 'MY-AWS-ID'
  },
  status: { code: 0 },
  events: []
}
That would be it for today folks, you can now export those spans to wherever you like.
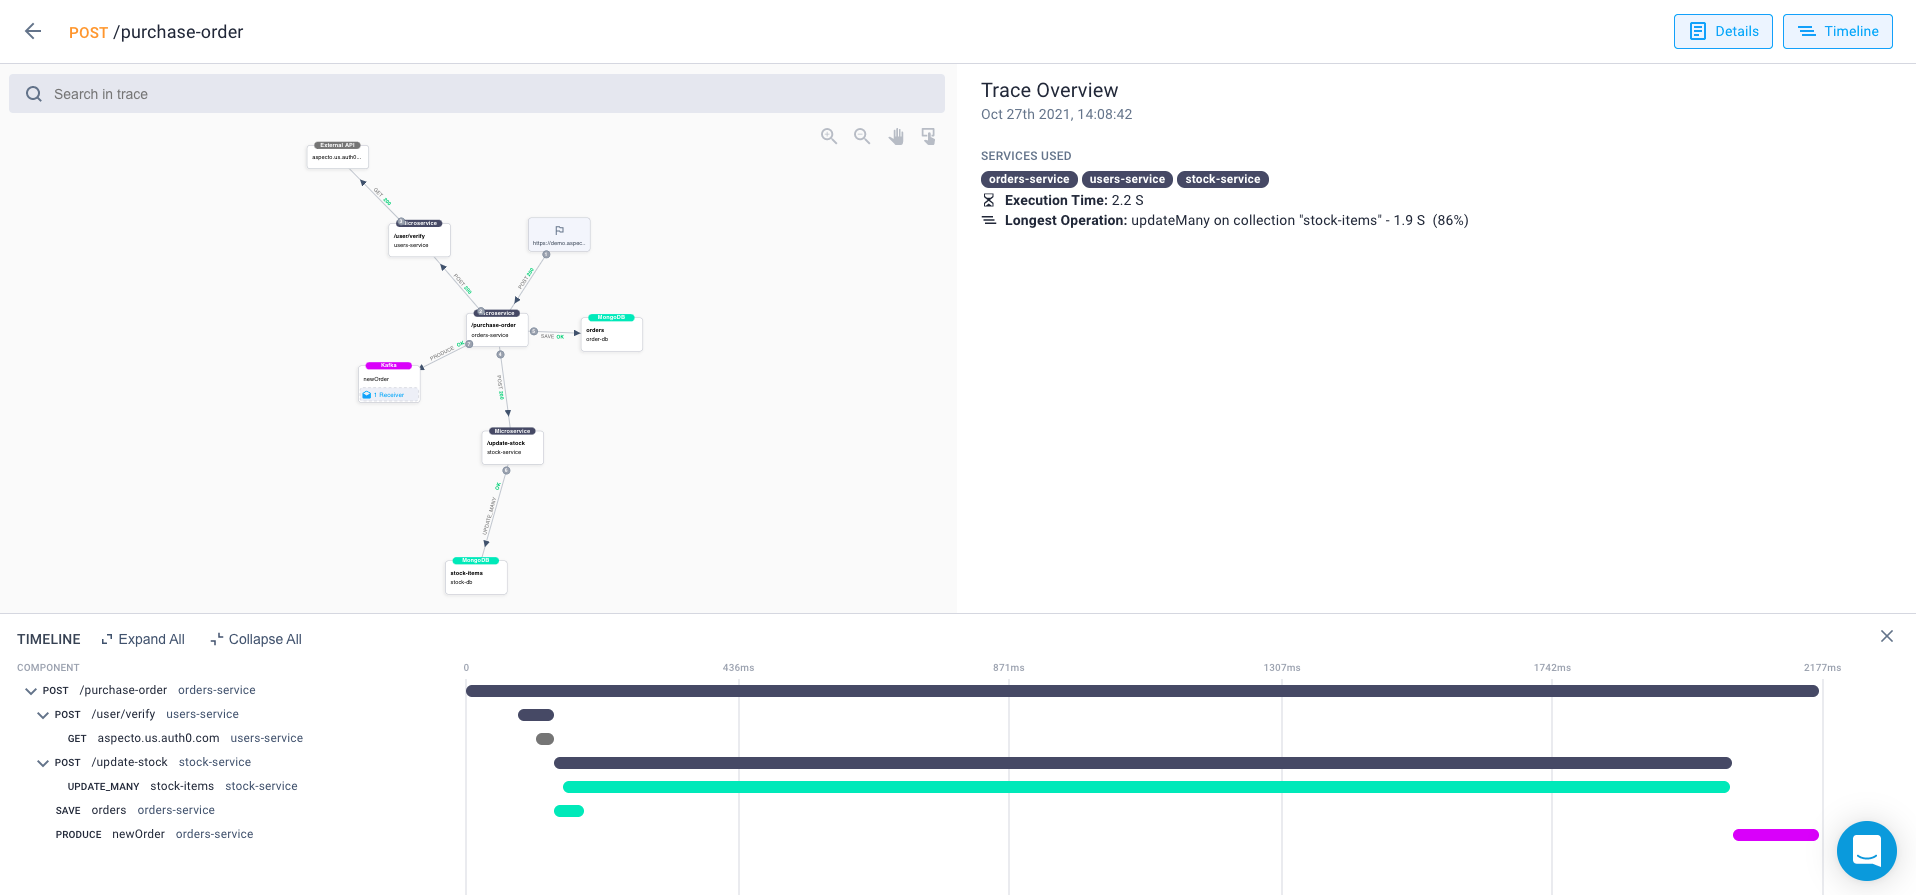
P.S. If you don’t have an easy way of visualizing these traces just yet, feel free to check out Aspecto (it’s free). This is what a single trace would look like:
Recommend
About Joyk
Aggregate valuable and interesting links.
Joyk means Joy of geeK