

btop - the htop alternative
source link: https://haydenjames.io/btop-the-htop-alternative/
Go to the source link to view the article. You can view the picture content, updated content and better typesetting reading experience. If the link is broken, please click the button below to view the snapshot at that time.

Meet btop, an aesthetically pleasing system resource monitor showing usage and stats for processor, memory, disks, network, and processes. btop is the lighter and faster C++ version and continuation of bashtop and bpytop.
Over the years, the available options for command-line system monitoring tools have grown quite a bit. There is top, htop, glances, nmon, ytop, gtop, vtop, and atop, to name a few.
When it comes to Linux administration, monitoring your system’s performance and use of hardware resources in real-time is very important. Especially for production server environments.
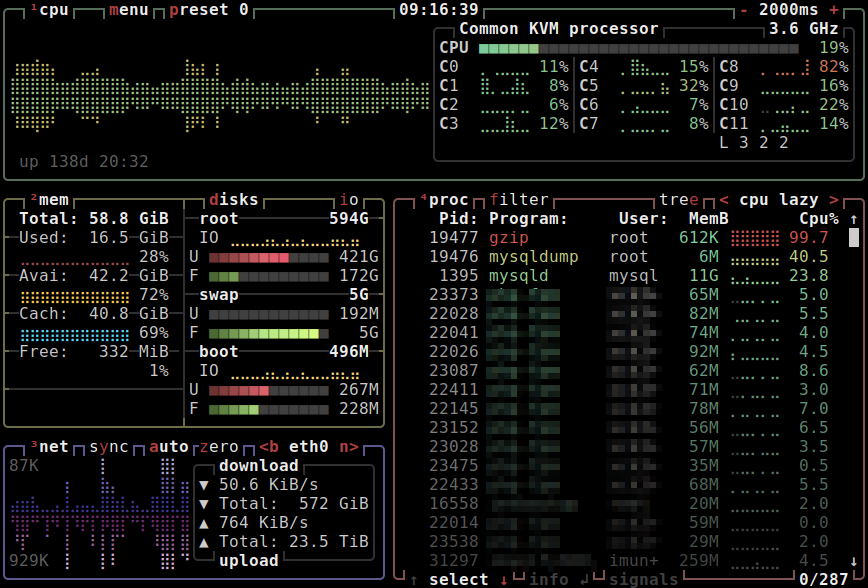
btop – displaying real-time usage and stats for processor, memory, storage, network, and processes.
Using btop to monitor system resources
As soon as you launch btop, you’ll notice it’s straightforward to use. The UI is controlled using this shortlist of keyboard shortcuts:
(Esc, m) - Shows the main menu.
(F2, o) - Shows options.
(F1, h) - Shows the help screen.
(Ctrl-C, q) - Quits the program.
(+, -) - Add/Subtract 100ms to/from update timer.
(Up arrow) (Down arrow) - Select in the process list.
(Enter) - Show detailed information for the selected process.
(Pg Up) (Pg Down) - Jump 1 page in the process list.
(Home) (End) - Jump to the first or the last page in the process list.
(Left) (Right) - Select previous/next sorting column.
(b, n) - Select previous/next network device.
(e) - Toggle processes tree view.
(r) - Reverse sorting order in processes box.
(f, /) - Input a string to filter processes with.
Use the help menu for even more keyboard shortcuts.
With btop, you can quickly view detailed stats for processes, easily switch between sorting options, send SIGTERM, SIGKILL, SIGINT to a selected process, view current read and write speeds for your storage devices, and much more:
btop – filtering ‘newrelic’ processes/threads
btop features
- An easy-to-use and esthetically pleasing user interface that features a beautiful system-stats overview.
- Full mouse support, all buttons with a highlighted key are clickable and mouse scroll works in process list and menu boxes.
- Fast and responsive UI with UP, DOWN keys process selection.
- Function for showing detailed stats for the selected process.
- Ability to filter processes.
- Easy switching between sorting options.
- Tree view of processes.
- Send any signal to the selected process.
- UI menu for changing all config file options.
- Auto-scaling graph for network usage.
- Shows IO activity and speeds for disks
- Battery meter
- Selectable symbols for the graphs
- Custom presets
- Available in a growing list of official repos of recent distros. For example, Manjaro install =
pacman -S btop. - Also compatible with Mac and FreeBSD.
- Uses less CPU and RAM compared to bashtop and bpytop.
Conclusion
In a mission-critical setting, top, htop, and atop are still time-proven system resource monitoring and troubleshooting solutions along with other useful tools such as net-tools, iptraf, collectl, dstat, iostat, iotop, sar, saidar and vmstat. Also, read my list of 90 Linux Commands frequently used by Linux Sysadmins.
Command-line system monitors will often give you quick insight into what process(es) are the culprit for poor application performance. It’s an excellent place to start.
However, if you are serious about application performance, you’ll want to set up application performance monitoring (APM). APM and even broader observability provide a deeper and more detailed view of your code’s effect on resources as well as insight into the end user’s experience with your application.
Observability empowers you with the data necessary to decide whether to optimize code or to upgrade hardware. With this in mind, I maintain a list of over 100 observability solutions that will interest you if you run or plan to run apps in production. Also, read Observability in 5 minutes. Plus, the best 20 observability software vendors
I’ve been using btop on my laptop and a few servers when I need to share easy-to-read memory, CPU, or process stats. If you haven’t already, give it a try!
Recommend
-
101
-
69
top作为日常管理工作中最常用也是最重要的Linux系统监控工具之一,可以动态观察系统进程状况。但其缺点就是只支持键盘操作,显示也单调。现在我们有了一个更好的选择那就是htop。 推荐使用htop代替top 更新历史 ...
-
71
When developing a piece of software or monitoring a running system both telemetry and context are important. After one understands what is normal behaviour in a historical context the two most pressing questions are often...
-
81
NVTOP What is NVTOP? Nvtop stands for NVidia TOP, a (h)top like task monitor for NVIDIA GPUs. It can handle multiple GPUs and print information about them in a htop familiar way. Because a p...
-
54
Tweak htop config to better suit Sysadmins. Included is a copy of my htop config file. Added detailed CPU usage line, hid userland process threads and more.
-
83
在开发软件或监控运行的系统时,遥测和环境监测都很重要。在理解了历史情境下什么是正常行为之后,通常两个最紧迫的问题是:(1)什么发生了变化?(2)什么表现出异常? 本文将介绍三个用于临时监控的流行工具,以及一种用于监...
-
13
Index Under development 18 September 2021 The Linux version of btop++ is complete. Released as version 1.0.0 I will be providing statically compiled binaries for a range of architectures in every release fo...
-
4
Linux下的资源监控器:btop资源监视器,显示处理器、内存、磁盘、网络和进程的使用情况和统计信息。btop++的Linux版本就完成了。作为版本 1.0.0 发布,编译需要 GCC 10,首选 GCC 11。易于使用,具有游戏灵感的菜单系统。 完全支...
-
3
认识btop,一个美观的系统资源监视器,显示处理器、内存、磁盘、网络和进程的使用情况和统计信息。btop是更轻、更快的C++ 版本,是bashtop和bpytop的延续。多年来,命令行系统监控工具的可用选项已经增加了不少。有top、htop、
-
35
<?xml encoding="utf-8" ??>Introduction This tutorial explains how to install btop on Ubuntu 20.04. btop (also known as btop++) is a customizable command-line utility for resource monitor...
About Joyk
Aggregate valuable and interesting links.
Joyk means Joy of geeK