
7

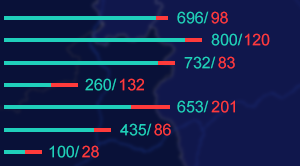
echarts 图标使用横向堆叠柱状图,要展示两个数据在最后边,数据的位置不好设置
source link: https://www.oschina.net/question/5476698_2324279
Go to the source link to view the article. You can view the picture content, updated content and better typesetting reading experience. If the link is broken, please click the button below to view the snapshot at that time.
echarts 图标使用横向堆叠柱状图,要展示两个数据在最后边,数据的位置不好设置
osc_18169729 发布于 前天 16:31
使用echarts图表,要堆叠柱状图,并且在后面展示两个数据并且有不同的颜色,开始使用的是serie的lable展示的,数据展示跟颜色不同都实现了但是位置没有实现,又使用了padding,因为他们的数据不同,位置也不一样,有的差的很远,有的重叠,到现在都没有解决。
下面是两张设计图

Recommend
About Joyk
Aggregate valuable and interesting links.
Joyk means Joy of geeK