

How to unlock design insights faster by mapping ideas: Examples and methods
source link: https://uxdesign.cc/how-to-unlock-design-insights-faster-by-mapping-ideas-examples-and-methods-2c043c3cf52c
Go to the source link to view the article. You can view the picture content, updated content and better typesetting reading experience. If the link is broken, please click the button below to view the snapshot at that time.
How to unlock design insights faster by mapping ideas: Examples and methods
The power of mapping ideas for creative problem solving
One of the most significant changes I made to my facilitation and project work was creating a physical space for design projects and mapping ideas. Over the years, I have called this space a bunker, war room, or even a project nest.
It is a decisive shift to surround yourself with your progress and get your ideas out of your head. This article explores the benefits of mapping ideas in your projects, planning and design work.
The final part of the article outlines seven different examples of how I have used mapping activities in my design partnerships, with examples and photos.
Grab a sharpie and an index card, and you are ready to jump in!
Why Mapping Ideas Works
Jon Kolko’s perspective on the creation of meaning shaped my understanding of this. In any of your projects, you aim to make meaning, surface insight, develop ideas and solve problems. Kolko talks about the process of thinking that a designer experiences:
One of the most basic principles of making meaning out of data is to externalise the entire meaning-creation process. ~ Jon Kolko
Instead of keeping the information we have gathered on computers or in our heads, we need to post up the pieces of data in a shared space.
Posting up our data helps us co-create a shared understanding of the problems we are working with. By mapping out a problem, we can begin to start an actual conversation about it.
You see, your brain stores everything you have ever experienced — mapping ideas work because it externalises all that information and provides a visual space to bring those experiences together.
Mapping is a spatial process, and mapping problems can help us visually understand them. This allows us the opportunity to view the situation from multiple perspectives and unlock new insight.
Compare these two scenarios.
[A] Responses to your parent or customer survey start to roll in, and they populate a spreadsheet you have set up. You might use AI-assisted analysis tools to understand the responses better. You create charts and graphs for slides and reports and set up meetings to discuss the results.[B] Responses to your parent or customer survey start to roll in, and you write each valuable piece of data on a card and post it up to a wall or whiteboard. Your team ask questions about what they see. People from outside the team also engage with the ideas. Your perspective shifts from row by row, cell by cell, to the whole wall space of the complete dataset. You move and sort cards and start to talk about patterns and themes that emerge.
What do you notice about the difference between A and B?
Despite scenario A which seems like a faster and more efficient process, it is less effective. Scenario B turns your thinking inside out and allows you to see the information in a whole new way. It will enable you to make connections and unlock insights that weren’t immediately evident in your spreadsheet.
Physical ideas are easier to manipulate and discuss
We free the data from the bonds of a computer or our limited memory. Now it gets to move and roam and connect to other pieces of data.
To solve a complex design problem, you need to track lots of moving parts. As humans, our short-term memory is not all that good–but our spatial memory is awesome. Plaster a room with notes, and you take advantage of that spatial memory. You begin to know where information is, which extends your ability to remember things. ~ Jake Knapp
Once you have found a space for your ideas, get started. Gather some resources, pens, post-it notes and index cards. Start posting up the pieces of information you have gathered.
A key to this approach is only to post one idea or piece of data on one card or post-it note. You want to be able to move the pieces around, not read from a lengthy bulleted list.
10 Benefits of Mapping Ideas
- The thinking process is visible.
- Encourage reflective practice.
- Improve planning and strategy
- Clear communication that breaks down silos between departments or teams.
- Help align around shared understanding about what problems exist in your project at different levels (micro, meso, macro and mundo) within an organisation.
- Facilitates dialogue and conversations about problems we are working with (sharable understanding).
- Allows for shared perspective and insight (and helps us see it in one place).
- Opens up the possibilities in our thinking.
- Uncovers hidden problems that we were not aware of before mapping (uncovering insights).
- Enables connections between different problems and ideas. It is easier to connect when we can see the whole map!
OK, I think I have made a case for mapping ideas, so where do we start?
In the next section, we will look at some activities, tools and tips for mapping ideas.
Mapping Activities for Your Next Workshop
We map ideas, data, or experiences to deepen our thinking, understand the problem space, and share the journey with others.
There are many mapping activities that you can use in your design work to get your team mapping ideas today.
Here are some mapping activities to use during your design and development work. Each of these methods benefits from being mapped in the physical space.
Empathy mapping ⟶
Empathy mapping is a core routine for any design thinking process. Focus on a person involved with your design, map their experience. What do they say, see, do, hear, think and feel? Use that data to increase your understanding.
Affinity mapping ⟶
Collect responses to a question or provocation. Post up in your space, and the team works to identify responses with affinity. These are loosely grouped and sorted. Affinity mapping helps to identify abstracted themes from a vast pool of answers.
Actor mapping ⟶
Create a spatial representation of the people involved in your project. Actor mapping is a powerful way to identify who is at the heart of the work and map the broader system.
Journey mapping ⟶
From service design, this map charts an experience over time. I have done this to design the timetable for a school. Record the highs and lows of the day, the pains and gains over time. Journey mapping can be used in more detail to create experience maps.
Experience mapping ⟶
Recall a recent experience of yours. Where were you? What part of the day was it? Can you remember what happened next? Experience mapping is a powerful way to map out thoughts, feelings and actions of an experience or event. It helps map stressful points and joyful points, which leads to better empathy with users.
Question mapping ⟶
This activity lists a range of questions you have and explores the connections between them or how we can group them. Describe a problem you are mapping in your project. What questions do you want to answer about the topic? Make them into cards and post them in the physical space. This might also be useful for exploring client questions generated from feedback sessions.
Venn mapping ⟶
Map out three or more spaces with an overlapping middle section. Use these maps when mapping concepts that overlap somehow be it through time, components or attributes. Venn mapping helps identify similarities and differences between ideas.
Mind mapping ⟶
The scenario map below is one of my favourite methods at the moment. It focuses on an idea by creating a central concept surrounded by related topics on branches around it. This forces the creation of new ideas that might not have been there before.
Impact v Effort mapping ⟶
Once you have a range of ideas recorded on cards, you can use the Impact v Effort mapping method to sort your thoughts into potential impact and effort. I also find this works well for a review or audit of project initiatives.
Insight mapping ⟶
Mapping for insight typically follows a three-step pattern: Ask a question and record your first response; challenge the assumptions and generate more possibilities; find patterns in those ideas. This is great if you have one big idea you want to explore.
Hexagonal mapping ⟶
For hexagonal mapping, record each piece of data, idea or insight on a hexagon. Once you have recorded all the statements, you can link them to see themes and patterns emerge. The hexagon is an ideal shape for mapping as it is a simple shape to draw and tesselates.
2 x 2 mapping ⟶
Every concept gets made into a 2 x 2 table with four quadrants! 2 x 2 is still a helpful mapping activity that allows some comparison and exploration of how factors of your design work connect. Think about the points of intersection between the ideas
When mapping activities, the style of mapping can also help you to focus on what you are trying to learn from the mapping activity. There are five types of mapping styles: point, area, line, face and path. Each one has a distinct purpose.For example, mapping to explore relationships between elements is a point mapping activity. These maps work well when you want to find patterns and connections between related items in some way.
Mapping Ideas In Practice
I have worked on projects where mapping ideas has been the most effective way to work through problems. Here are some examples:
1 A project with Adelaide Botanic High School — one of the newest schools in Australia — mapping ideas about the school’s identity before they opened.

The affinity mapping activity helped us post up a range of ideas from the participants and then see how all the ideas linked and connected. From here, the team identified common themes like: “Journey”, “More than just content”, and “Same page”.
2 A design thinking project with the Cheshire School — a specialist school in Melbourne — and Monash Health.

Participants used the actor mapping activity to understand better who was at the heart of the design challenge of supporting early years teachers. We wanted to identify key stakeholders and understand where their pressures came from. This mapping activity also helped us zoom out and see how we connected to a more extensive system or ecosystem.
3 A project guiding the development of a new teaching and learning framework at Methodist Ladies College in Sydney.

We used the hexagonal mapping activity to map out the connections and links between learning concepts we believed necessary. We did this in small groups to get some points of comparison — the same starting point, different outcome. The resulting maps allowed us to see areas that might require further insight before committing time and investment to develop any initiatives based on this work.
4 A project with a school in Melbourne to explore the design of learning within Year 9.

The journey mapping activity helped us establish a clear timeline and then create a rich picture of the school day. We were able to place actions in time — morning, lunch, afternoons etc. — and link them with the flow of kids moving through the school. From here, we could identify gaps in provision, highlight quick wins and start mapping out the highs and lows of the experience in more detail.
5 A project with a primary school in Adelaide in which we designed their approach to collaborative learning walks.

The empathy mapping activity helped us start the design process with a shared understanding of what teachers experience during observations. You can see the updated Gamestorming template in use in the screenshot from the project. This enabled us to surface some key pitfalls and issues we wanted to avoid as we redesigned this learning process for teachers.
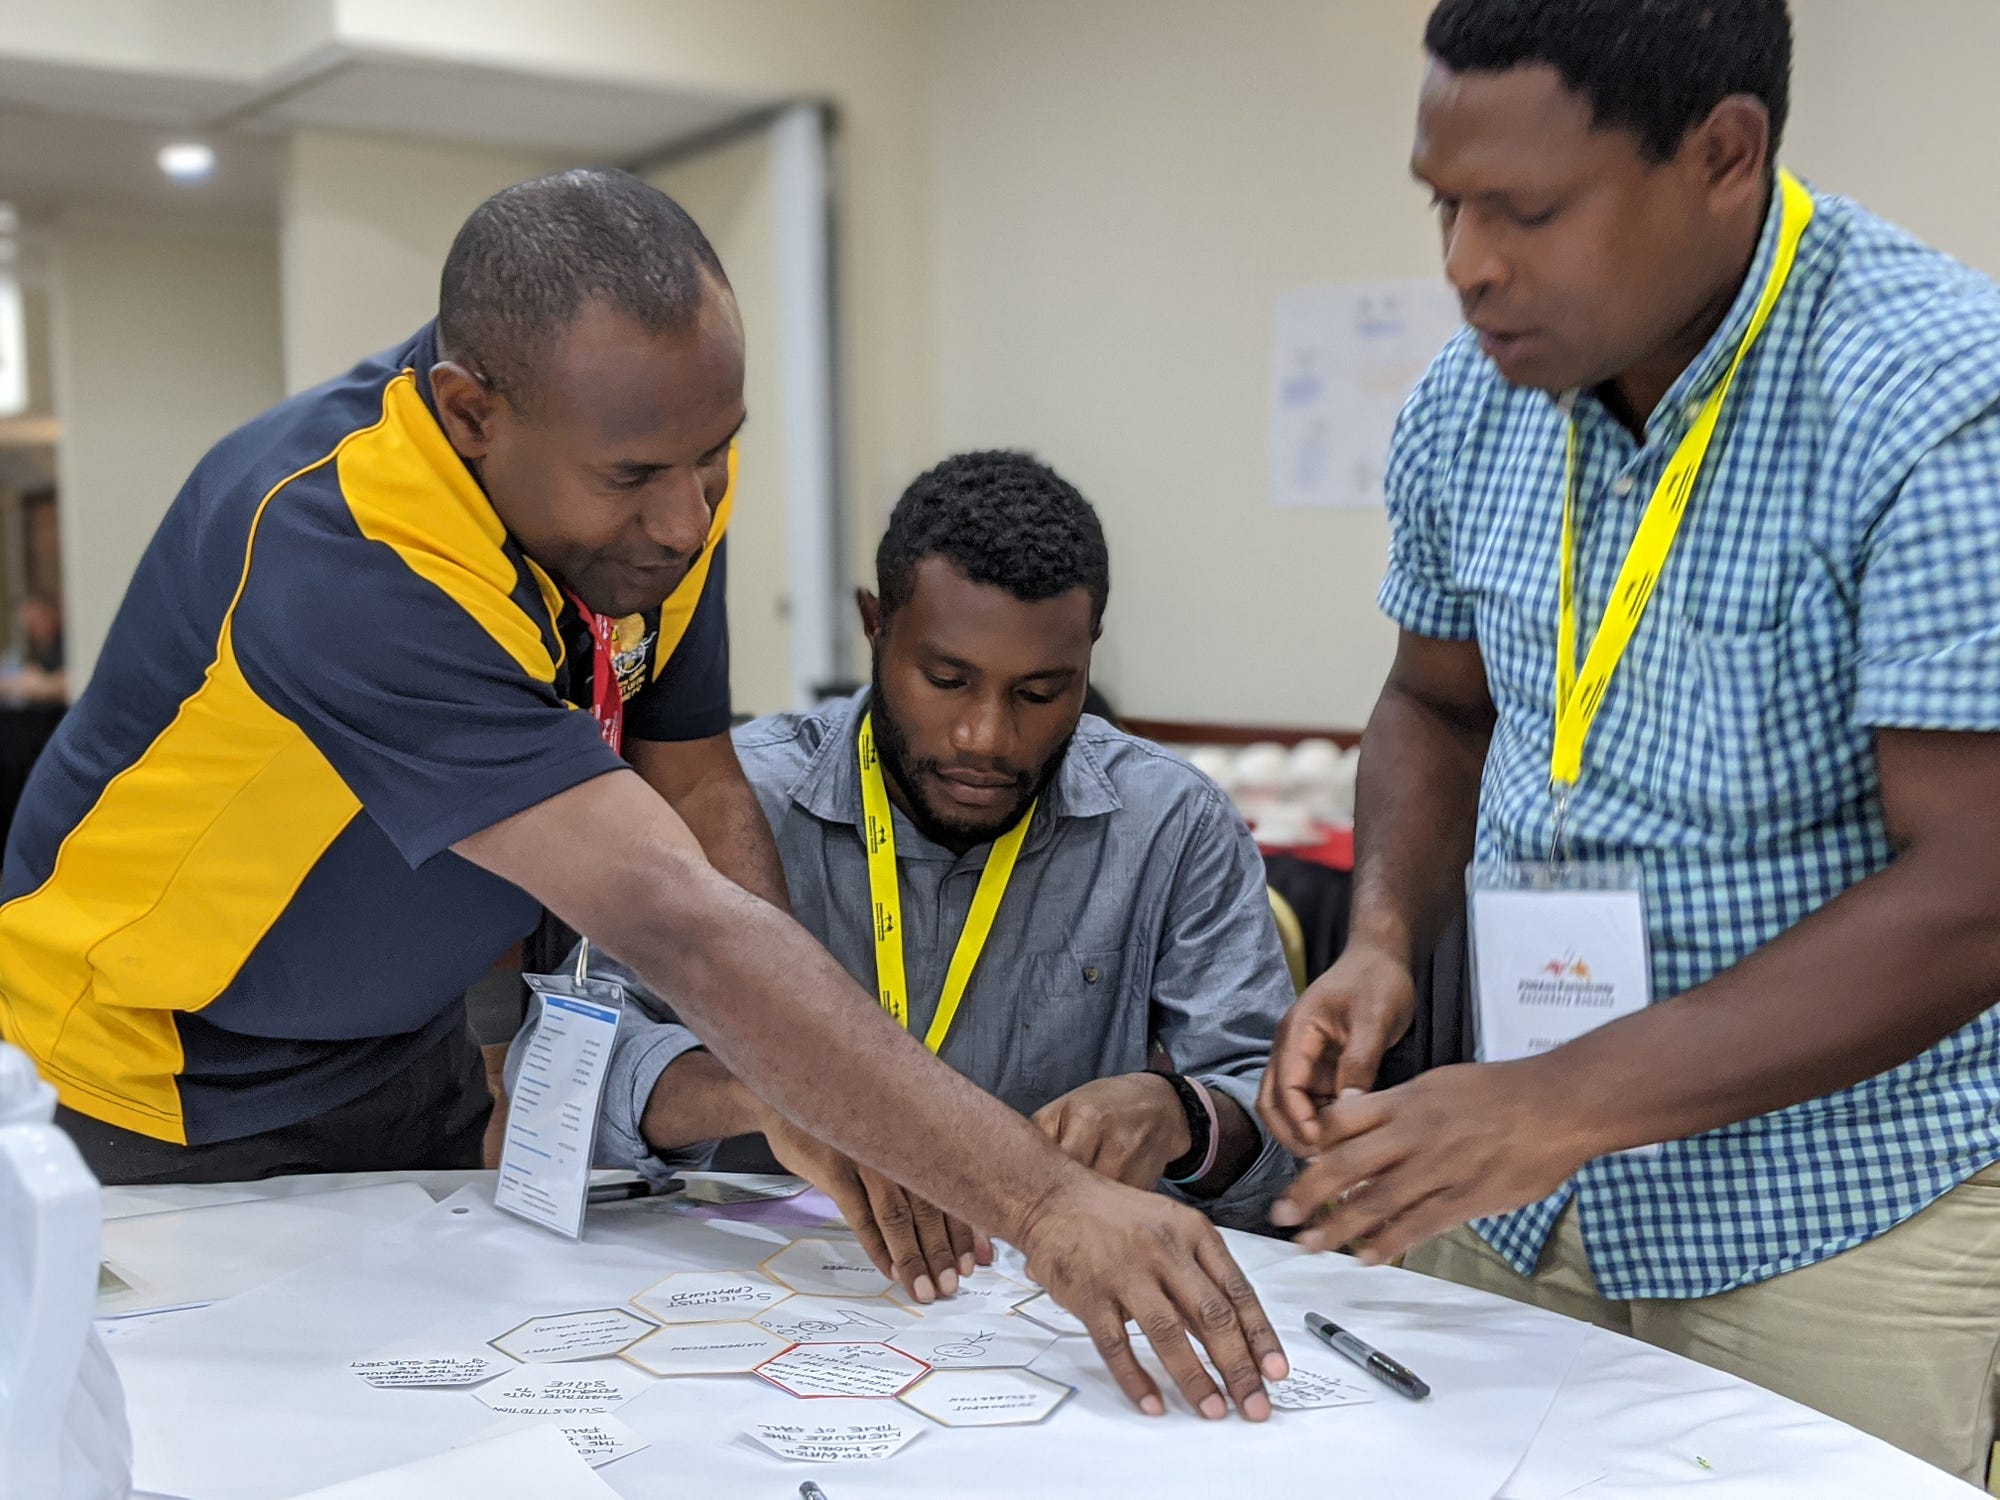
6A project with secondary teachers in Papua New Guinea, exploring project-based learning and curriculum design.
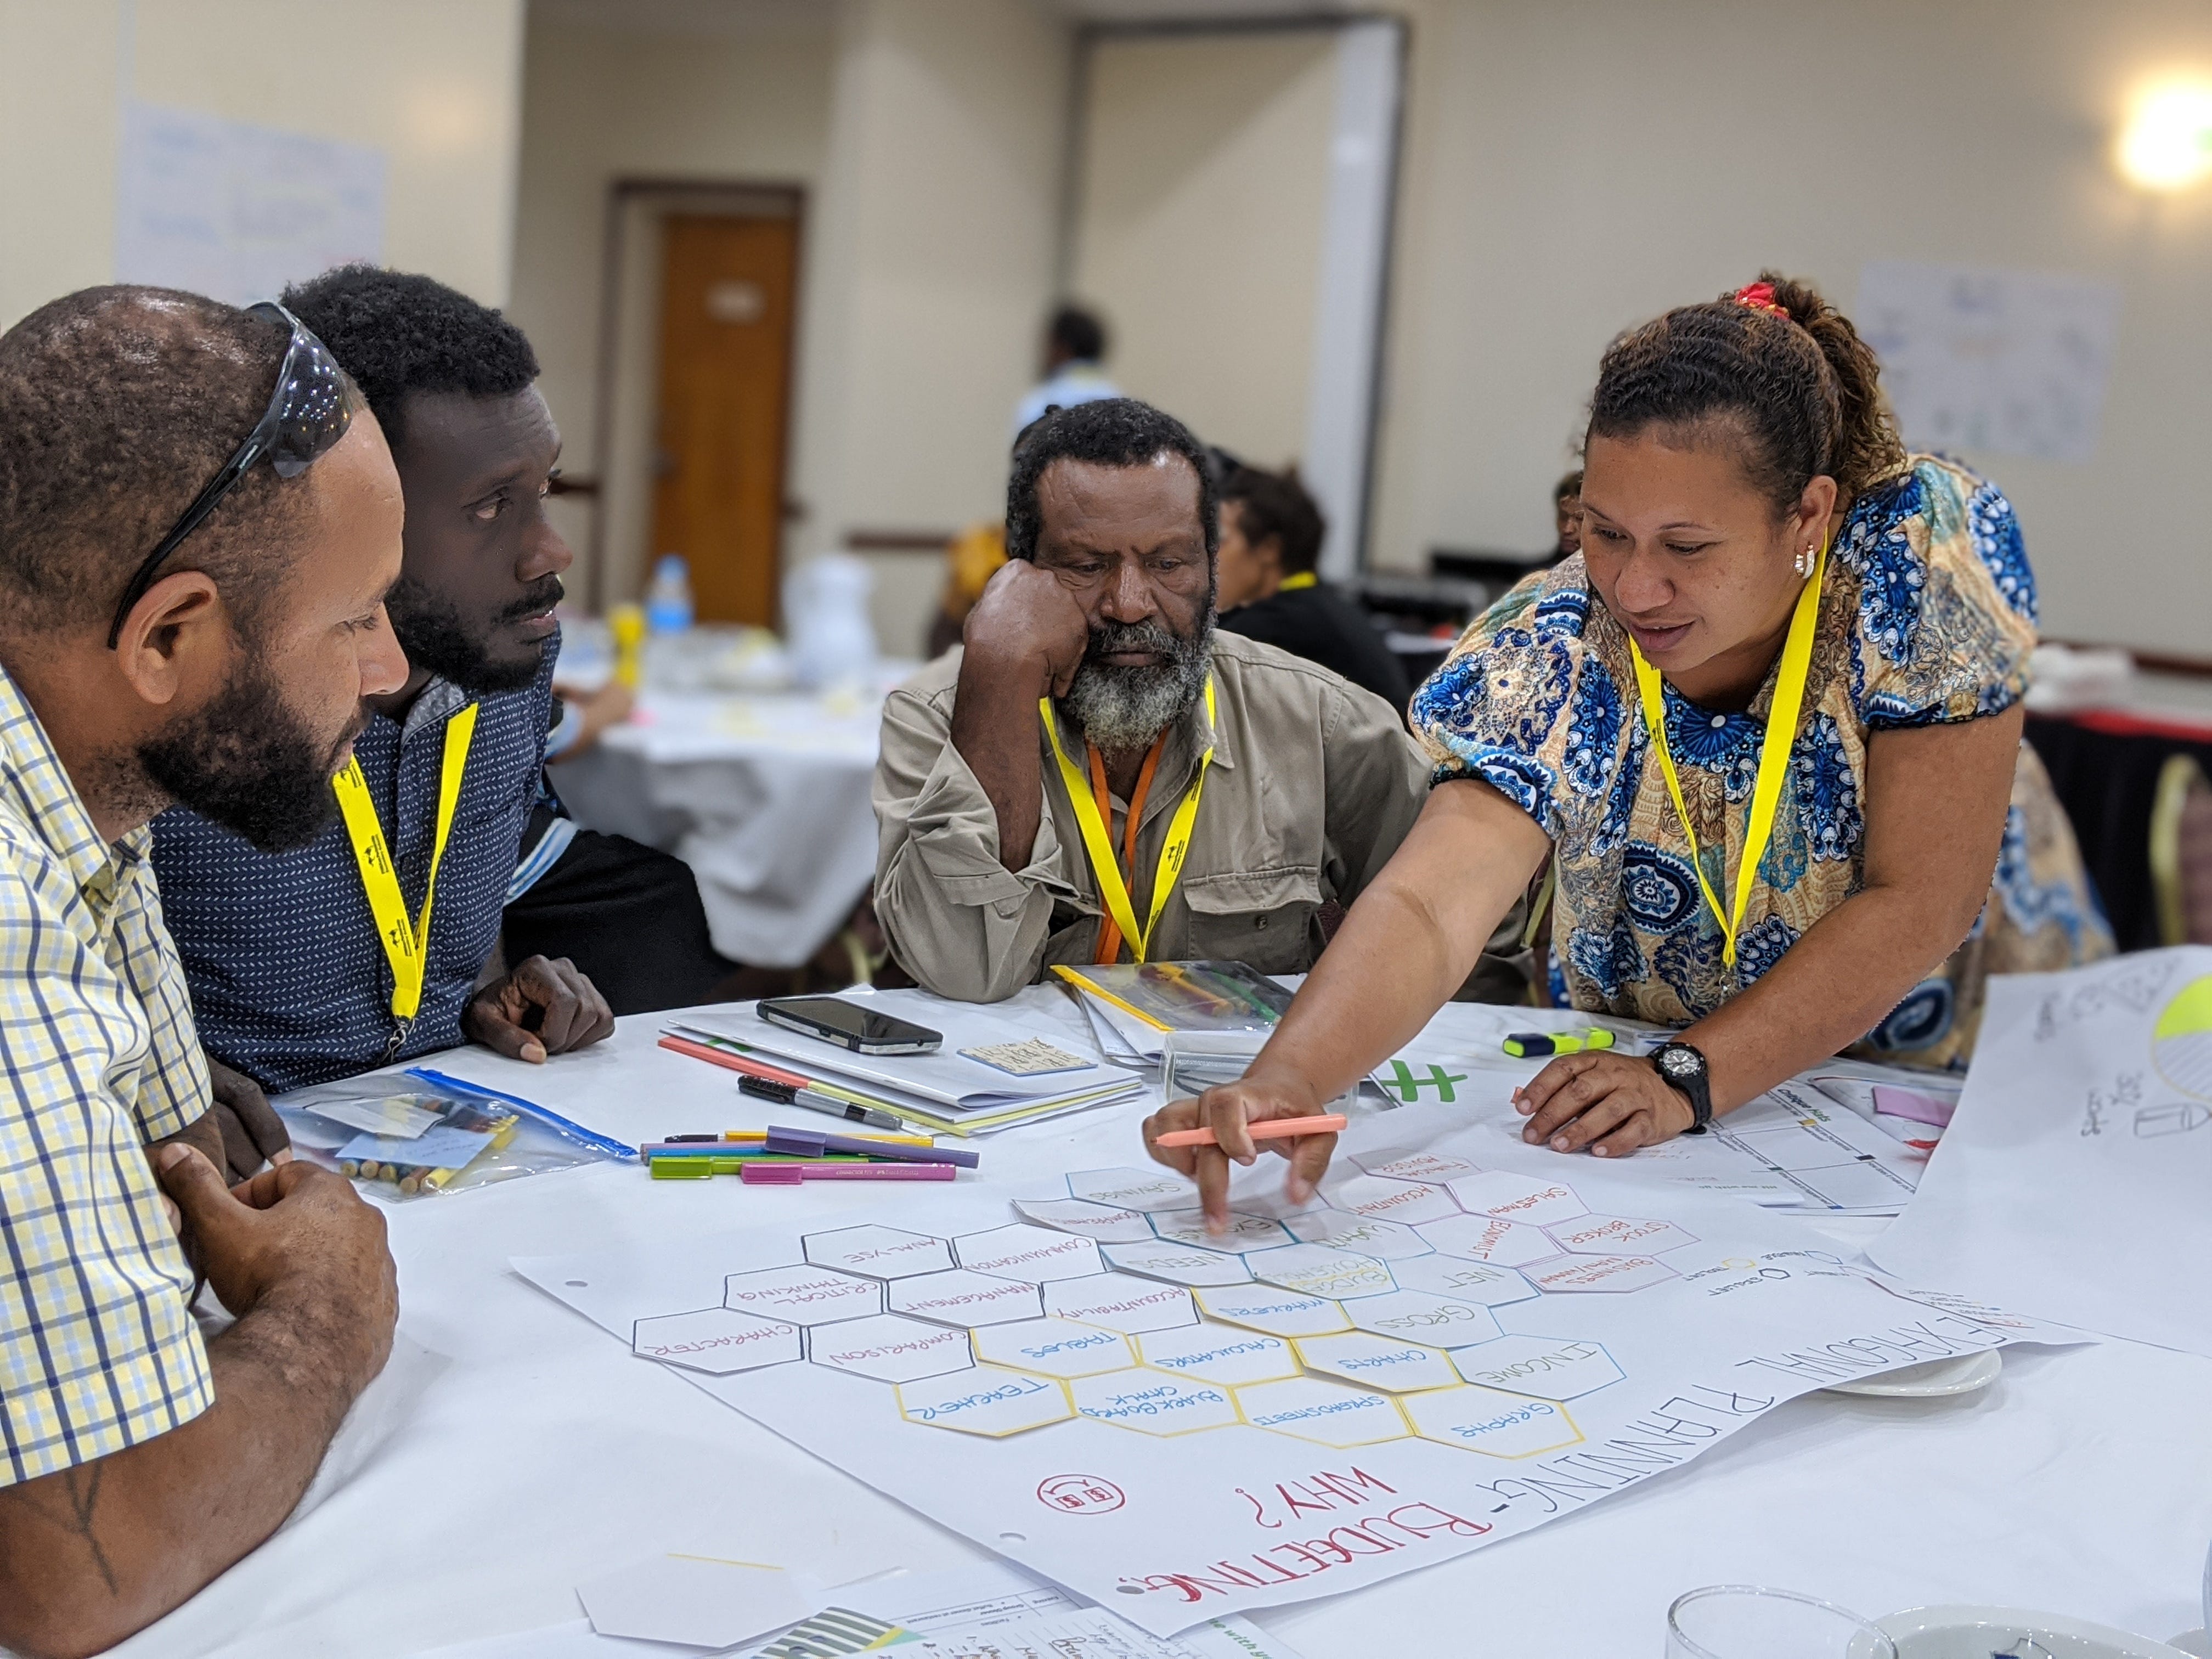
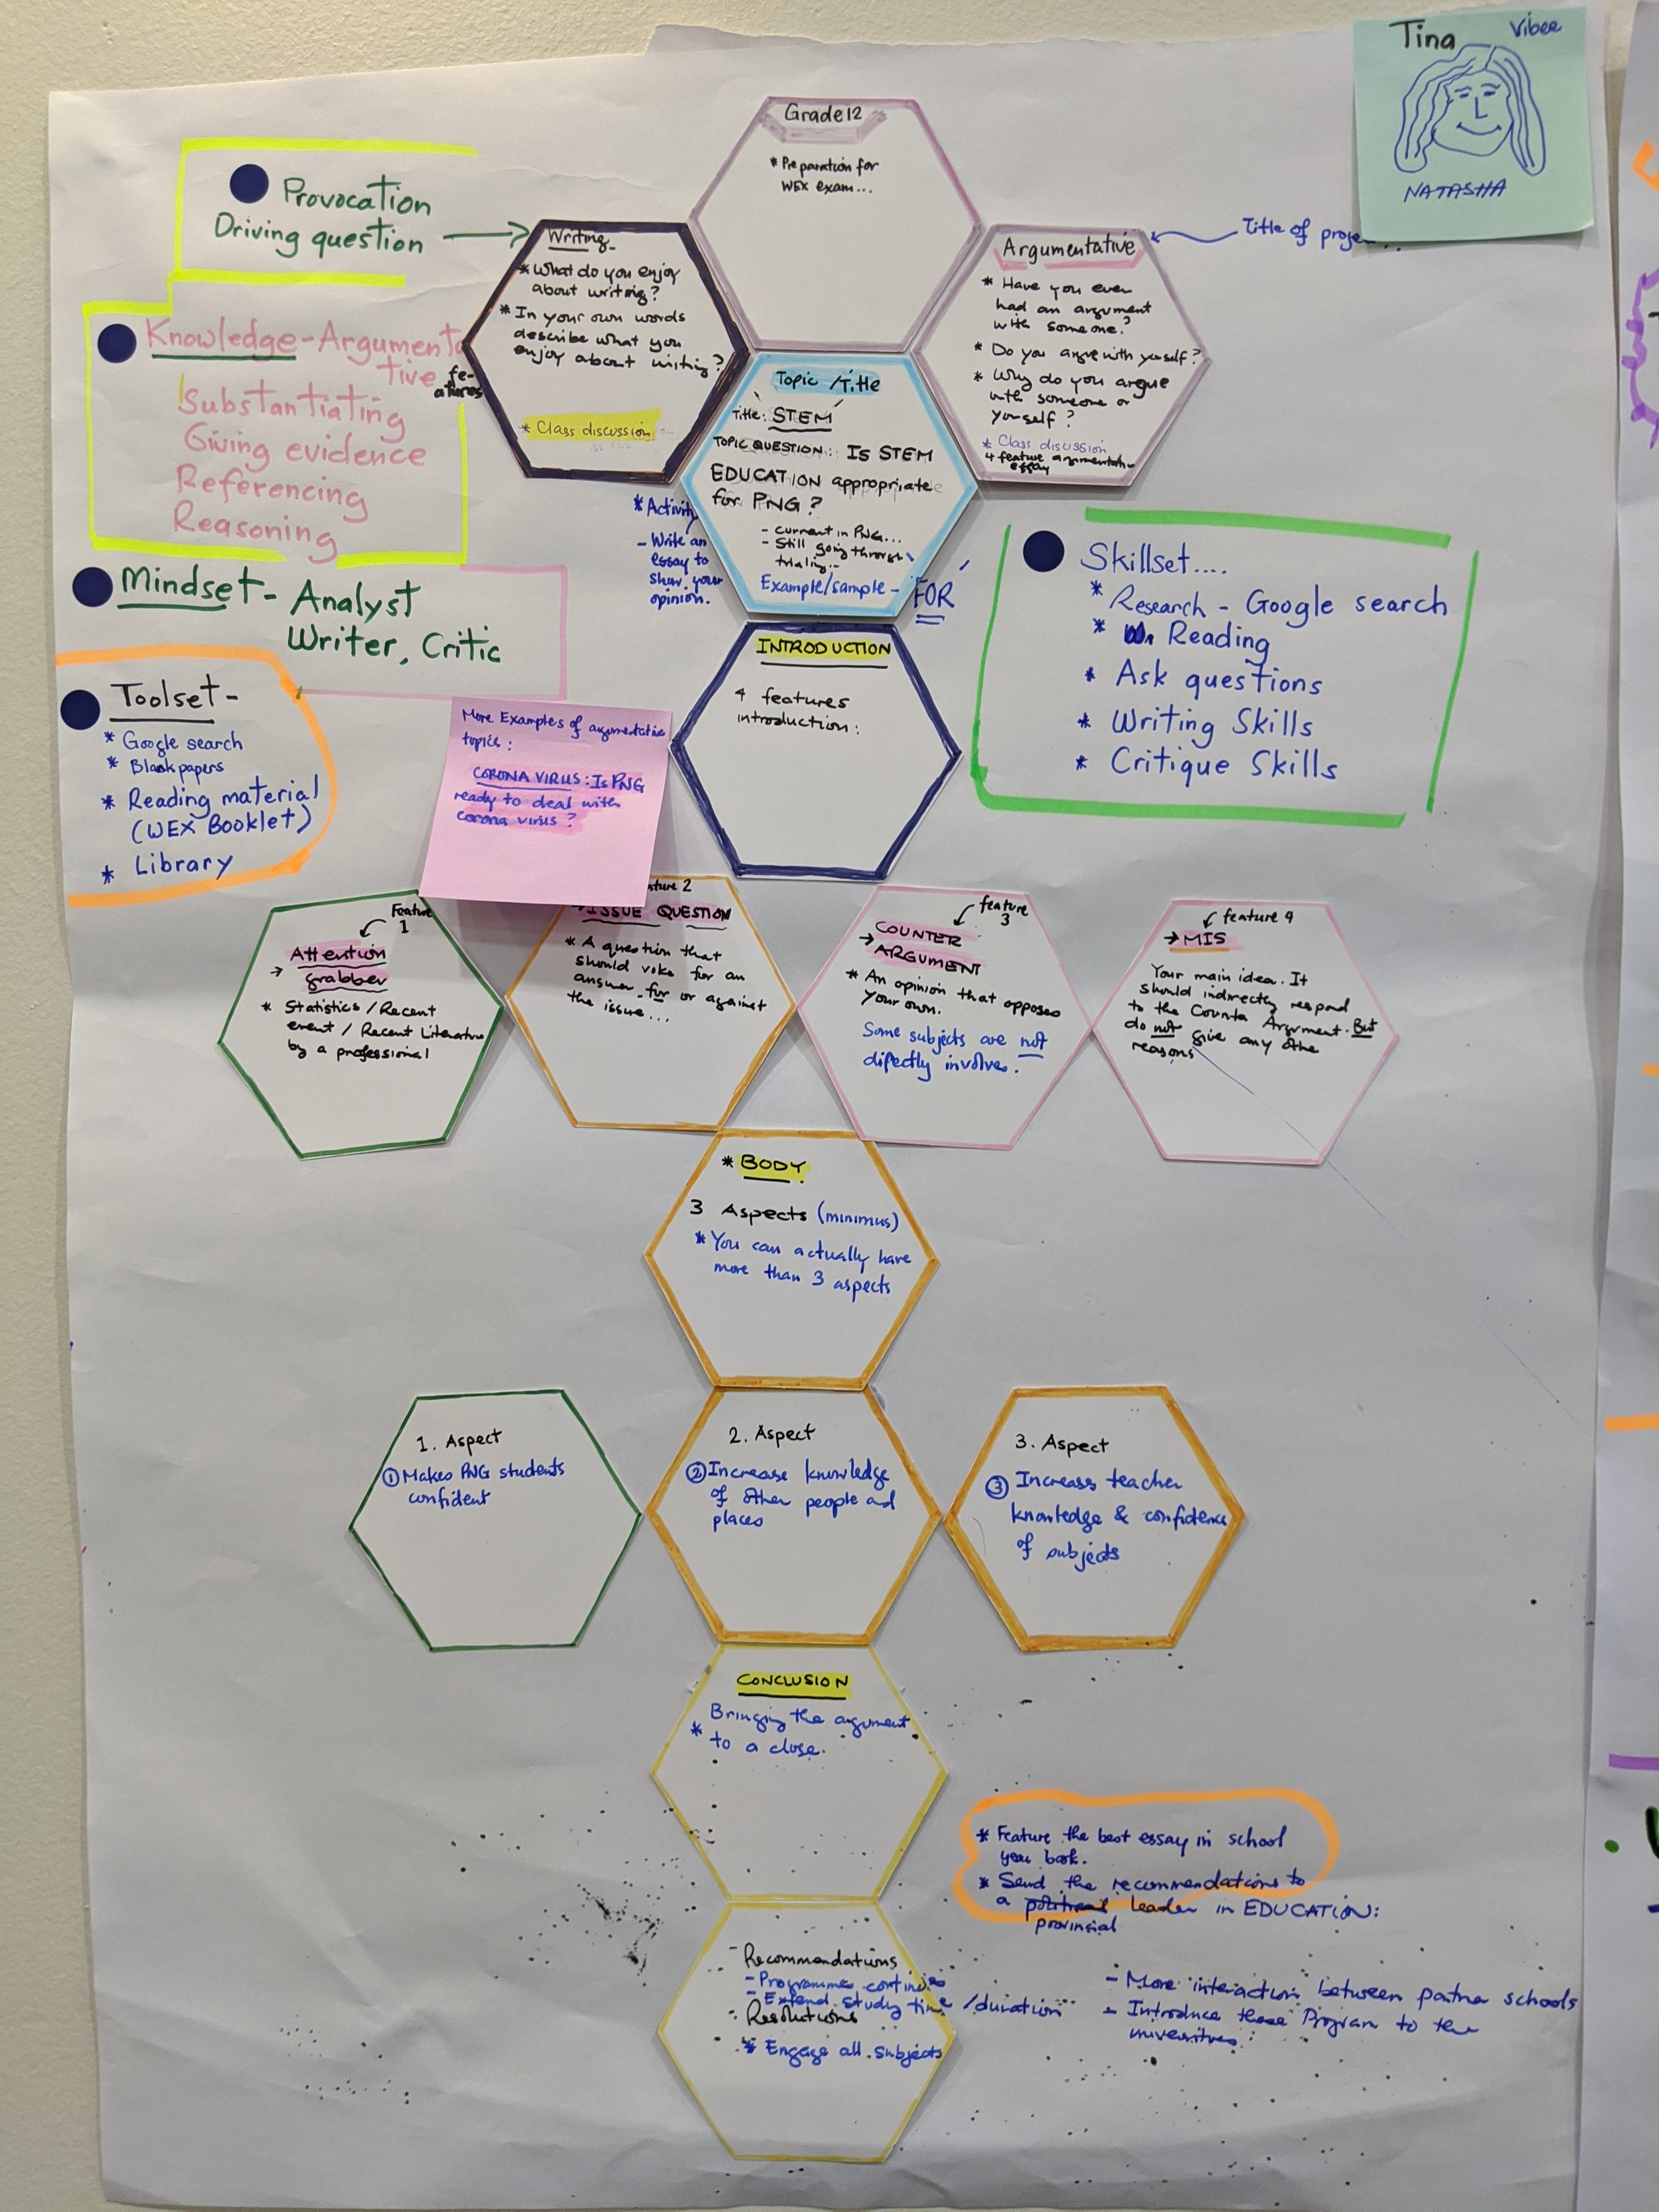
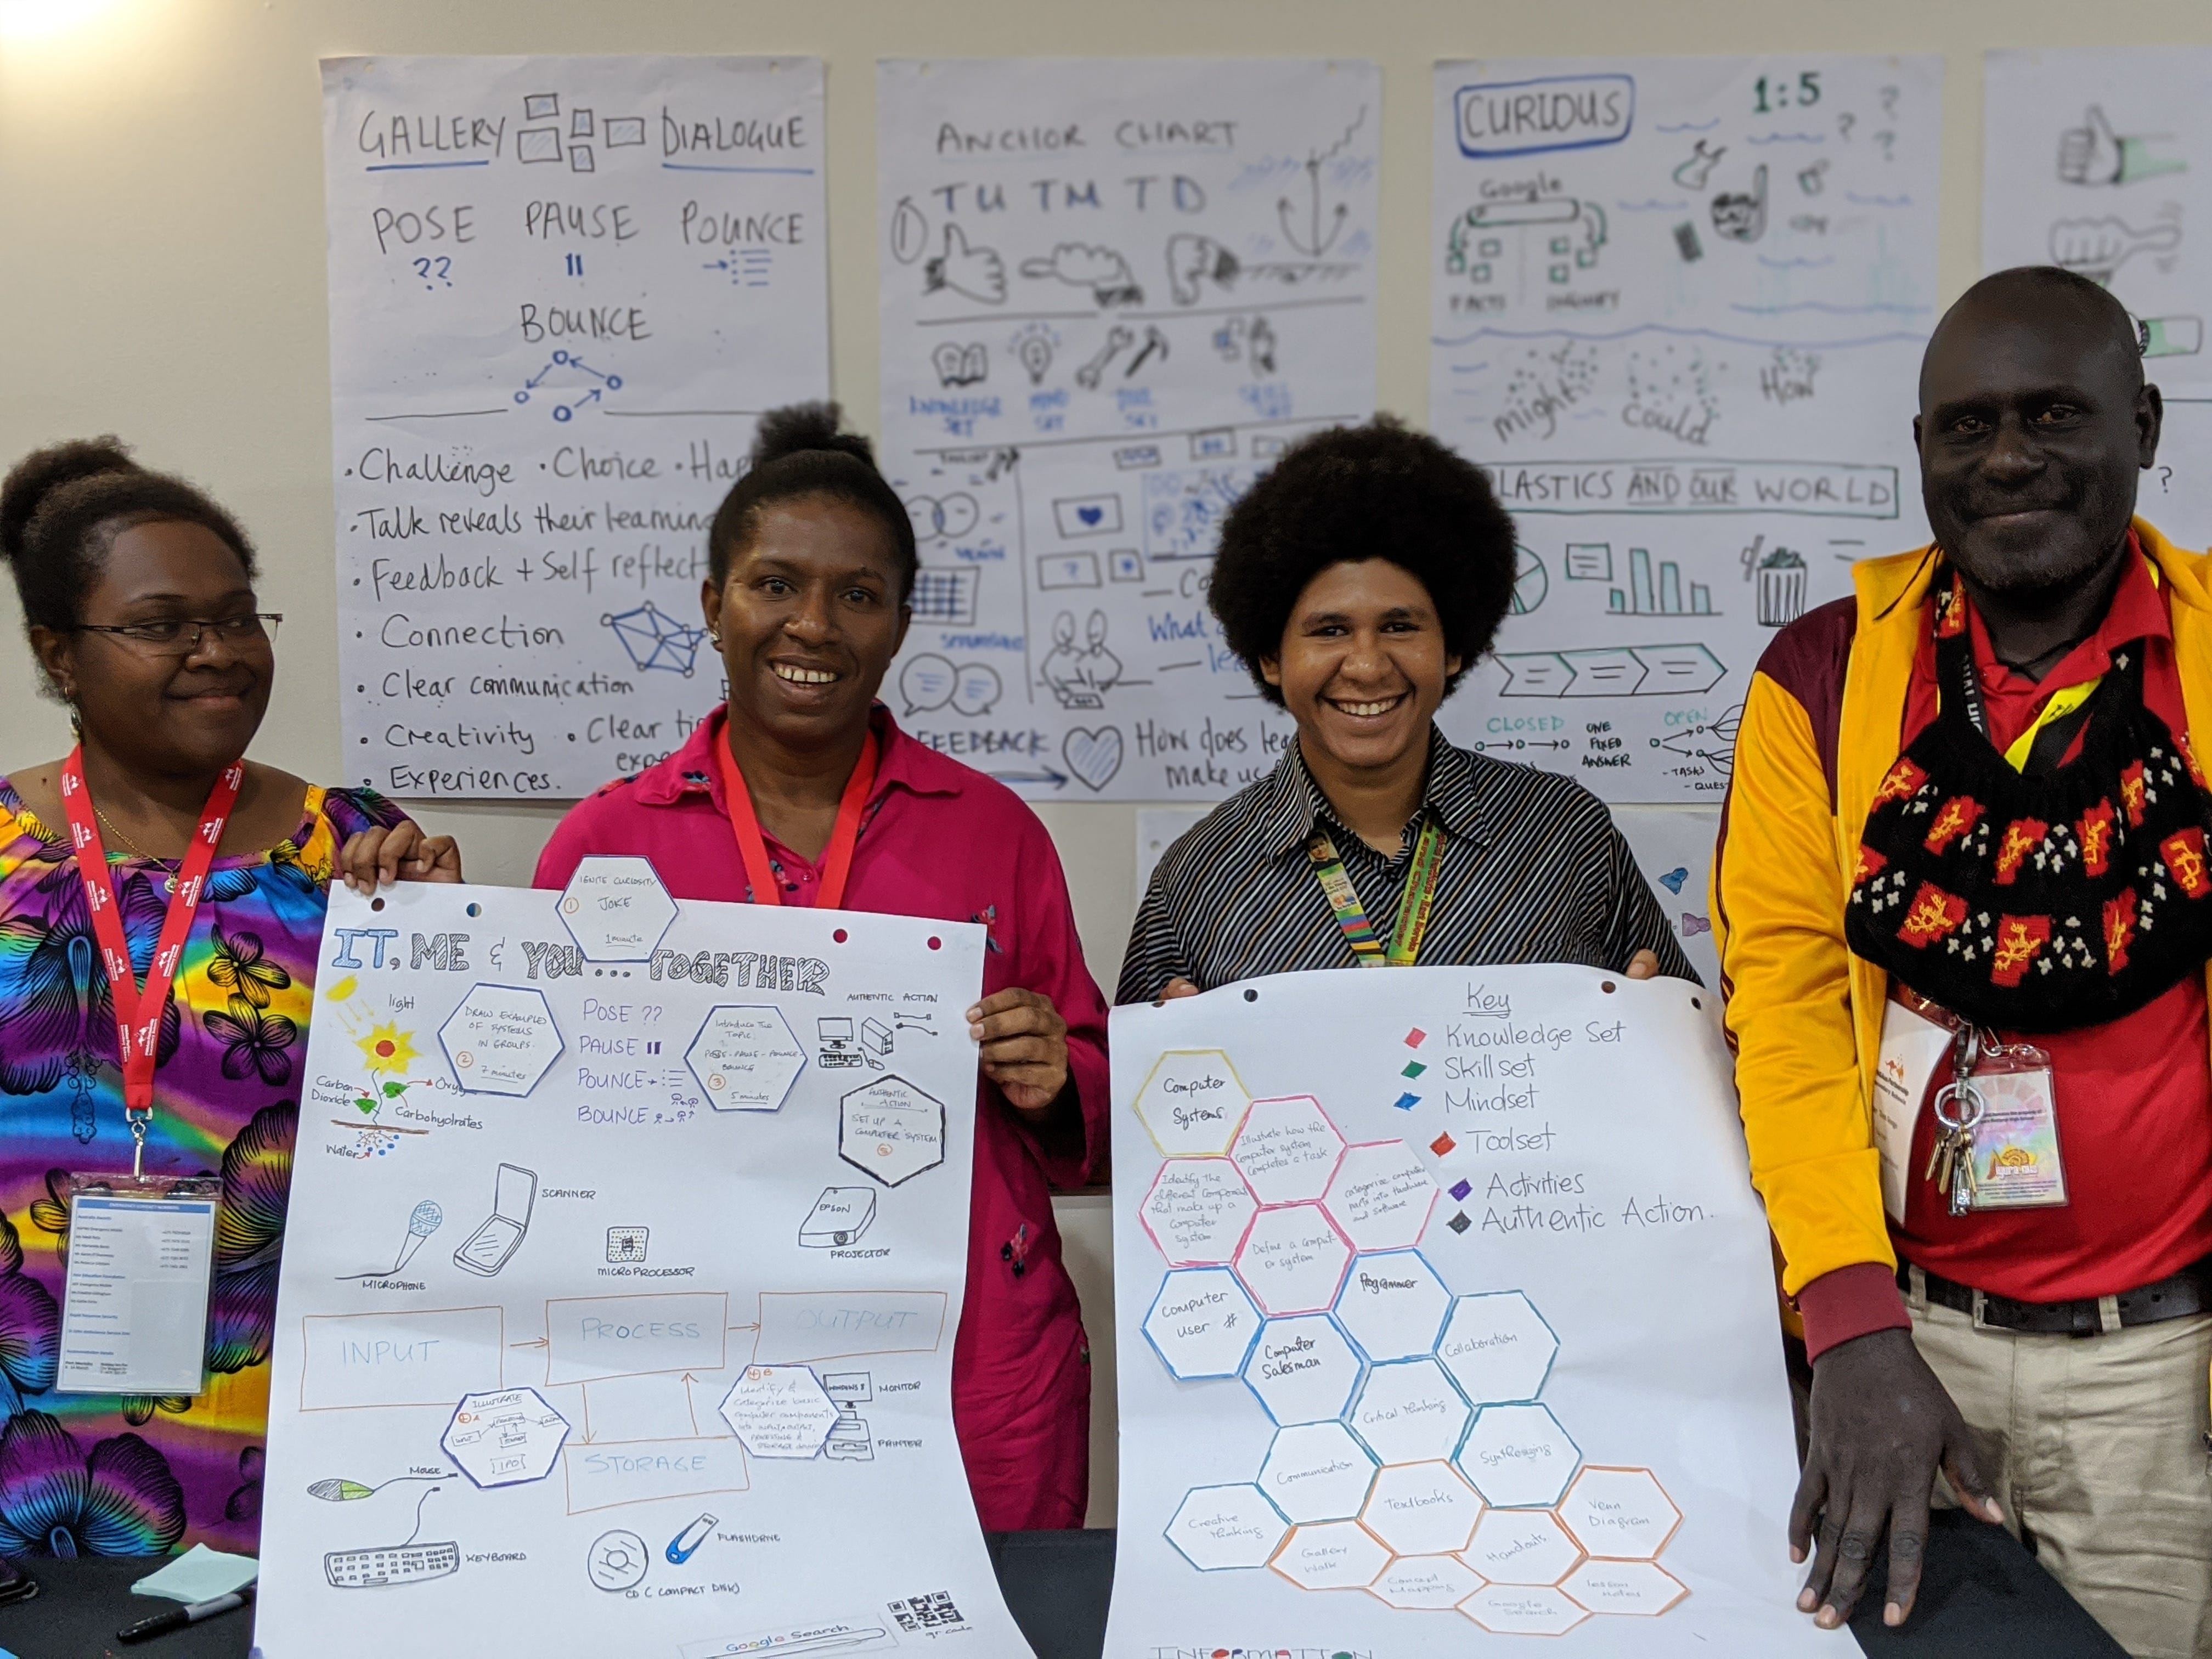
Across a two day workshop, we used a range of mapping activities, including hexagonal curriculum mapping and process maps. We also created some project posters for a sharing event as the teachers pitched their new curriculum ideas to students and their peers for feedback and critique. The tangible ideas helped improve communication and collaboration within the teams.
7 A project with Casey Fields Primary School leadership team to redesign the recruitment process from the ground up.
Part of the early phases of this design facilitation was to gather journey maps from existing teachers at the school. We explored the current process of getting hired and gathered feedback about the different highs and lows. Journey maps worked well to represent the ideas clearly and for the teachers to respond directly about their experience.
Summary and Conclusion
Mapping is a powerful way to turn your thoughts and ideas into tangible representations. When mapping, you can identify patterns that might not be visible on the surface or connections between different concepts.
The variety of mapping types make it possible to create maps suited to your needs, whether they are used for planning design work, facilitating design thinking sessions, exploring relationships within projects or simply mapping out what works well during school days.
I hope this exploration of mapping ideas has given you some new mapping techniques to apply in your design work.
Your Talking Points
- Which spaces could you transform into a developmental project hub?
- How might we create digital spaces that support these mapping ideas activities?
- Which of your projects would benefit from more data and idea mapping?
- Why is mapping so crucial during the early stages of a project?
- What other mapping styles or techniques can you think of that have been successful in your design thinking workshops?
My weekly email helps educators and innovation leaders enhance their practice by sharing provocations, ideas and mental models. Join today, and get your copy this week.
Recommend
About Joyk
Aggregate valuable and interesting links.
Joyk means Joy of geeK