
5

爬取中国大学排名并作可视化分析(应粉丝要求)——python作业
source link: https://blog.csdn.net/jiahuiandxuehui/article/details/120814190
Go to the source link to view the article. You can view the picture content, updated content and better typesetting reading experience. If the link is broken, please click the button below to view the snapshot at that time.
肥友们,最近有位粉丝找到我直言出价让我代做作业,我一听当场就急眼了。我肥学是这样的人吗?
直接就问他给多少钱,嘻嘻嘻!!!当然了多少钱不也不会干的,既然是粉丝我肯定尽量帮啊,于是我就开始了今天的博客。
爬取中国大学排名
链接:中国大学排名
其实还是挺简单的,这位粉丝肯定没有好好看我以前的文章,这种爬取说过很多次了。所以我们直接整起来。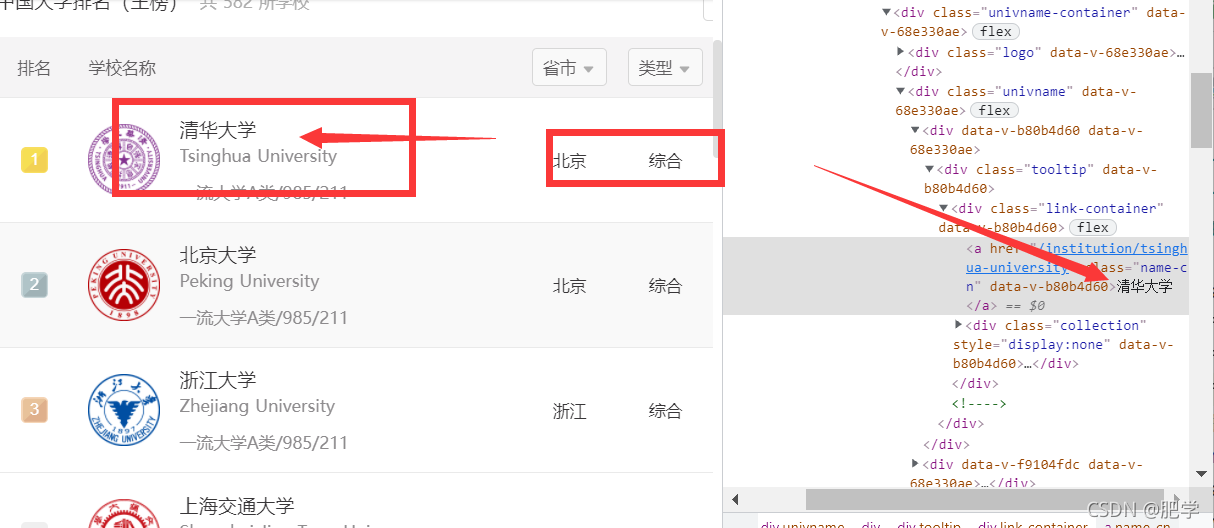
我们直接找到要获得的这些信息的id或者class
res=requests.get(url=url,headers=header).content.decode('utf-8')
soup=BeautifulSoup(res,'lxml')
names=soup.findAll(name="a",attrs={"class":"name-cn"})
xinxi=soup.findAll("td")
with open("中国大学.csv", 'a', encoding="utf-8", newline="") as f:
    for i in range(0,len(xinxi),6):
        w=csv.writer(f)
        w.writerow([xinxi[i].text.strip(),xinxi[i+1].text.strip(),xinxi[i+2].text.strip(),xinxi[i+3].text.strip(),xinxi[i+4].text.strip(),xinxi[i+5].text.strip()])
然后顺利拿到信息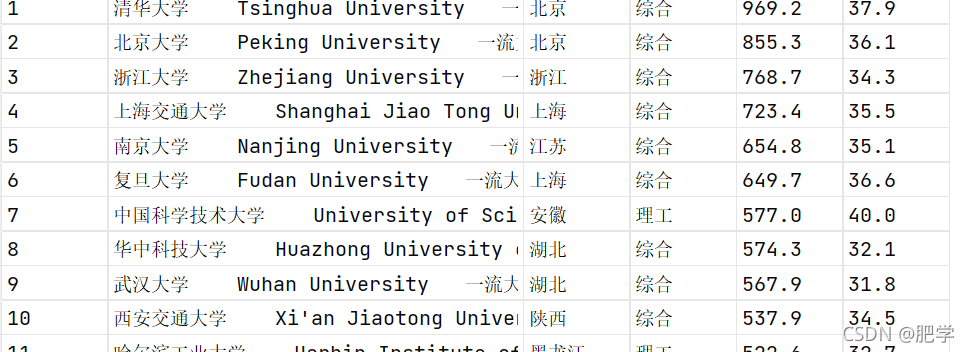
可视化分析
上面我们以经拿到了信息,我们先对这些大学集中的省市和类别做一个词云分析
可以看出来综合和北京的居多
import jieba
from wordcloud import WordCloud
from matplotlib import colors
import csv
import pandas as pd

info=pd.read_csv("中国大学.csv",usecols=[2,3])
text=info
cut_text = "".join(jieba.cut(str(text)))
color_list=['#FF0000','#9955FF','#66FFFF']#建立颜色数组
colormap=colors.ListedColormap(color_list)#调用
#color_mask = cv2.imread("11.jpg")
word_cloud=WordCloud(
    font_path="msyh.ttc",
    background_color='black',
    mode="RGBA",
    prefer_horizontal=1,
    #mask=color_mask,
    height=200,
    width=200,
    scale=1,
    colormap=colormap,#设置颜色
    margin=5
)

word_cloud1=word_cloud.generate(cut_text)
word_cloud1.to_file('2.png')

print("图片保存成功")
条形统计图

这里运用了Echarts做得有兴趣的大佬也可以用cufflinks做也可以达到同样的效果
//这里只把js可变部分贴了出来
option = {
  title: {
    text: '中国大学数据'
  },
  tooltip: {
    trigger: 'axis'
  },
  legend: {
    data: ['总分', '办学层次']
  },
  grid: {
    left: '3%',
    right: '4%',
    bottom: '3%',
    containLabel: true
  },
  toolbox: {
    feature: {
      saveAsImage: {}
    }
  },
  xAxis: {
    type: 'category',
    boundaryGap: false,
    data: [1,2,3,4,5,6,7,8,9,10,11,12,13,14,15,16,17,18,19,20,21,22,23,24,25,26,27,28,29,30]
  },
  yAxis: {
    type: 'value'
  },
  series: [

    {
      name: '总分',
      type: 'line',
      stack: 'Total',
      data: [969.2,855.3,768.7,723.4,654.8,649.7,577.0,574.3,567.9,537.9,522.6,519.3,518.3,516.6,513.8,508.3,488.1,487.8,474.0,465.3,447.0,444.3,442.2,435.7,430.5,427.8,419.8,418.2,401.8,400.4]
    },
    {
      name: '办学层次',
      type: 'line',
      stack: 'Total',
      data: [37.9,36.1,34.3,35.5,35.1,36.6,40.0,32.1,31.8,34.5,32.7,30.9,34.8,30.7,32.8,33.2,34.3,34.5,32.3,31.5,28.8,32.7,30.8,30.4,32.4,32.7,30.5,30.2,35.2,31.8]
    }
  ]
};
获取全国211以上大学的动态地理坐标

plt.rcParams['font.family'] = 'sans-serif'
plt.rcParams['font.sans-serif'] = ['SimHei']
plt.rcParams['axes.unicode_minus'] = False
plt.rcParams['animation.writer'] = 'html'
plt.rcParams['animation.embed_limit'] = 100


def rgba_to_rgb(img_rgba):
    img_rgb = Image.new("RGB", img_rgba.size, (255, 255, 255))
    img_rgb.paste(img_rgba, mask=img_rgba.split()[3])
    return img_rgb


def html_to_gif(html_file, gif_file, duration=0.5):
    path = html_file.replace(".html", "_frames")
    images = [os.path.join(path, x) for x in sorted(os.listdir(path))]
    frames = [imageio.imread(x) for x in images]
    if frames[0].shape[-1] == 4:
        frames = [np.array(rgba_to_rgb(Image.fromarray(x))) for x in frames]
    imageio.mimsave(gif_file, frames, 'gif', duration=duration)
    return gif_file

cmap = ['#2E91E5','#1CA71C','#DA16FF','#B68100','#EB663B','#00A08B','#FC0080','#6C7C32','#862A16','#620042','#DA60CA','#0D2A63'] * 100

def getCoords(geom):
    if isinstance(geom, geo.MultiPolygon):
        return [np.array(g.exterior) for g in geom.geoms]
    elif isinstance(geom, geo.Polygon):
        return [np.array(geom.exterior)]
    elif isinstance(geom, geo.LineString):
        return [np.array(geom)]
    elif isinstance(geom, geo.MultiLineString):
        return [np.array(x) for x in list(geom.geoms)]
    else:
        raise Exception("geom must be one of [polygon,MultiPolygon,LineString,MultiLineString]!")


# 底图数据
dfprovince = gpd.read_file("dfprovince.geojson").set_crs("epsg:4326").to_crs("epsg:2343")
dfnanhai = gpd.read_file("dfnanhai.geojson").set_crs("epsg:4326").to_crs("epsg:2343")
dfline9 = dfnanhai[(dfnanhai["LENGTH"] > 1.0) & (dfnanhai["LENGTH"] < 2.0)]

# 散点数据
df985 = gpd.read_file("中国985大学.geojson").set_crs("epsg:4326").to_crs("epsg:2343")
df211 = gpd.read_file("中国211大学.geojson").set_crs("epsg:4326").to_crs("epsg:2343")
dfpoints = pd.concat([df985, df211], axis=0)
df = pd.DataFrame({"x": [pt.x for pt in dfpoints["geometry"]],
                   "y": [pt.y for pt in dfpoints["geometry"]]})
df["z"] = 1.0
df.index = dfpoints["name"].values


def bubble_map_dance(df, title="中国116所211高校位置分布",
                     filename=None,
                     figsize=(8, 6), dpi=144,
                     duration=0.5,
                     anotate_points=["北京邮电大学", "南昌大学", "华中农业大学", "东华大学", "云南大学",
                                     "陕西师范大学", "内蒙古大学", "西藏大学", "新疆大学", "青海大学", "哈尔滨工程大学"]):
    fig, ax_base = plt.subplots(figsize=figsize, dpi=dpi)
    ax_child = fig.add_axes([0.800, 0.125, 0.10, 0.20])

    def plot_frame(i):

        ax_base.clear()
        ax_child.clear()
        # 绘制省边界
        polygons = [getCoords(x) for x in dfprovince["geometry"]]
        for j, coords in enumerate(polygons):
            for x in coords:
                poly = plt.Polygon(x, fill=True, ec="gray", fc="white", alpha=0.5, linewidth=.8)
                poly_child = plt.Polygon(x, fill=True, ec="gray", fc="white", alpha=0.5, linewidth=.8)
                ax_base.add_patch(poly)
                ax_child.add_patch(poly_child)

        # 绘制九段线
        coords = [getCoords(x) for x in dfline9["geometry"]]
        lines = [y for x in coords for y in x]
        for ln in lines:
            x, y = np.transpose(ln)
            line = plt.Line2D(x, y, color="gray", linestyle="-.", linewidth=1.5)
            line_child = plt.Line2D(x, y, color="gray", linestyle="-.", linewidth=1.5)
            ax_base.add_artist(line)
            ax_child.add_artist(line_child)

        # 设置spine格式
        for spine in ['top', 'left', "bottom", "right"]:
            ax_base.spines[spine].set_color("none")
            ax_child.spines[spine].set_alpha(0.5)
        ax_base.axis("off")

        # 设置绘图范围
        bounds = dfprovince.total_bounds
        ax_base.set_xlim(bounds[0] - (bounds[2] - bounds[0]) / 10, bounds[2] + (bounds[2] - bounds[0]) / 10)
        ax_base.set_ylim(bounds[1] + (bounds[3] - bounds[1]) / 3.5, bounds[3] + (bounds[3] - bounds[1]) / 100)

        ax_child.set_xlim(bounds[2] - (bounds[2] - bounds[0]) / 2.5, bounds[2] - (bounds[2] - bounds[0]) / 20)
        ax_child.set_ylim(bounds[1] - (bounds[3] - bounds[1]) / 20, bounds[1] + (bounds[3] - bounds[1]) / 2)

        # 移除坐标轴刻度
        ax_child.set_xticks([]);
        ax_child.set_yticks([]);
        k = i // 3 + 1
        m = i % 3
        text = "NO." + str(k)

        dfdata = df.iloc[:k, :].copy()
        dftmp = df.iloc[:k - 1, :].copy()

        # 绘制散点图像
        if len(dftmp) > 0:
            ax_base.scatter(dftmp["x"], dftmp["y"], s=100 * dftmp["z"] / df["z"].mean(),
                            c=(cmap * 100)[0:len(dftmp)], alpha=0.3, zorder=3)
            ax_child.scatter(dftmp["x"], dftmp["y"], s=100 * dftmp["z"] / df["z"].mean(),
                             c=(cmap * 100)[0:len(dftmp)], alpha=0.3, zorder=3)

            # 添加注释文字
            for i, p in enumerate(dftmp.index):
                px, py, pz = dftmp.loc[p, ["x", "y", "z"]].tolist()
                if p in anotate_points:
                    ax_base.annotate(p, xy=(px, py), xycoords="data", xytext=(-15, 10),
                                     fontsize=10, fontweight="bold", color=cmap[i], textcoords="offset points")

        # 添加标题和排名序号
        # ax_base.set_title(title,color = "black",fontsize = 12)
        ax_base.text(0.5, 0.95, title, va="center", ha="center",
                     size=12, transform=ax_base.transAxes)
        ax_base.text(0.5, 0.5, text, va="center", ha="center",
                     alpha=0.3, size=50, transform=ax_base.transAxes)

        # 添加注意力动画
        if m == 0:
            px, py, pz = dfdata["x"][[-1]], dfdata["y"][[-1]], dfdata["z"][-1]
            p = dfdata.index[-1]
            ax_base.scatter(px, py, s=800 * pz / df["z"].mean(),
                            c=cmap[len(dfdata) - 1:len(dfdata)], alpha=0.5, zorder=4)
            ax_base.annotate(p, xy=(px, py), xycoords="data",
                             xytext=(-15, 10), fontsize=20, fontweight="bold",
                             color=cmap[k - 1], textcoords="offset points", zorder=5)

        if m == 1:
            px, py, pz = dfdata["x"][[-1]], dfdata["y"][[-1]], dfdata["z"][-1]
            p = dfdata.index[-1]
            ax_base.scatter(px, py, s=400 * pz / df["z"].mean(),
                            c=cmap[len(dfdata) - 1:len(dfdata)], alpha=0.5, zorder=4)
            ax_base.annotate(p, xy=(px, py), xycoords="data",
                             xytext=(-15, 10), fontsize=15, fontweight="bold",
                             color=cmap[k - 1], textcoords="offset points", zorder=5)

        if m == 2:
            px, py, pz = dfdata["x"][[-1]], dfdata["y"][[-1]], dfdata["z"][-1]
            p = dfdata.index[-1]
            ax_base.scatter(px, py, s=100 * pz / df["z"].mean(),
                            c=cmap[len(dfdata) - 1:len(dfdata)], alpha=0.5, zorder=4)
            ax_base.annotate(p, xy=(px, py), xycoords="data",
                             xytext=(-15, 10), fontsize=10, fontweight="bold",
                             color=cmap[k - 1], textcoords="offset points", zorder=5)

    my_animation = animation.FuncAnimation(fig, plot_frame, frames=range(0, 3 * len(df)), interval=int(duration * 1000))

    if filename is None:
        try:
            from IPython.display import HTML
            HTML(my_animation.to_jshtml())
            return HTML(my_animation.to_jshtml())
        except ImportError:
            pass
    else:
        my_animation.save(filename)
        return filename
最后对肥友说
为了粉丝这把拼了 我觉得真的收费的大概也就这样了吧,好几天没有写python了这把直接给我整爽了。持续关注我后面Java和python的web都给大家整一套。最后还是那句话一起肥学,一起加油
特别介绍
📣小白练手专栏,适合刚入手的新人欢迎订阅编程小白进阶
📣python有趣练手项目里面包括了像《机器人尬聊》《恶搞程序》这样的有趣文章,可以让你快乐学python练手项目专栏
📣另外想学JavaWeb进厂的同学可以看看这个专栏:传送们
📣这是个面试和考研的算法练习我们一起加油上岸之路
资料领取和详解
Recommend
About Joyk
Aggregate valuable and interesting links.
Joyk means Joy of geeK