

Remote sensing reveals Antarctic green snow algae as important terrestrial carbo...
source link: https://www.nature.com/articles/s41467-020-16018-w
Go to the source link to view the article. You can view the picture content, updated content and better typesetting reading experience. If the link is broken, please click the button below to view the snapshot at that time.
Introduction
In the limited terrestrial ecosystems of Antarctica, all photosynthetic organisms will make a significant contribution to the ecology of their habitat. Ice-free ground makes up only around 0.18% of Antarctica’s continental area, and even in the Antarctic Peninsula, the most vegetated region of Antarctica, only 1.34% of this exposed ground is vegetated1,2. Photosynthetic life is not restricted to bare ground however, with algal blooms often appearing in coastal snowfields as green (Fig. 1) and red patches below and on the snow surface3,4,5. Blooms of snow algae in Antarctica were first described by expeditions in the 1950s and 1960s6,7 and have since been studied at a few locations in Antarctica, where they have been shown to host a diverse range of algal species3,4,8,9,10 and to play key roles in nutrient and carbon cycling11,12,13. Considering that a single snow algal bloom can cover hundreds of square metres4, snow algae are potentially one of the region’s most significant photosynthetic primary producers, as well as influencing nutrient provision to downstream terrestrial and marine ecosystems14.
A photograph showing a snow algae bloom dominated by green algae starting to melt out from beneath seasonal snow cover to sit exposed upon underlying multiyear \({\text{n}}\acute{{\text{e}}}{\text{v}}\acute{{\text{e}}}\)/firn. 26 January 2018, Anchorage Island (67.6°S). Bloom shown was approximately 50 m × 100 m.
Warming in the Antarctic Peninsula has already exceeded 1.5 °C over pre-industrial temperatures15, and current Intergovernmental Panel on Climate Change (IPCC) projections indicate further global increases16,17. Set against a background of natural decadal temperature variability18,19, climatic changes on the Peninsula are already influencing its vegetation20,21. With the available area for plant colonisation on the Peninsula likely to increase by up to threefold due to this warming22, understanding how snow algae fit into Antarctica’s biosphere and their probable response to warming is critical to understanding the overall impact of climate change on Antarctica’s vegetation.
Satellite remote sensing offers a step change in our ability to map and monitor the extent of Antarctica’s terrestrial biosphere. However, current remote sensing estimates of vegetation biomass and distribution are biased towards plants on exposed ground1,23,24 and often exclude snow algae from analysis as their spectral profile precludes the use of classical vegetation indices. Efforts to use remote sensing to identify and quantify snow algae have to date focused on the Northern Hemisphere, with early work using airborne hyperspectral imaging25 and newer predictive models developed for quantifying biomass and the bioalbedo (the impact of biological impurities on ice and snow albedo) of snow and ice26,27,28. Several studies have used satellite observations to investigate snow and ice algae on larger scales29,30,31, implicating algal blooms as significant drivers for darkening and enhancing melt of the Greenland ice sheet31. Current spectral and spatial resolution of freely available multispectral satellite imagery limits the study of most snow and ice algae to presence detection through classification models or assessing relatively small, ground validated areas. Large-scale observations are also hampered by strong forward scattering of light on snow, mountainous terrain and low solar zenith angles in the Polar regions, which introduce strong directional biases within satellite imagery, added to which frequent cloud cover and summer snowfall often obscure algae on the surface.
To mitigate these challenges, we make use of multiple years of data obtained from the European Space Agency’s (ESA) Sentinel 2 constellation of multispectral imaging satellites to provide the first estimate of the distribution, size and biomass of snow algal blooms across the entire the Antarctic Peninsula. To validate our approach, remote sensing was combined with in situ measurements of spectral reflectance factors, cell concentration, dry biomass, gas exchange and nutrient status, with data being collected over two field seasons, at Ryder Bay, Adelaide Island (67°S), in the 2017/18 summer, and the Fildes Peninsula, King George Island (62°S), in the 2018/19 summer. We show that the Antarctic Peninsula supports at least 1.3 × 10³ tonnes (dry mass) of green snow algae, covering approximately 1.9 km2. We also present data on the likely factors controlling snow algal distribution and discuss how this may be influenced by climatic warming.
Results and discussion
Ground validation campaign
Coastal snow fields at both field sites had visible blooms of green and red snow algae (see Fig. 1), ranging from 10s of cm2 to 100s of m2 in area. Early in the melt season (December/January), green snow algae was primarily observed within a band of slush between the seasonal and perennial snow layers. By February, large areas of this seasonal snow cover had melted and exposed the underlying green algae as a thin (c. 9 mm) layer on the surface of the underlying, older snow. Brightfield microscopy revealed the morphology of the green algae present, which ranged from unicellular round or elongate-ellipsoidal (single or clumped) to filamentous strands of cells (see Supplementary Fig. 1 for brightfield images). Hemispherical directional reflectance factors (HDRFs) were recorded for green snow algae on King George Island using a field spectrometer (Fig. 2). Significant variation in intensity of reflectance factors was observed across patches of green snow algae, with average visible/near infrared HDRFs for high cell density blooms c. 20% of control plots with no visible colouration. This lowering of albedo relates to increased absorption of light directly by algal cells as well as indirect influences, such as greater liquid water content in snow containing algae26. All HDRFs from green snow algal blooms (n = 91) featured characteristic chlorophyll a absorbance centred around 680 nm25,26 (see Fig. 2). This meant that they returned positive values of IB4 (Eq. (1)) when convolved to the spectral response of Sentinel 2’s multispectral imager. Values of IB4 derived from field-measured HDRFs ranged from 0.02 (measured cell density: 1.2 × 10⁴ cells ml−1) to 0.39 (measured cell density: 1.2 × 10⁵ cells ml−1).
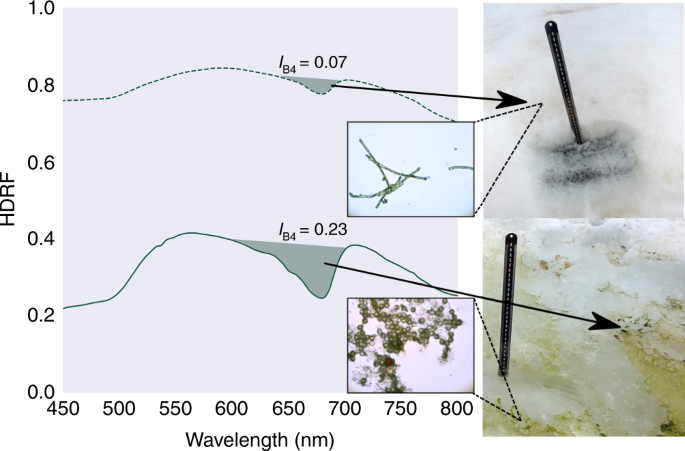
Hemispherical directional reflectance factors (HDRFs) of green snow algae, showing representative spectra from high (solid, green line) and low (dashed, green line) cell density patches of snow algae with corresponding IB4, sampling site photograph and brightfield microscope image (black scale bar represents 5 μm). HDRFs, photographs and microscopy from snow sampled close to Refugio Collins, King George Island, Antarctica.
Red and/or orange snow algae blooms (such as Sanguina sp., Chloromonas polyptera and Hydrurus sp.) are also a dominant ecosystem alongside, or even incorporated within, some green blooms4,9,10,32. However, in spite of their importance such dominant red or orange blooms had to be excluded from our study as absorbance from secondary carotenoids such as astaxanthin, present in red but not all green cells33, reduces the reflectance of Band 3 and flattens any chlorophyll absorbance feature within Sentinel 2 bands, making them difficult to detect automatically (see Supplementary Fig. 2). Although it is possible to relate secondary carotenoid absorbance to snow algae biomass29, broad absorbance below 500 nm is also indicative of mineral dust within the snow25,26, making it an unsuitable semi-automatic method to assess red snow algae. It is probable that green blooms detected within Sentinel 2 imagery also contain red and/or orange cells, but due to the resolution we can only base the findings on the chlorophyll pigments and so assume that these blooms are green dominant.
The linear relationship between cell density and IB4 (Fig. 3) was high and significant, with a Pearson’s correlation coefficient of r(89) = 0.85, P < 0.01. Likely causes of variation include factors that affect the HDRF lineshape, such as debris and/or red algal cells within the snow, and snow morphology, such as crystal structure and liquid water content27. Variation may also be derived from sampling geometry, with a fixed nadir viewing angle, but with aspect, slope angle and the solar zenith varying between sampling sites. The y-intercept of the linear regression model from Fig. 3 determined the lower limit of detection of green snow algae within a Sentinel 2 pixel, 4.4 × 10³ cells ml−1. However, as seen in Fig. 1, blooms were typically not homogeneous at the 10 × 10 m scale of a Sentinel 2 pixel. On snow, any chlorophyll absorbance from algae will be integrated across a pixel according to its point spread function34 with a theoretical minimum area limit of detection based on the bloom’s cell density and whether it crosses through the centre or is positioned at the border of a pixel. Combining and averaging green snow algae and white surface snow HDRFs from our 10 × 10 m sampling grid and assuming a bloom crosses through the centre of a pixel, we empirically estimate the minimum Sentinel 2-detectable bloom area to be 11 m2. Mixed pixels containing rock or vegetation alongside green snow algae would likely be excluded from the study based on the filter functions in Eq. (3).
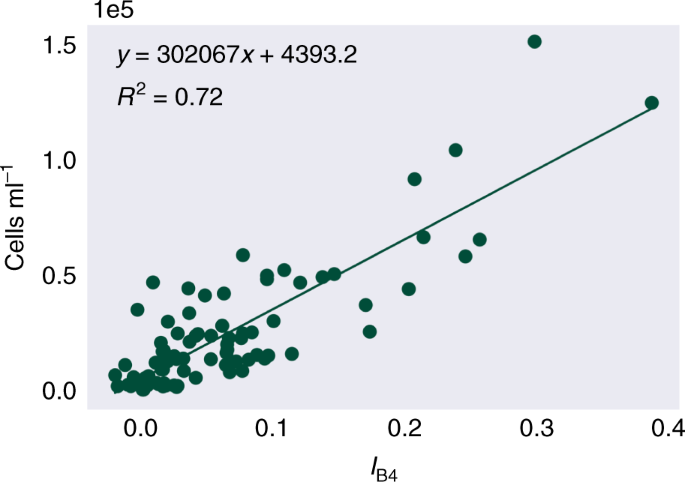
Linear regression of the scaled integral of Sentinel 2's Band 4 relative to Bands 3 and 5, versus concentrations of green algal cells within the snow (n = 91).
Green snow algal biomass
Summer Sentinel 2A and 2B imagery of the Antarctic Peninsula from 2017, 2018 and 2019 was used to produce the first estimate of snow algal biomass distribution for the region. Figure 4 shows the first Antarctic Peninsula scale map of the distribution and average cell concentration estimates of green snow algae. Remote-sensed locations were validated using bloom sightings from published literature7,9,14,35, a visitor survey at the 2018 Scientific Committee of Antarctic Research (SCAR) Open Science Conference36, images collected by Antarctic researchers and those available on the Secretariat of the Antarctic Treaty’s visitor site guidelines website37. Validation sites are shown as red triangles in Fig. 4 and our remote-sensed bloom locations have a kappa score of 0.81 (n = 25) when referenced against these observations.
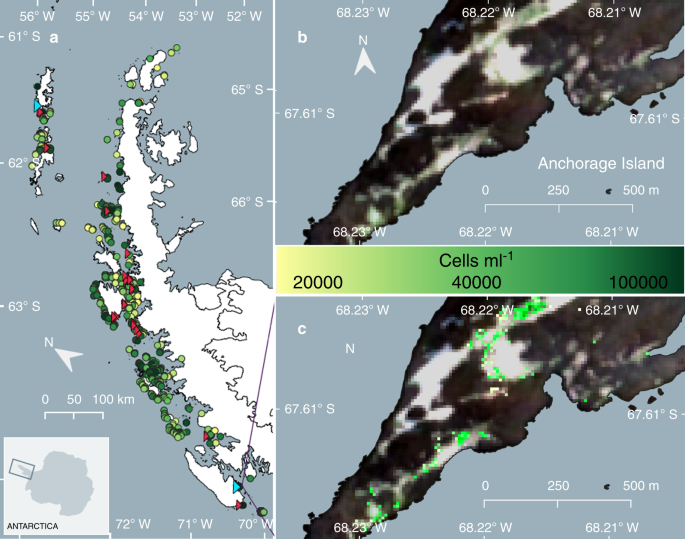
a Overview of the locations of individual blooms of green-dominant snow algae identified across the Antarctic Peninsula using modelled data from satellite imagery and ground data (circles; n = 1679). Circle colour scale represents the mean cell density (cells ml−1) of each bloom. Red triangles indicate the location of ground validation sites (n = 27). Cyan triangles show the location of our Adelaide Island and King George Island field sites. b RGB Sentinel 2A image of green snow algae blooms at one of our validation sites, Anchorage Island (February, 2020). c Output of IB4 (Eq. (1)), where coloured pixels are those not masked by Eq. (3). Pixel values are converted to cell density (cells ml−1) using Eq. (2) with the colour scale showing the resultant cell density for each pixel identified as containing green snow algae.
In total, 1679 individual blooms of green snow algae were identified. A large range in the area of individual blooms was observed, averaging 1043 m2, but spanning 300 m2 (based on our lower area filter) to 145,000 m2, the latter observed on Robert Island, South Shetland Islands (62.4°S). In total, 1.9 × 104 pixels were identified as containing green snow algae, covering 1.9 km2 of the total area of the Antarctic Peninsula studied here (c. 2.7 × 10⁵ km2). For comparison, commensurate, high confidence (Landsat imagery; NDVI > 0.1) estimates of the area covered by other terrestrial vegetation on the Peninsula, is 8.5 km2 1. Pixel cell concentrations also varied significantly, ranging between 1.9 × 10⁴ cells ml−1 and 1.7 × 10⁵ cells ml−1. These results compare well with our in situ measurements (averaging 2.2 × 10⁴ cells ml−1; see Table 1) but are lower than values reported elsewhere (e.g. 1.2 × 10⁶ cells ml−1)4, likely because our sampling strategy aimed to capture variation on a 10 × 10 m Sentinel 2 pixel scale. A number of factors cause uncertainty in the presented area estimates as, although our method will detect subpixel blooms, it will integrate the actual cell density across the area of the entire pixel, hence overestimating the visible area of algae in this scenario. Conversely, our output is derived from a snap shot of seasonal growth, and other green algae will be obscured from view by overlying snow. Widespread field surveys combined with high resolution, frequent revisit satellite imagery would be necessary to address these limitations and should be the focus of future investigations.
We combined remote-sensed observations with in situ measurements to estimate snow algal biomass (dry mass). Based on the bloom area, the average thickness of green algal blooms on the snow surface and the density of the snow algal surface layer (Table 1), we normalised per pixel cell concentrations by area (see Table 1 for average cells m−2 values). Green snow algae biomass was then calculated using these cell-area concentrations along with the average in situ measured dry mass of a green snow algae cell (2.4 × 10⁻⁸ ± 2.2 × 10⁻⁸ g). Propagated error from this calculation results in an uncertainty of plus 564% and minus 5% relative to biomass values reported here using mean values. Algal biomass estimates from Sentinel 2 imagery ranged from 5 to 5791 g dry mass m−2 (averaging 58 g dry mass m−2), comparing well with in situ measurements (averaging 30 g dry mass m−2; see Table 1) and spanning a range similar to that caused by propagated error. Combining average biomass estimates from all identified blooms, green snow algae had a total annual dry biomass of 1.3 × 10³ tonnes on the Antarctic Peninsula, which, based on average %C content of green snow algae (Table 1), is equivalent to 479 tonnes of carbon within a growth season. Future work should prioritise incorporating red snow algal blooms into this figure, as, though field measurements suggests that red blooms contain less mass on a per m−2 basis (averaging 12 g dry mass m−2 ± 19), field observations indicate red snow algae are likely to cover at least half the area of green snow algae (average measured area of Ryder Bay red algal blooms = 328 m2 versus 714 m2 for green blooms) and would significantly increase total biomass estimates. In addition, the carbon content of previous green and red blooms at the start of the season is also largely unknown.
Since the snow algae blooms identified within satellite imagery are the surviving product of a summer’s growth, we can use our biomass estimates to infer rates of seasonal carbon uptake. Assuming a 122-day season and a 17-h period of photosynthesis (based on average growth hours recorded for in situ carbon flux chamber measurements), snow algae would need an average net carbon exchange rate (NCER) of −0.064 μmols CO2 m−2 s−1 to build up the observed biomass, similar to measured in situ rates (average of −0.08 μmols CO2 m−2 s−1; see Table 1). Rates of ecosystem respiration (ER) from Ryder Bay and King George Island (average of 0.07 μmols CO2 m−2 s−1; see Table 1) indicated that snowpack heterotrophs, bacteria and fungi4,38,39 were also active and producing CO2 within the snowpack. NCER at snow algal blooms, however, was negative across a range of sunlight conditions (photosynthetically active radiation (PAR) ranging from 9 to 2594 μmols m−2 s−1, averaging 398 μmols m−2 s−1), and we therefore suggest green snow algae to have positive net ecosystem production (i.e. a short-term net sink of carbon until biological degradation occurs or the algae are eaten) throughout the summer season. Compared to other terrestrial vegetation, calculated in situ rates of gross ecosystem photosynthesis (GEP) (Table 1) were similar to other plant species in Antarctica39,40. However, flux measurements from other Antarctic plant ecosystems indicate complexity in net carbon exchange. High rates of soil-based microbial respiration (0.27–2.23 μmols CO2 m−2 s−1)39,40 can lead to vegetated sites being net sources of CO2 (−0.03 to 0.62 μmols CO2 m−2 s−1)39, though well-established vegetation shows largely negative NCER over a growth season40. This highlights a need for large-scale characterisation of carbon fluxes from Antarctic terrestrial vegetation, including snow algae, and their associated heterotrophic communities and is especially pressing considering observed increases in growth rates in response to Antarctic warming41,42,43.
Snow algae distribution controls
Understanding controls on the distribution of snow algae is crucial for predicting how blooms may respond to the future warming of the coastal zone of Antarctica, forecast by models in the Fifth Climate Model Intercomparison Project44. Snow algae require liquid water, light and nutrients to grow, yet our understanding of how they respond to variability in these different factors is limited to in vitro experiments45,46 or analysis of snow algae metabolites4,47. Mapping snow algal biomass at large scale along the Antarctic Peninsula provides an opportunity to explore some of these controls based on geospatial relationships. The blooms identified in Fig. 4 were predominantly in coastal snowfields on the western side of the Peninsula and occurred over a latitudinal range of 62.3°S–68.1°S. The South Shetland Islands (62.3°S) were the northern-most outlying islands considered in this study, though blooms certainly occur further north on the South Orkney and South Sandwich Islands, and on Sub-Antarctic South Georgia48. Our most southerly observation was on the Faure Islands at (68.1°S). Data from the SCAR-READER near-surface air temperature database19 and the 2-m Regional Atmospheric Climate Model (RACMO2.3)49 indicate that this latitudinal range (62°S–68°S) corresponds with a region of the Peninsula that experiences average summer air temperatures >0°C, implying seasonal snow melt and the availability of liquid water within this zone. We see similar temperature zonation when relating snow algae-containing pixels to elevation using the 8-m Reference Elevation Model for Antarctica (REMA)50, with the majority of blooms occupying low lying snowfields (averaging 14.8 ± 9.0 m above sea level) and infrequently occurring at higher elevations. The majority of blooms were on flat or moderately sloping snow surfaces, with the average slope being 14.5° ± 12.9°. Only smaller blooms were observed on steeper ground (up to 72.8°), with blooms >1300 m2 absent on slopes >30°, indicating that snow instability and/or enhanced wash out of snowpack nutrients51 may prevent large blooms forming on steeper slopes. No trends were observed for aspect, with blooms occupying snow facing all directions. This may be expected given the typically cloudy, diffuse light and long-day conditions over the Peninsula.
Marine fauna are a potential source of nutrients for Antarctic snow algae, with faeces at seal haul-outs, penguin colonies and nesting sites for other birds providing hot spots of nitrogen and phosphate in an otherwise typically oligotrophic environment14,35,51,52,53,54. Indeed, our Ryder Bay green snow algae sites were in proximity to elephant seal wallows and skua and kelp gull nesting sites. Our sites contained elevated nitrate and phosphate concentrations relative to inland values recorded by Nowak et al.54 for the same locality, as well as enriched δ15N, indicative of nitrogen inputs from higher trophic levels35,52,53 (Table 1). The influence of marine fertilisation was also evident in our Peninsula-wide survey, with 49% of observed blooms being within 100 m of the sea, and 60% of blooms being within 5 km of a penguin colony55. Moreover, the average area was larger (1257 m2 versus 960 m2; t test: t = 1.4; P < 0.16) and mean cell concentration significantly larger (4.1 × 10⁴ cells ml−1 versus 3.7 × 10⁴ cells ml−1; t test: t = 6.4; P < 0.01) at the 30% of blooms <1 km from a penguin colony relative to those outside this radius, suggesting that nutrients supplied by Antarctic marine fauna are utilised by snow algae and influence growth rates. This is a significant finding because measured %N of green snow algae collected from Ryder Bay and King George Island (Table 1) implies an annual nitrogen requirement of 71.7 tonnes to support the observed Peninsula-wide growth of green snow algae; roughly equivalent to 3.1 g of bioavailable nitrogen being supplied per m2 of snowpack in a growth season. Based on the nitrogen content measured at our Ryder Bay sites (Table 1) and values reported elsewhere14,51,54, this would necessitate a resupply of nutrients throughout the melt season, either through melt-out and mobilisation of nutrients within a larger area of snow or added windblown/direct inputs from sources such as marine fauna.
Implications for a warming Antarctic Peninsula
Our study indicates that positive summer temperatures and a sufficient nutrient supply are key factors determining the present-day distribution of green snow algae on the Antarctic Peninsula. With the IPCC’s projected 1.5 °C global temperature increase, it is predicted that the 0 °C isotherm will increase in elevation and that positive degree days will become more commonplace and occur further to the south56. This will likely open up new snow for colonisation by green snow algae, should an appropriate dispersal mechanism allow transfer to new areas. The impact warming would have on marine nutrient supply to the snowpack is less clear, as marine vertebrates have shown varying degrees of plasticity in response to a changing Antarctic environment57,58. Southern expansion of marine habitats could increase the number of nutrient hotspots in the south, yet stresses resulting from increased precipitation or food chain disruption may negatively impact established bird populations58,59.
The latitudinal range over which we currently observe green snow algae provides a small summer temperature gradient (1.5 °C at Bellinghausen Station (62.2°S) to 0.5 °C at San Martin Station (68.1°S)19,49; J/F/M average) and we observe both average area and maximum bloom elevation increasing towards the north of Peninsula (Fig. 5). High maximum area and elevation observations for 62°S relative to the rest of the Peninsula (Fig. 5) was the result of two very large blooms in the South Shetland Islands, at Robert Island (62.4°S) and Nelson Island (62.3°S) (shown in Fig. 4). Both blooms occurred adjacent to and downwind of large chinstrap and gentoo penguin colonies55, and both islands have large ablation zones extending high up onto their local ice caps. Robert Island had both the largest observed bloom area and supported the highest elevation observation of green snow algae (99 m above sea level), whereas the Nelson Island bloom contained the highest observation of biomass (2.1 kg C m−2). Among the most northern of our observations, these blooms could be used as a model for change as the Peninsula warms and that, at least in the short term, an increase in ablation zone area may facilitate bloom area increases at sites with large bird or seal populations to supply this new habitable snow with nutrients. However, 62% of blooms observed in this study were on small islands with no local ice caps or mountains to allow upward range expansion, and a warming Peninsula could see a loss of summer snow on these islands (unless they are able to bloom earlier in the season). In our snapshot of blooms on the Peninsula, 95% of the observed green snow algal biomass comes from relatively few (0.05%) large blooms, and the contribution from these low-lying islands was small, comprising only 0.004% of total observed biomass. A warming Peninsula, therefore, may see a shift towards fewer, larger snow algae blooms, resulting in a significant increase in biomass on larger outlying islands and the mainland. The coupled loss of blooms from smaller islands would be insignificant with respect to biomass and may be mitigated by southward range expansion or an earlier growth season. However, with multiple and often unknown species recorded within patches of green snow algae4,8,9,10,52, and little known about the dispersal mechanisms, life cycles and plasticity of snow algal species, losses from these islands could represent a reduction of terrestrial diversity for the Antarctic Peninsula.
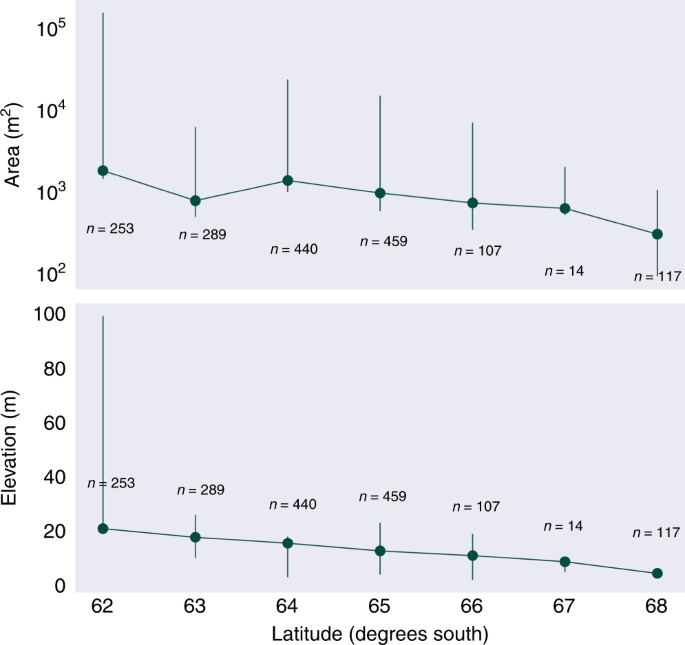
Mean green bloom area averaged per degree latitude with logarithmic area scale. Mean bloom elevation above sea level averaged per degree latitude. Error bars report range (minimum and maximum values).
Recommend
About Joyk
Aggregate valuable and interesting links.
Joyk means Joy of geeK