

Hunting down a C memory leak in a Go program
source link: https://medium.com/zendesk-engineering/hunting-down-a-c-memory-leak-in-a-go-program-2d08b24b617d
Go to the source link to view the article. You can view the picture content, updated content and better typesetting reading experience. If the link is broken, please click the button below to view the snapshot at that time.
Hunting down a C memory leak in a Go program
A story of metrics, confusion, and eBPF.
Introduction
Over the last few years at Zendesk, both Go and Kafka have been increasingly growing in importance in our architecture. It was of course inevitable that they should meet, and so various teams have been writing Kafka consumers and producers in Go of late. There are a few different library options for building Kafka apps in Go, but we’ve been trying to standardise on using confluent-kafka-go, which is built on the official librdkafka C library using the cgo package. Leveraging the existing C library means that it gets support for bug fixes and new broker features alongside all other language bindings.
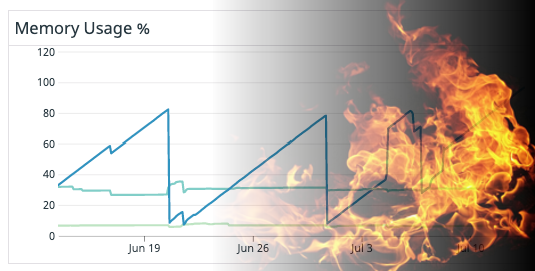
Of course, with the good parts of C (sharing common functionality between languages), come the bad parts of C (debugging memory issues….). Shortly after deploying our first high-volume consumer (called the frontend-event-ingestor) to production, we saw what was absolutely, unambiguously a memory leak. The linear increases in the graph show the application leaking memory at a constant rate, whilst the sharp decreases represent our app being deployed — or, even worse — killed by the Linux Out-of-Memory (OOM) Killer. A graph like that usually means we’re in for a fun time!
The first thing to check was that this leak was, in fact, caused by the C parts of our program, and not the Go parts. We collect expvar metrics from all our Go apps, and these include memstats memory allocator statistics. From here, we could see that the increase in total app memory usage (the resident set size (RSS) value as measured by the operating system) was not matched by a corresponding increase in the Go memstats allocated size. This means that the memory usage must have been coming from the C part of the program, and not the Go part.

So, the next question is… what to do about it?
But is it actually a leak?
We’ve been burned a few times before hunting memory leaks that were not, in fact, memory leaks. Sometimes, memory fragmentation can manifest itself as increasing memory usage over time. Another issue we’ve seen is lazy memory reclamation by the kernel causing apps to report an increasing memory usage trend.
To rule these things out, it was helpful to get some metrics from closer to the source of the actual malloc and free calls in the application. The jemalloc memory allocator is a replacement for the malloc implementation built into the C library, and supports extracting metrics including the total amount of memory currently allocated. We linked jemalloc into our Go program and exported its metrics into our metric system by adding something like the following to our project.
By looking at the value of the jemalloc_active expvar metric, we could see that the increase in total app memory usage really was coming from an increase in memory allocated by jemalloc.

Valgrind
Once we knew there was a memory leak, it was time to go rifling through the toolbox. Valgrind is a tool commonly used for finding memory-related bugs in C programs, and we figured it would probably work for C code embedded in Go as well. We installed Valgrind into the container running our app on our staging environment, and ran the application through Valgrind:
valgrind --leak-check=full --show-leak-kinds=all --verbose /path/to/our/application
We kept the app running for a while, waiting until our metrics indicated that the memory usage was growing as above. Then, when we terminated the program, Valgrind printed a ton of output, showing where it had thought leaks occurred. Most of it looked like this:
A short sample of a huge amount of Valgrind outputUnfortunately, this accounted in total for very little memory (kilobytes) compared to what our metrics were saying we were leaking (tens of megabytes). Furthermore, all of that looks to be static, global data allocated on initialization by, for example, OpenSSL or the dynamic linker. This is not a real leak, because this memory will only get allocated once when the program first calls e.g. OpenSSL, and so won’t manifest as a consistently increasing memory usage like we see with our metrics.
What this means is one of two things
- The memory being leaked is invisible to Valgrind. Valgrind works by overriding the standard
malloc/freefamily of functions with it’s own, tracing versions. If memory is allocated in another way (bymmap MAP_ANONYMOUS, for example), then this won’t be seen by Valgrind. This is unlikely because neither our app nor librdkafka make direct calls tommap. - Our app is actually correctly freeing it’s “leaked” memory before it exits. Valgrind produces its leak report at the end of program execution by comparing what it gave out by
mallocto what it received back byfree, and printing out any unpairedmallocinvocations. However, if our app actually does callfreeon all its memory before terminating, then Valgrind won’t see a leak, even if the actual amount of memory first allocated is totally unbounded!
It seemed almost certain that option 2 was what we had. Our app was allocating unbounded amounts of memory, but not actually losing track of it. The problem remains — what’s allocating this memory, and what’s in it?
Userspace eBPF tracing
There’s been lots of excitement over the last few years about getting rich observeability insights for apps using Linux’s perf_events and eBPF (extended Berkeley Packet Filter — the name has only historical significance). Since we were otherwise at a complete loss, we decided to have a look into the whole eBPF thing and see how it could help us.
These two tools are both incredibly powerful and allow one to measure nearly any aspect of a running Linux system. The perf_event system can collect information about a huge range of interesting performance related events, even down to the level of individual function calls, and call a user-supplied eBPF program in response.
These are both very low level capabilities, but thankfully some clever people have synthesised them into some easier to use tools. One such tool, bpftrace, is what ultimately helped us figure out our memory issue. Bpftrace is both a high-level language for writing eBPF programs, as well as a tool for attaching those programs to tracepoints in your code.
What we wanted to do with bpftrace was:
- Insert the allocated address and calling stack into a map when memory is allocated.
- Remove the entry from the map when memory is freed,
- Periodically print out the stacks which had allocated memory but not yet freed it.
Importantly, unlike Valgrind, which only reported on leaked memory at program exit, we would be able to print out allocations which hadn’t been freed while our app was running. Thus, our little tracer wouldn’t be fooled by the fact that the app does, eventually, free the memory.
Adding userspace trace points
In librdkafka (recall, the C library our kafka consumer app is based on), all memory management already goes through a small set of functions like rd_malloc & rd_free. So, we modified the source code for librdkafka to insert user-space dynamic tracing (USDT) probes into those functions, using some macros provided by the SystemTap package.
At build time, those macros compile down to a single nop instruction (and a note elsewhere in the binary with the name of the probe). So, when not actually performing any tracing, the probe has zero cost. When we use a tool like bpftrace to enable the probe, and attach an eBPF program to it, the kernel will dynamically replace the nop with a trap which calls through to the attached program. That’s not free, but it’s still plenty efficient for our purposes.
And finally, whilst we were building librdkafka from source, we also used the compiler flag -fno-omit-frame-pointer — this turns out to be necessary to get accurate stack traces of application code when using eBPF.
We then deployed our application container to both our staging and production environments with these probes embedded (hey, they’re zero cost when unused, right!)
A bpftrace program for leak hunting
With our probes embedded, we then wrote a simple bpftrace script for printing out allocations which haven’t been freed¹.
The bpftrace program we wrote. Add to a map in rd_malloc, remove from it in rd_free.The bpftrace documentation explains this syntax in detail, but at a high level:
- When the
rd_malloctracepoint is hit, insert the current stack and current time into two maps, keyed by the address of the allocated memory (arg0). - When the
rd_freetracepoint is hit, remove the entries for the freed memory from the two maps. - You’ll note there’s no code for outputting these maps — by default, bpftrace will simply dump the contents of all maps when it exits, which is handy if you don’t need anything fancier.
Actually running this program in our staging environment was a bit of a chore. At Zendesk, we run almost all of our workloads, including this Kafka consumer, in Kubernetes. Bpftrace needs two things to be able to run from inside a container like we were attempting to do.
- It needs access to the kernel headers for the running kernel version on the Kubernetes node, which may well not be the same as any kernel-headers package installed in the container (the container could even be running a totally different Linux distribution!).
- Loading eBPF programs into the kernel requires the
CAP_BPF&CAP_PERFMONprivileges, which are not normally given to Kubernetes containers by default.
We solved the first problem by simply running modprobe kheaders on the Kubernetes node our app was running on. The kheaders module provides access to a tarball containing the kernel headers through a special file /sys/kernel/kheaders.tar.xz, which is available both on the node and in containers too. Bpftrace knows how to use this file to extract the kernel headers it needs.
We “fixed” the second issue by simply running our container in Kubernetes with privileged mode enabled, which is a definite no in production, but acceptable for staging. (If we ever need to run this kind of tracing in production, we would probably have bpftrace running on the node, rather than actually in the container — anyway, a problem for another time.)
With these impediments out of the way, we were able to run our program!
/usr/local/bin/bpftrace -p <our-app-pid> bpf_program > bpfout
And, after letting it run for a while, we got some output. Exciting!
The raw output we got from bpftrace. Each section is the call stack for a single call to rd_malloc.Post Processing
Whilst it’s exciting that we got a big list of call stack addresses responsible for allocations, what we actually want is what lines of code are involved. Converting code addresses to filenames/line numbers in the general case requires parsing the DWARF debugging data embedded in a binary. This is not something that bpftrace can currently do (although there is some work in progress).
To work around this, we wrote a very hacky ruby script to use gdb to convert addresses to function names/line numbers (and also to sort the allocations with the earliest first). Once that was done, we had exactly what we were looking for — a list of the memory allocations in librdkafka that had not yet been freed! A quick visual inspection of the oldest ones (and so the most likely to be part of our leak) showed they were all allocated through very similar code paths — this was exactly what we needed to progress our investigation.
Fixing the issue
Once we could see where the leaked memory was being allocated, it was very easy to deduce what kind of object was being leaked. It turned out that librdkafka was generating an event every time it received an OffsetCommitResponse from the Kafka broker (which, with our auto-commit interval set to 5 seconds, was pretty often), and placing it in a queue for our app to handle. However, our application was not actually handling events from that queue, so the size of that queue grew without bound. When we correctly destroy the librdkafka handle during app shutdown, however, all the memory from this queue gets released: Valgrind never saw a leak.
To fix this, all we needed to do was consume those events and throw them away — this turned out to be a three line code change! The results were pretty dramatic:

(Sidebar — this is why unbounded queue sizes of any kind are hugely dangerous. A nice log message warning us that the queue was full and events were being discarded would have been much easier to debug!)
What we learned
Hunting this leak down took a huge amount of time from a number of engineers. This leak was slow enough that we probably could have hacked around the issue by restarting the process on a timer, and gotten on with our lives. However, what we learned through this process was worth every second we spent on it and then some!
Firstly, we now know way more about the internals of librdkafka. We’re far from experts in it, but we’ve read, traced, and squinted at a whole bunch of the code now, which is a lot more than we could say before! Librdkafka is going to be a pretty critical dependency for a large number of applications at Zendesk (and not just Go ones!), so having this knowledge on staff will help us fix other issues as they crop up as well. It will also make it a much easier sell to migrate other apps off of other Go Kafka implementations.
More generally, this whole process gave our team some exposure to a raft of tools that we can use to solve other problems that may not even be related to memory leaks at all. There are a ton of interesting performance tracing and debugging uses for bpftrace & other eBPF based tools, so now that we have this hammer we’ll be on the lookout for nails to whack with it!
Finally, we learned that we work at an awesome company that gives us the time and space to go deep on problems like this one when the need arises (OK — we already knew this 😜). If this all sounds like something you’d be interested in, come join us at Zendesk — we’re hiring!
Footnotes
[1] The astute amongst you may have noticed that this bpftrace program is essentially a simple version of the memleak.py script included in BCC (BPF Compiler Collection). We didn’t know about that. Now we do. You should use memleak.py instead of our shonky version.
Recommend
About Joyk
Aggregate valuable and interesting links.
Joyk means Joy of geeK