

Java Performance Analysis on Linux with Flame Graphs
source link: https://www.slideshare.net/brendangregg/java-performance-analysis-on-linux-with-flame-graphs
Go to the source link to view the article. You can view the picture content, updated content and better typesetting reading experience. If the link is broken, please click the button below to view the snapshot at that time.

Java Performance Analysis on Linux with Flame Graphs
- 1. Sep 2016 Java Performance Analysis on Linux with Flame Graphs Brendan Gregg Senior Performance Architect
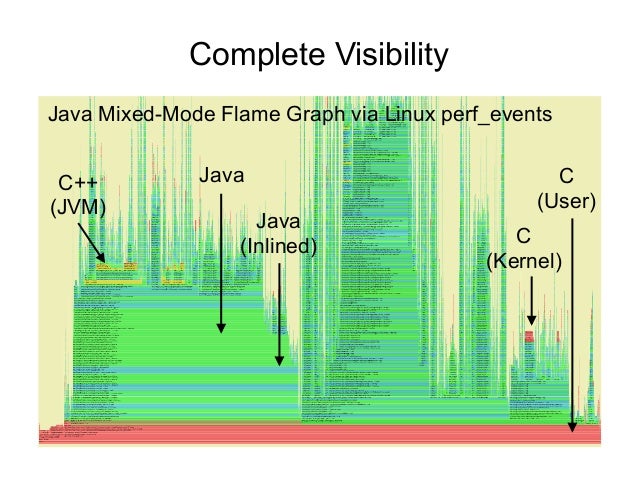
- 2. Complete Visibility C (Kernel) C++ (JVM) Java Java (Inlined) C (User) Java Mixed-Mode Flame Graph via Linux perf_events
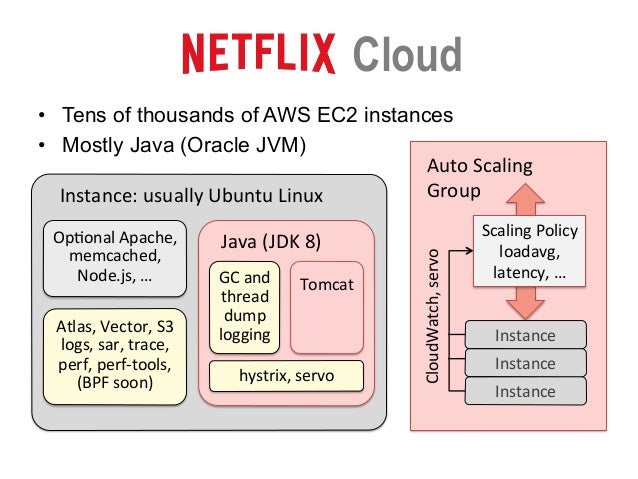
- 3. Cloud • Tens of thousands of AWS EC2 instances • Mostly Java (Oracle JVM) Instance: usually Ubuntu Linux Java (JDK 8) Tomcat GC and thread dump logging hystrix, servo OpJonal Apache, memcached, Node.js, … Atlas, Vector, S3 logs, sar, trace, perf, perf-tools, (BPF soon) Instance Scaling Policy loadavg, latency, … CloudWatch, servo Auto Scaling Group Instance Instance
- 4. The Problem with Profilers
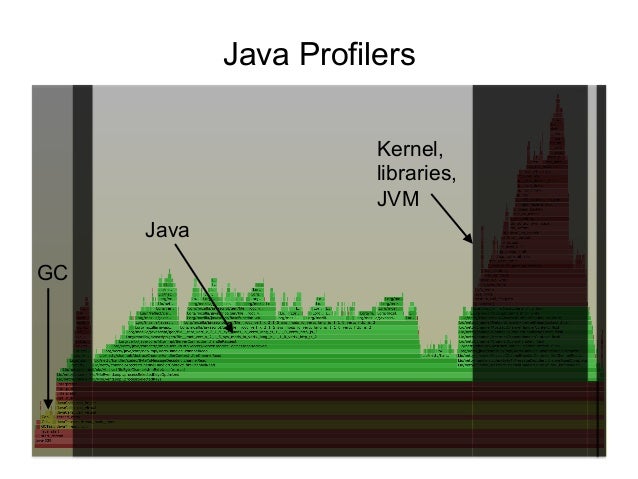
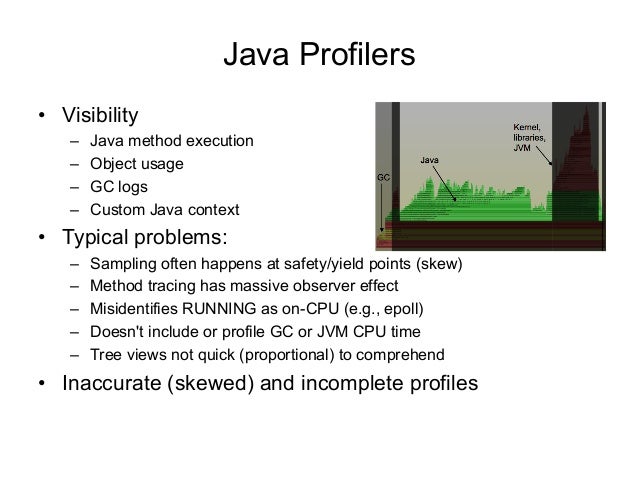
- 5. Java Profilers Java GC Kernel, libraries, JVM
- 6. Java Profilers • Visibility – Java method execution – Object usage – GC logs – Custom Java context • Typical problems: – Sampling often happens at safety/yield points (skew) – Method tracing has massive observer effect – Misidentifies RUNNING as on-CPU (e.g., epoll) – Doesn't include or profile GC or JVM CPU time – Tree views not quick (proportional) to comprehend • Inaccurate (skewed) and incomplete profiles
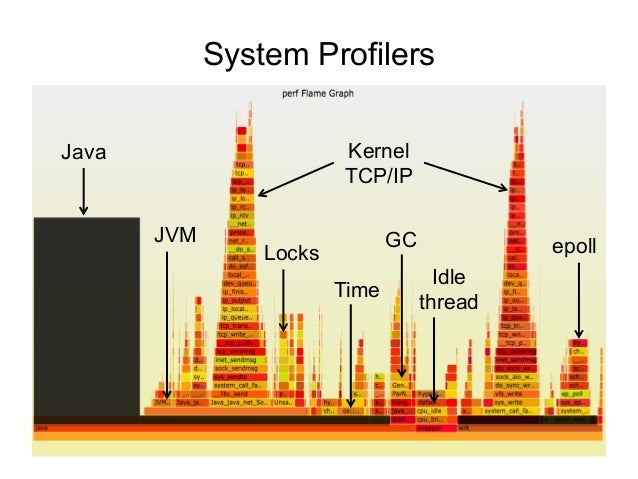
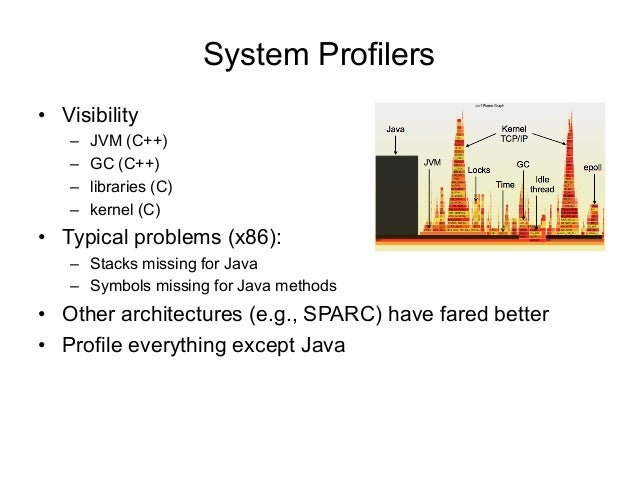
- 7. System Profilers Java Kernel TCP/IP GC Idle thread Time Locks epoll JVM
- 8. System Profilers • Visibility – JVM (C++) – GC (C++) – libraries (C) – kernel (C) • Typical problems (x86): – Stacks missing for Java – Symbols missing for Java methods • Other architectures (e.g., SPARC) have fared better • Profile everything except Java
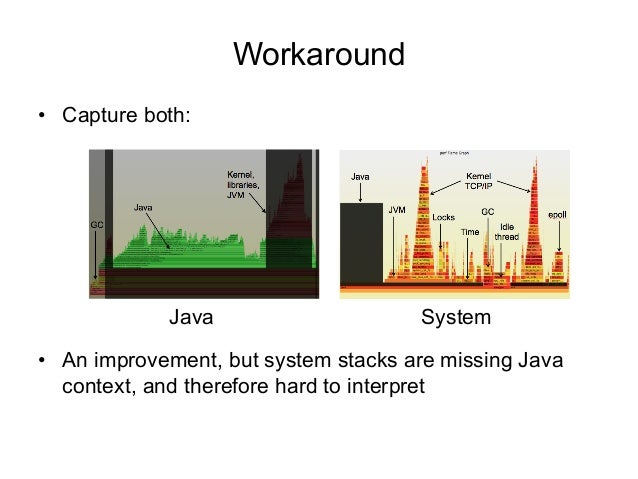
- 9. Workaround • Capture both: • An improvement, but system stacks are missing Java context, and therefore hard to interpret Java System
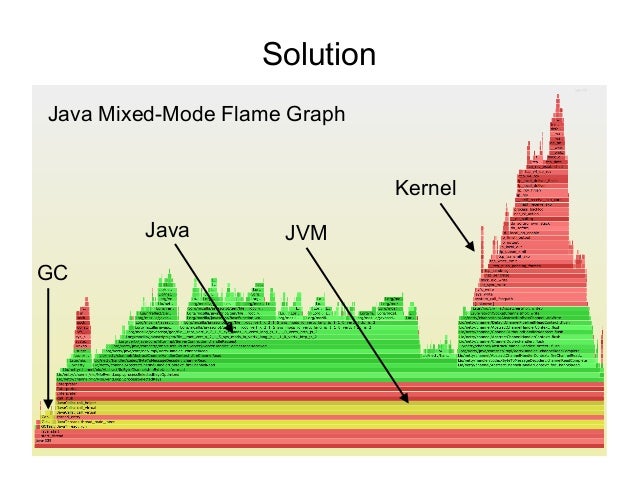
- 10. Java Mixed-Mode Flame Graph Solution Java JVM Kernel GC
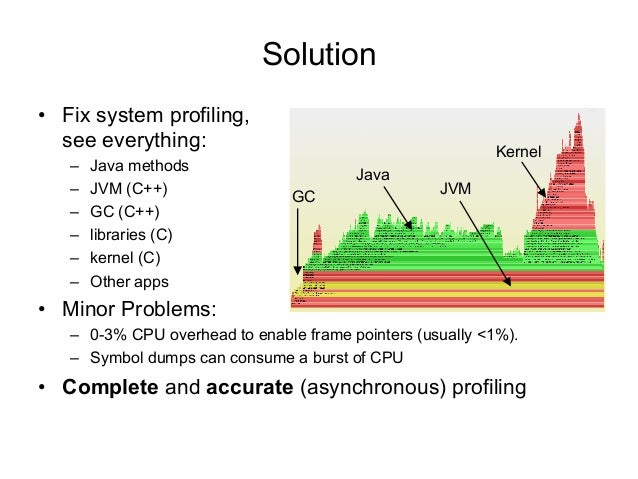
- 11. Solution • Fix system profiling, see everything: – Java methods – JVM (C++) – GC (C++) – libraries (C) – kernel (C) – Other apps • Minor Problems: – 0-3% CPU overhead to enable frame pointers (usually <1%). – Symbol dumps can consume a burst of CPU • Complete and accurate (asynchronous) profiling Java JVM Kernel GC
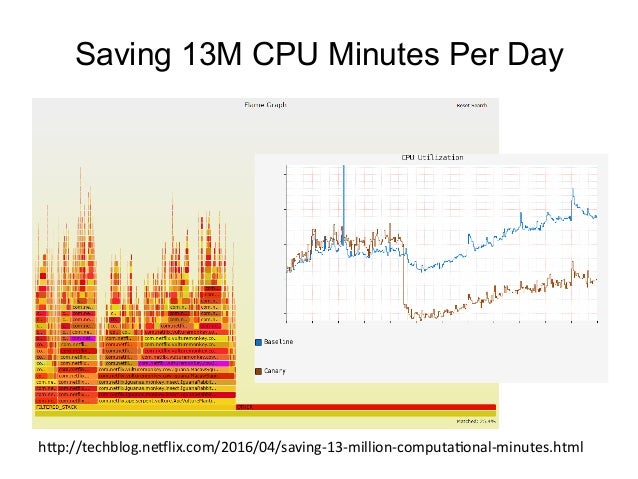
- 12. Saving 13M CPU Minutes Per Day • eu hXp://techblog.neZlix.com/2016/04/saving-13-million-computaJonal-minutes.html
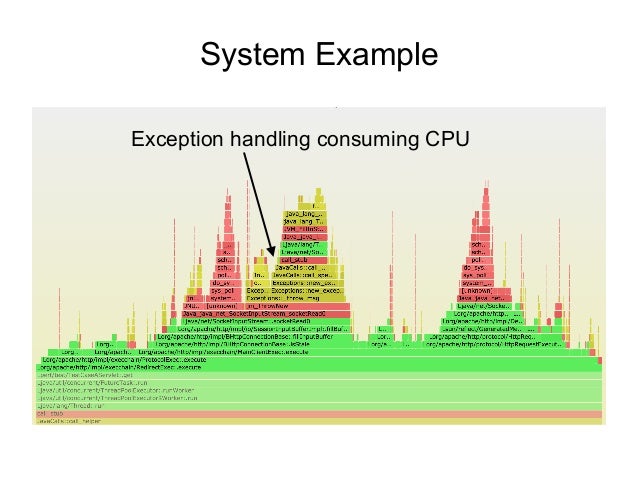
- 13. System Example Exception handling consuming CPU
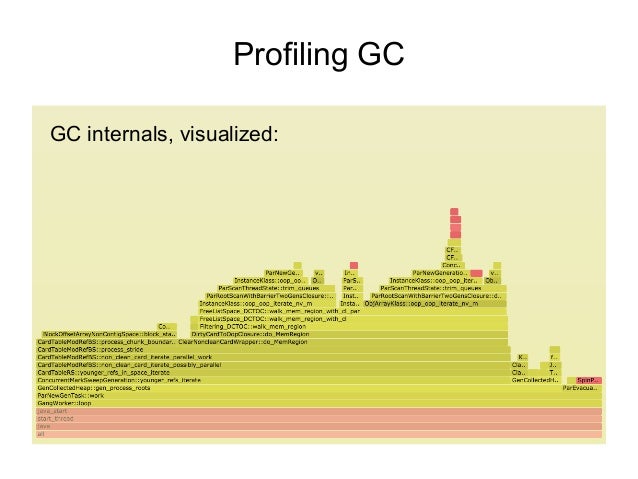
- 14. Profiling GC GC internals, visualized:
- 15. CPU Profiling
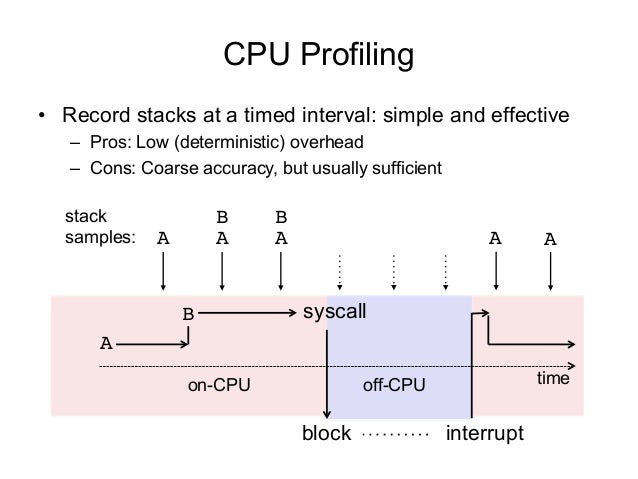
- 16. CPU Profiling A B block interrupt on-CPU off-CPU A B A A B A syscall time • Record stacks at a timed interval: simple and effective – Pros: Low (deterministic) overhead – Cons: Coarse accuracy, but usually sufficient stack samples: A
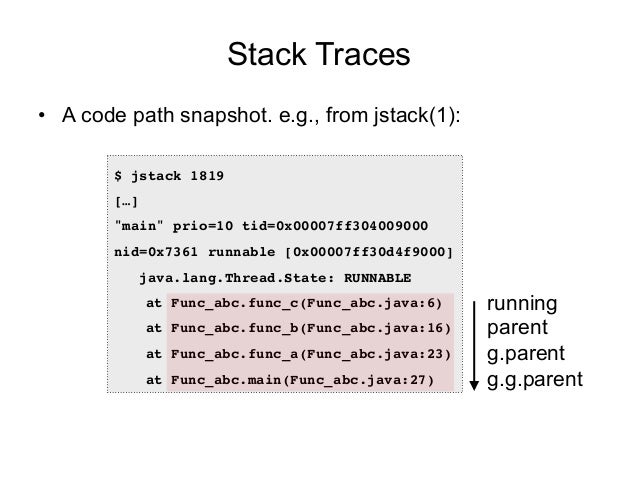
- 17. Stack Traces • A code path snapshot. e.g., from jstack(1): $ jstack 1819 […] "main" prio=10 tid=0x00007ff304009000 nid=0x7361 runnable [0x00007ff30d4f9000] java.lang.Thread.State: RUNNABLE at Func_abc.func_c(Func_abc.java:6) at Func_abc.func_b(Func_abc.java:16) at Func_abc.func_a(Func_abc.java:23) at Func_abc.main(Func_abc.java:27) running parent g.parent g.g.parent
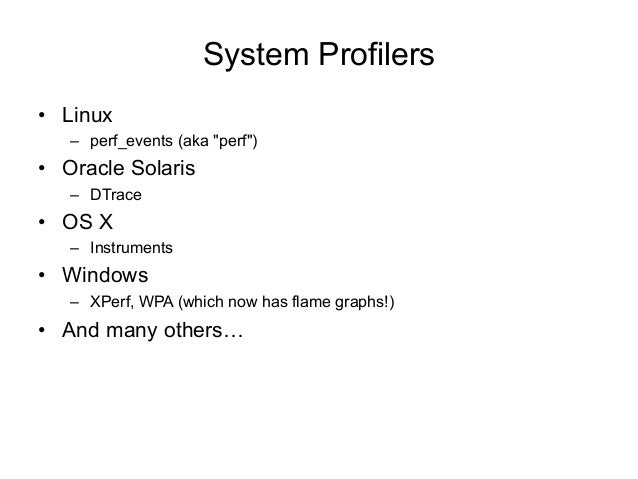
- 18. System Profilers • Linux – perf_events (aka "perf") • Oracle Solaris – DTrace • OS X – Instruments • Windows – XPerf, WPA (which now has flame graphs!) • And many others…
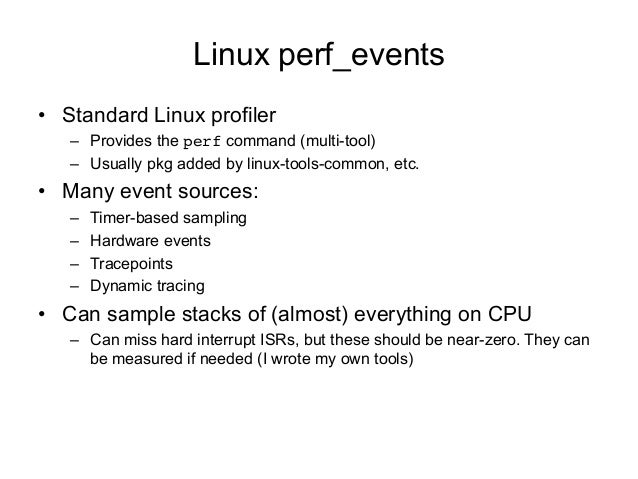
- 19. Linux perf_events • Standard Linux profiler – Provides the perf command (multi-tool) – Usually pkg added by linux-tools-common, etc. • Many event sources: – Timer-based sampling – Hardware events – Tracepoints – Dynamic tracing • Can sample stacks of (almost) everything on CPU – Can miss hard interrupt ISRs, but these should be near-zero. They can be measured if needed (I wrote my own tools)
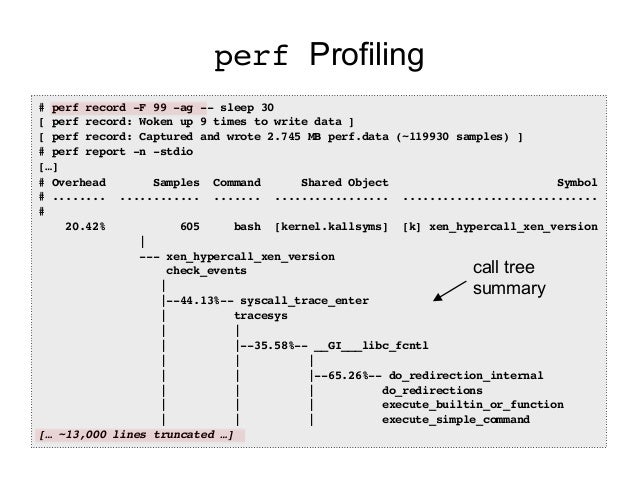
- 20. perf Profiling # perf record -F 99 -ag -- sleep 30 [ perf record: Woken up 9 times to write data ] [ perf record: Captured and wrote 2.745 MB perf.data (~119930 samples) ] # perf report -n -stdio […] # Overhead Samples Command Shared Object Symbol # ........ ............ ....... ................. ............................. # 20.42% 605 bash [kernel.kallsyms] [k] xen_hypercall_xen_version | --- xen_hypercall_xen_version check_events | |--44.13%-- syscall_trace_enter | tracesys | | | |--35.58%-- __GI___libc_fcntl | | | | | |--65.26%-- do_redirection_internal | | | do_redirections | | | execute_builtin_or_function | | | execute_simple_command [… ~13,000 lines truncated …] call tree summary
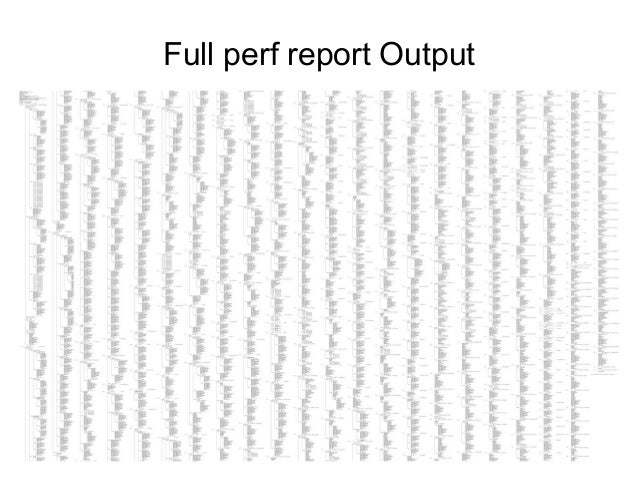
- 21. Full perf report Output
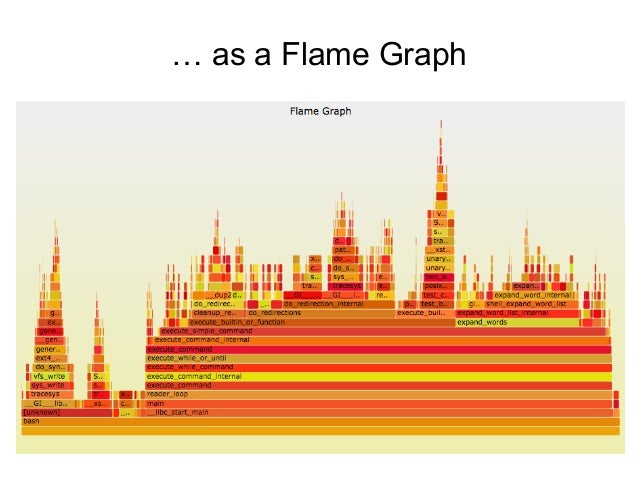
- 22. … as a Flame Graph
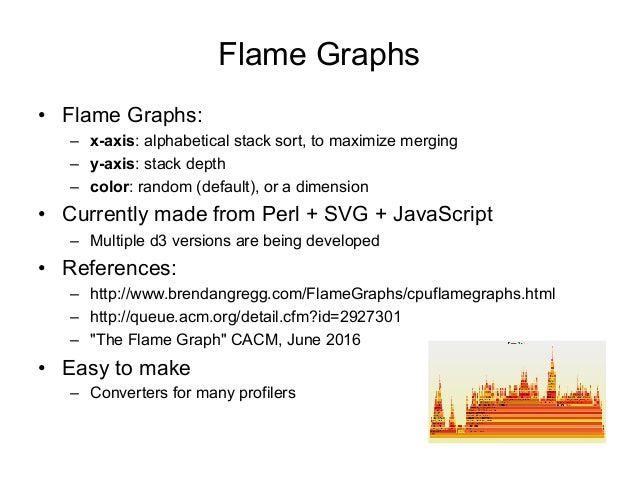
- 23. Flame Graphs • Flame Graphs: – x-axis: alphabetical stack sort, to maximize merging – y-axis: stack depth – color: random (default), or a dimension • Currently made from Perl + SVG + JavaScript – Multiple d3 versions are being developed • References: – http://www.brendangregg.com/FlameGraphs/cpuflamegraphs.html – http://queue.acm.org/detail.cfm?id=2927301 – "The Flame Graph" CACM, June 2016 • Easy to make – Converters for many profilers
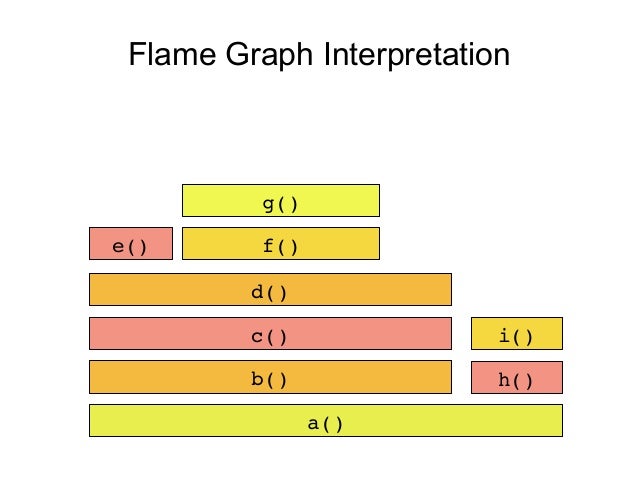
- 24. Flame Graph Interpretation a() b() h() c() d() e() f() g() i()
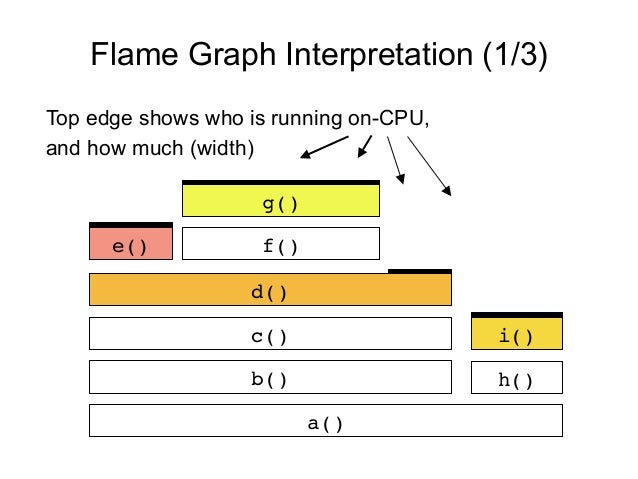
- 25. Flame Graph Interpretation (1/3) Top edge shows who is running on-CPU, and how much (width) a() b() h() c() d() e() f() g() i()
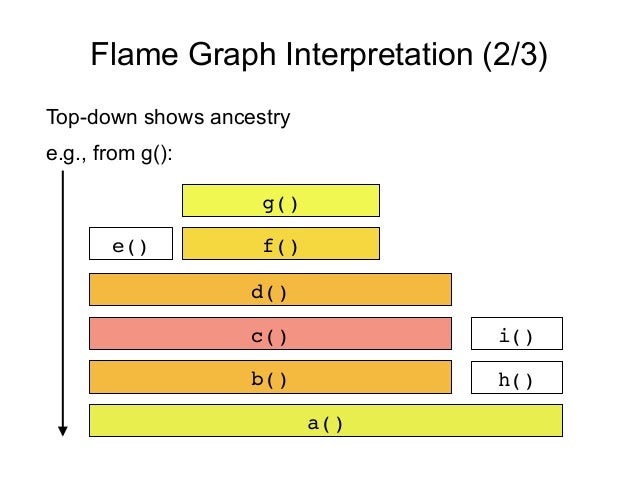
- 26. Flame Graph Interpretation (2/3) Top-down shows ancestry e.g., from g(): h() d() e() i() a() b() c() f() g()
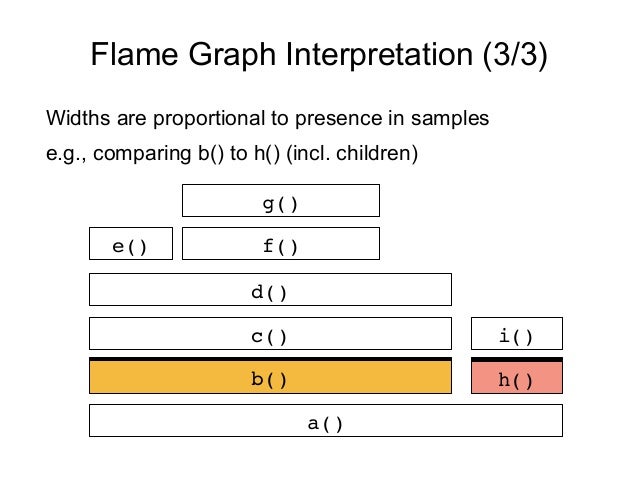
- 27. Flame Graph Interpretation (3/3) a() b() h() c() d() e() f() g() i() Widths are proportional to presence in samples e.g., comparing b() to h() (incl. children)
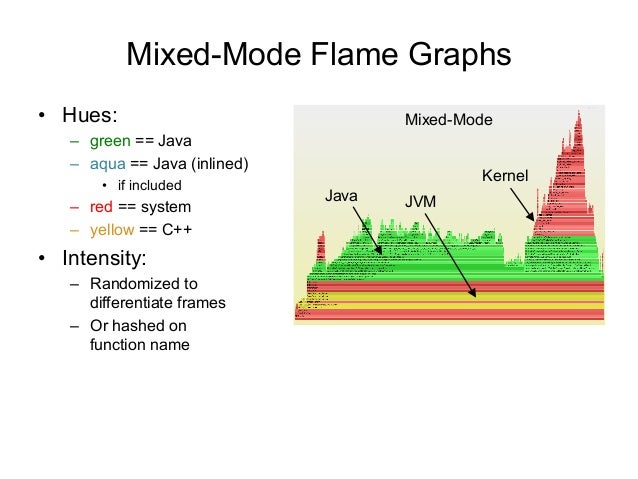
- 28. Mixed-Mode Flame Graphs • Hues: – green == Java – aqua == Java (inlined) • if included – red == system – yellow == C++ • Intensity: – Randomized to differentiate frames – Or hashed on function name Java JVM Kernel Mixed-Mode
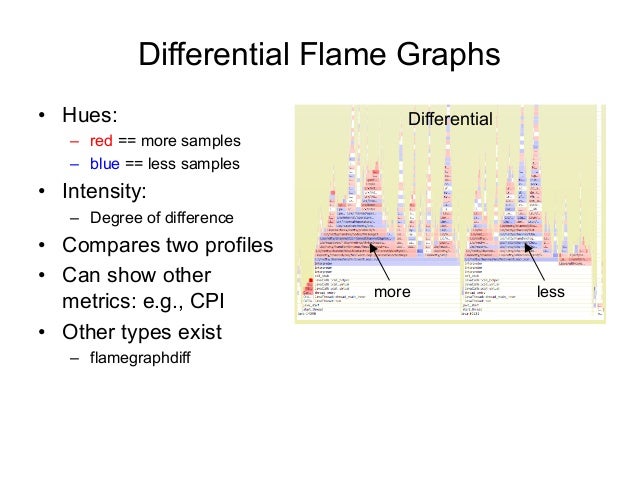
- 29. Differential Flame Graphs • Hues: – red == more samples – blue == less samples • Intensity: – Degree of difference • Compares two profiles • Can show other metrics: e.g., CPI • Other types exist – flamegraphdiff Differential more less
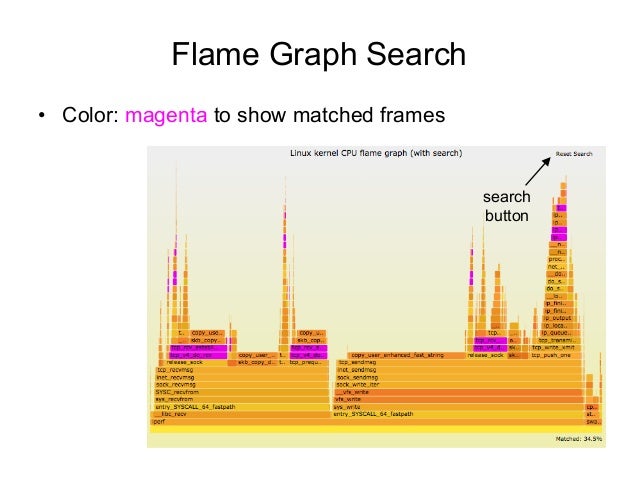
- 30. Flame Graph Search • Color: magenta to show matched frames search button
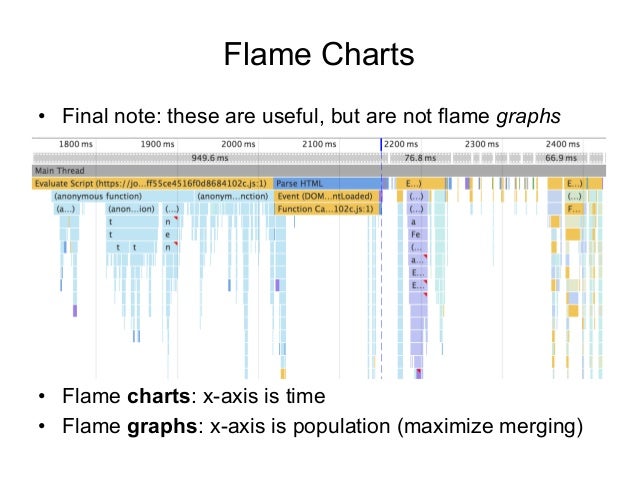
- 31. Flame Charts • Flame charts: x-axis is time • Flame graphs: x-axis is population (maximize merging) • Final note: these are useful, but are not flame graphs
- 32. Stack Tracing
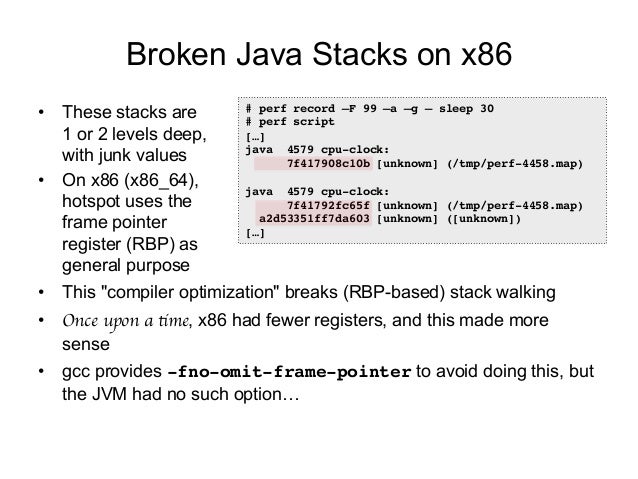
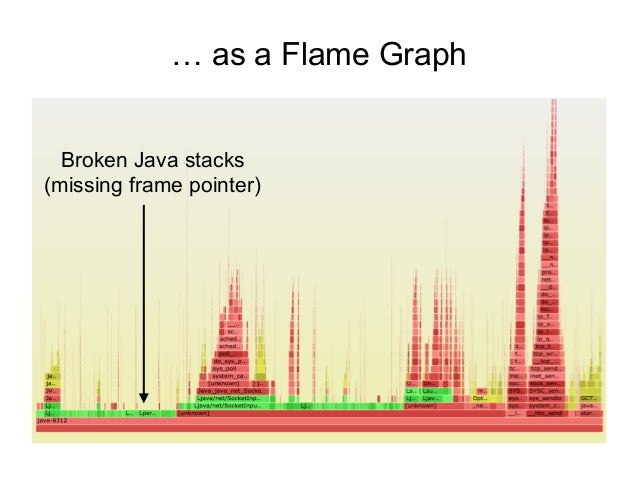
- 33. Broken Java Stacks on x86 • These stacks are 1 or 2 levels deep, with junk values • On x86 (x86_64), hotspot uses the frame pointer register (RBP) as general purpose • This "compiler optimization" breaks (RBP-based) stack walking • Once upon a time, x86 had fewer registers, and this made more sense • gcc provides -fno-omit-frame-pointer to avoid doing this, but the JVM had no such option… # perf record –F 99 –a –g – sleep 30 # perf script […] java 4579 cpu-clock: 7f417908c10b [unknown] (/tmp/perf-4458.map) java 4579 cpu-clock: 7f41792fc65f [unknown] (/tmp/perf-4458.map) a2d53351ff7da603 [unknown] ([unknown]) […]
- 34. … as a Flame Graph Broken Java stacks (missing frame pointer)
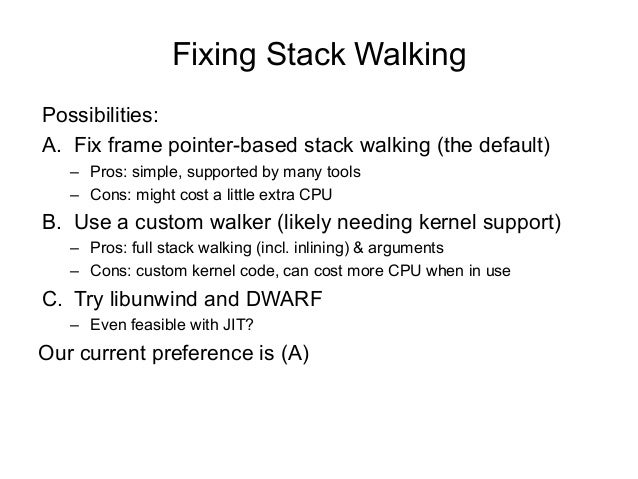
- 35. Fixing Stack Walking Possibilities: A. Fix frame pointer-based stack walking (the default) – Pros: simple, supported by many tools – Cons: might cost a little extra CPU B. Use a custom walker (likely needing kernel support) – Pros: full stack walking (incl. inlining) & arguments – Cons: custom kernel code, can cost more CPU when in use C. Try libunwind and DWARF – Even feasible with JIT? Our current preference is (A)
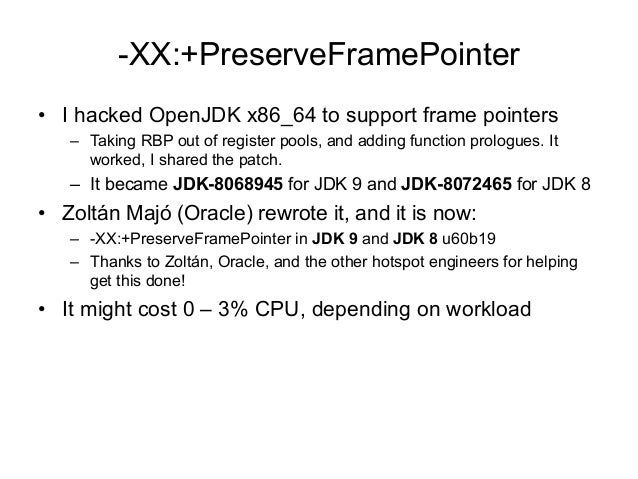
- 36. -XX:+PreserveFramePointer • I hacked OpenJDK x86_64 to support frame pointers – Taking RBP out of register pools, and adding function prologues. It worked, I shared the patch. – It became JDK-8068945 for JDK 9 and JDK-8072465 for JDK 8 • Zoltán Majó (Oracle) rewrote it, and it is now: – -XX:+PreserveFramePointer in JDK 9 and JDK 8 u60b19 – Thanks to Zoltán, Oracle, and the other hotspot engineers for helping get this done! • It might cost 0 – 3% CPU, depending on workload
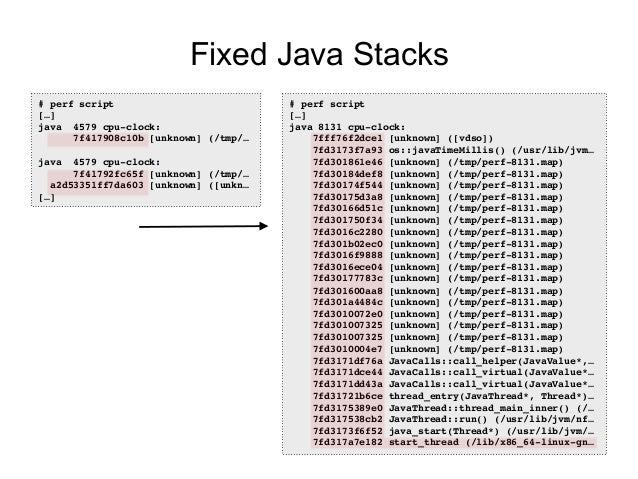
- 37. Fixed Java Stacks # perf script […] java 8131 cpu-clock: 7fff76f2dce1 [unknown] ([vdso]) 7fd3173f7a93 os::javaTimeMillis() (/usr/lib/jvm… 7fd301861e46 [unknown] (/tmp/perf-8131.map) 7fd30184def8 [unknown] (/tmp/perf-8131.map) 7fd30174f544 [unknown] (/tmp/perf-8131.map) 7fd30175d3a8 [unknown] (/tmp/perf-8131.map) 7fd30166d51c [unknown] (/tmp/perf-8131.map) 7fd301750f34 [unknown] (/tmp/perf-8131.map) 7fd3016c2280 [unknown] (/tmp/perf-8131.map) 7fd301b02ec0 [unknown] (/tmp/perf-8131.map) 7fd3016f9888 [unknown] (/tmp/perf-8131.map) 7fd3016ece04 [unknown] (/tmp/perf-8131.map) 7fd30177783c [unknown] (/tmp/perf-8131.map) 7fd301600aa8 [unknown] (/tmp/perf-8131.map) 7fd301a4484c [unknown] (/tmp/perf-8131.map) 7fd3010072e0 [unknown] (/tmp/perf-8131.map) 7fd301007325 [unknown] (/tmp/perf-8131.map) 7fd301007325 [unknown] (/tmp/perf-8131.map) 7fd3010004e7 [unknown] (/tmp/perf-8131.map) 7fd3171df76a JavaCalls::call_helper(JavaValue*,… 7fd3171dce44 JavaCalls::call_virtual(JavaValue*… 7fd3171dd43a JavaCalls::call_virtual(JavaValue*… 7fd31721b6ce thread_entry(JavaThread*, Thread*)… 7fd3175389e0 JavaThread::thread_main_inner() (/… 7fd317538cb2 JavaThread::run() (/usr/lib/jvm/nf… 7fd3173f6f52 java_start(Thread*) (/usr/lib/jvm/… 7fd317a7e182 start_thread (/lib/x86_64-linux-gn… # perf script […] java 4579 cpu-clock: 7f417908c10b [unknown] (/tmp/… java 4579 cpu-clock: 7f41792fc65f [unknown] (/tmp/… a2d53351ff7da603 [unknown] ([unkn… […]
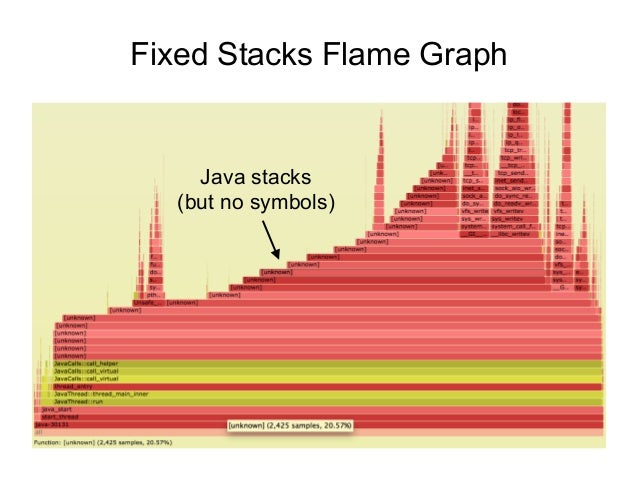
- 38. Fixed Stacks Flame Graph Java stacks (but no symbols)
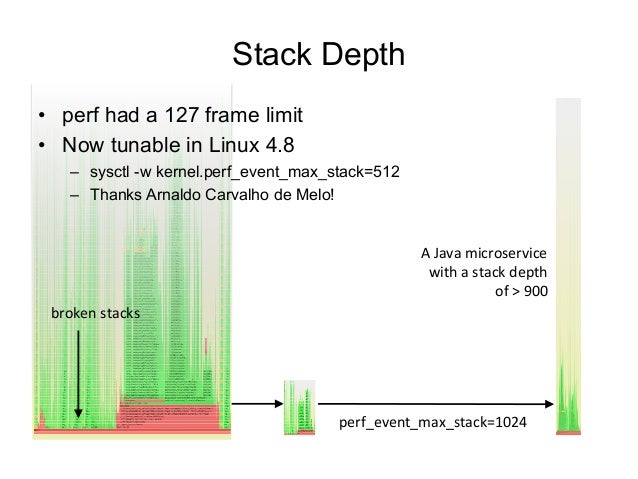
- 39. Stack Depth • perf had a 127 frame limit • Now tunable in Linux 4.8 – sysctl -w kernel.perf_event_max_stack=512 – Thanks Arnaldo Carvalho de Melo! A Java microservice with a stack depth of > 900 broken stacks perf_event_max_stack=1024
- 40. Symbols
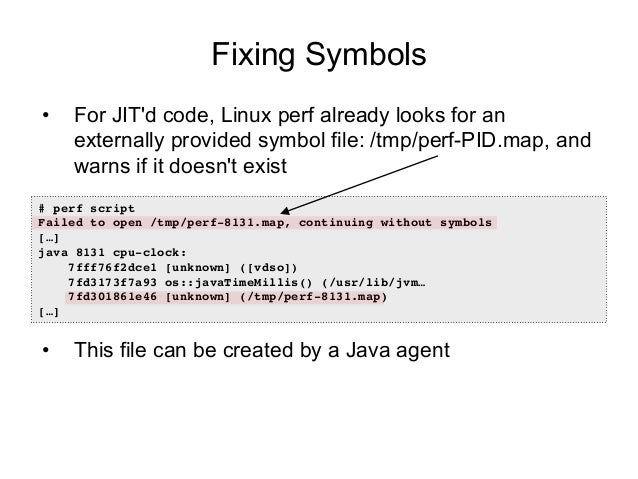
- 41. Fixing Symbols • For JIT'd code, Linux perf already looks for an externally provided symbol file: /tmp/perf-PID.map, and warns if it doesn't exist • This file can be created by a Java agent # perf script Failed to open /tmp/perf-8131.map, continuing without symbols […] java 8131 cpu-clock: 7fff76f2dce1 [unknown] ([vdso]) 7fd3173f7a93 os::javaTimeMillis() (/usr/lib/jvm… 7fd301861e46 [unknown] (/tmp/perf-8131.map) […]
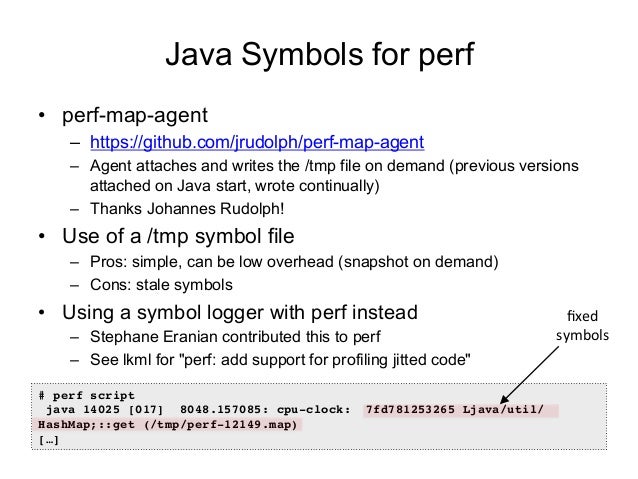
- 42. Java Symbols for perf • perf-map-agent – https://github.com/jrudolph/perf-map-agent – Agent attaches and writes the /tmp file on demand (previous versions attached on Java start, wrote continually) – Thanks Johannes Rudolph! • Use of a /tmp symbol file – Pros: simple, can be low overhead (snapshot on demand) – Cons: stale symbols • Using a symbol logger with perf instead – Stephane Eranian contributed this to perf – See lkml for "perf: add support for profiling jitted code" # perf script java 14025 [017] 8048.157085: cpu-clock: 7fd781253265 Ljava/util/ HashMap;::get (/tmp/perf-12149.map) […] fixed symbols
- 43. Java Mixed-Mode Flame Graph Stacks & Symbols Java JVM Kernel GC
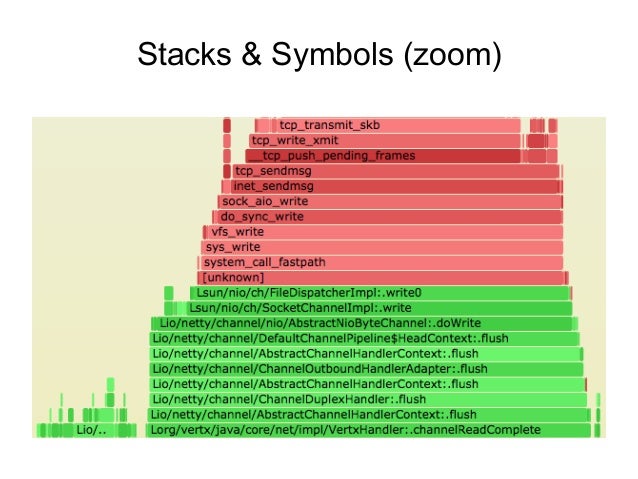
- 44. Stacks & Symbols (zoom)
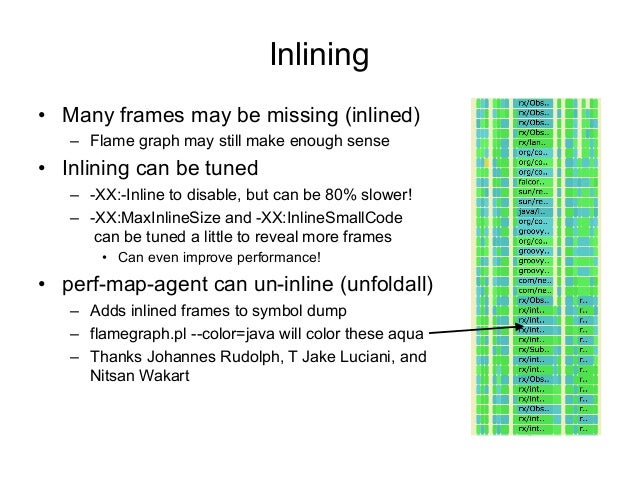
- 45. Inlining • Many frames may be missing (inlined) – Flame graph may still make enough sense • Inlining can be tuned – -XX:-Inline to disable, but can be 80% slower! – -XX:MaxInlineSize and -XX:InlineSmallCode can be tuned a little to reveal more frames • Can even improve performance! • perf-map-agent can un-inline (unfoldall) – Adds inlined frames to symbol dump – flamegraph.pl --color=java will color these aqua – Thanks Johannes Rudolph, T Jake Luciani, and Nitsan Wakart
- 46. Instructions
- 47. Instructions 1. Check Java version 2. Install perf-map-agent 3. Set -XX:+PreserveFramePointer 4. Profile Java 5. Dump symbols 6. Generate Mixed-Mode Flame Graph Note these are unsupported: use at your own risk Reference: http://techblog.netflix.com/2015/07/java-in-flames.html
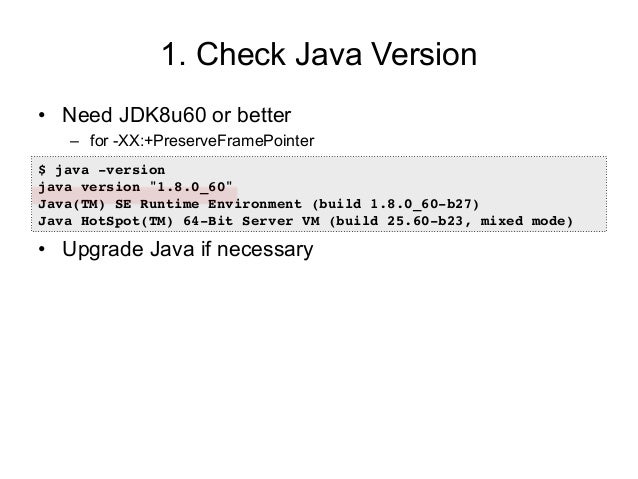
- 48. 1. Check Java Version • Need JDK8u60 or better – for -XX:+PreserveFramePointer • Upgrade Java if necessary $ java -version java version "1.8.0_60" Java(TM) SE Runtime Environment (build 1.8.0_60-b27) Java HotSpot(TM) 64-Bit Server VM (build 25.60-b23, mixed mode)
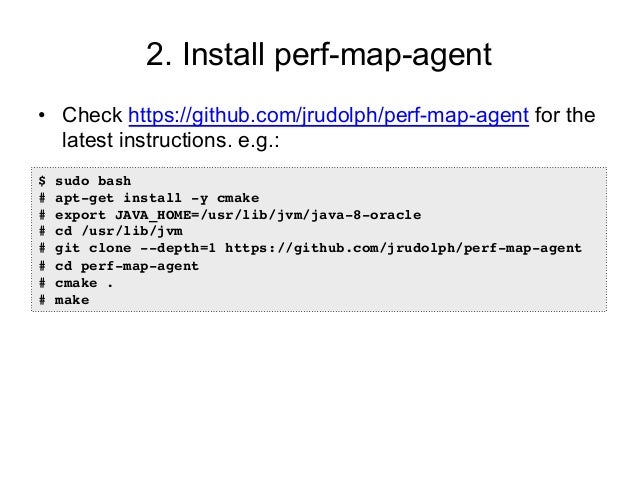
- 49. 2. Install perf-map-agent • Check https://github.com/jrudolph/perf-map-agent for the latest instructions. e.g.: $ sudo bash # apt-get install -y cmake # export JAVA_HOME=/usr/lib/jvm/java-8-oracle # cd /usr/lib/jvm # git clone --depth=1 https://github.com/jrudolph/perf-map-agent # cd perf-map-agent # cmake . # make
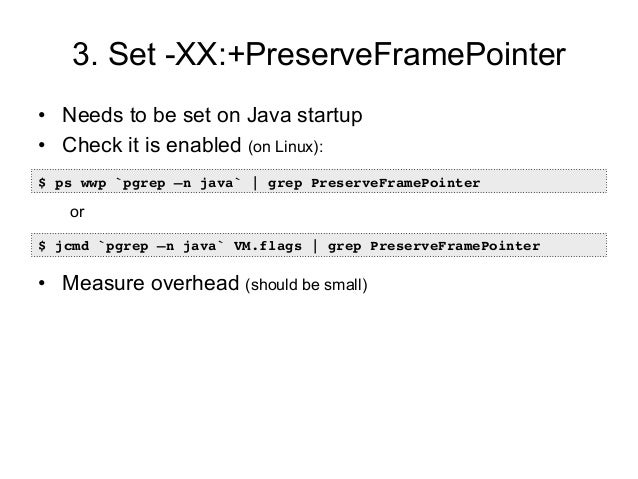
- 50. 3. Set -XX:+PreserveFramePointer • Needs to be set on Java startup • Check it is enabled (on Linux): or • Measure overhead (should be small) $ ps wwp `pgrep –n java` | grep PreserveFramePointer $ jcmd `pgrep –n java` VM.flags | grep PreserveFramePointer
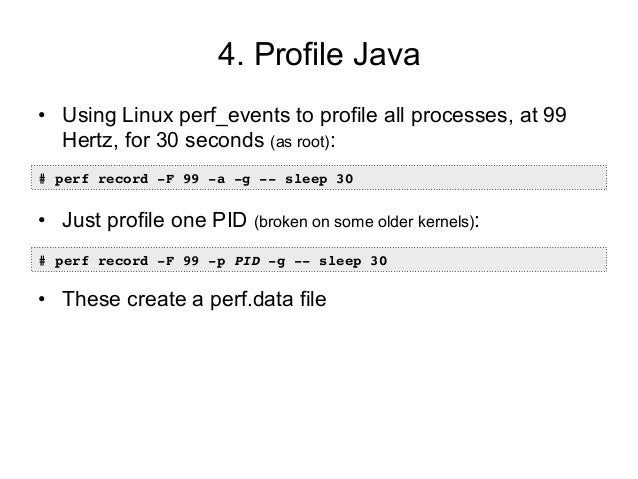
- 51. 4. Profile Java • Using Linux perf_events to profile all processes, at 99 Hertz, for 30 seconds (as root): • Just profile one PID (broken on some older kernels): • These create a perf.data file # perf record -F 99 -a -g -- sleep 30 # perf record -F 99 -p PID -g -- sleep 30
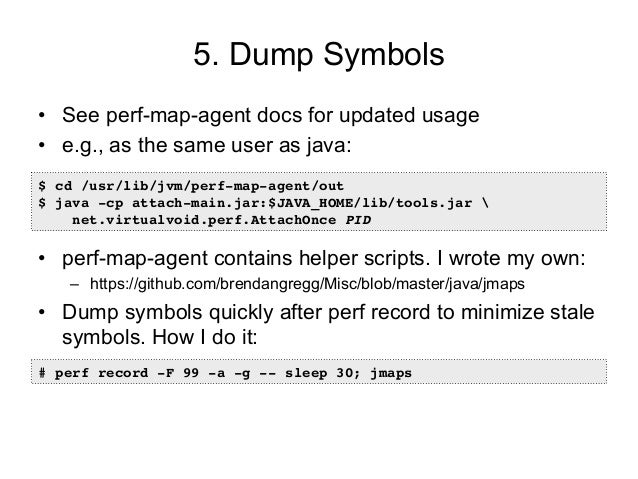
- 52. 5. Dump Symbols • See perf-map-agent docs for updated usage • e.g., as the same user as java: • perf-map-agent contains helper scripts. I wrote my own: – https://github.com/brendangregg/Misc/blob/master/java/jmaps • Dump symbols quickly after perf record to minimize stale symbols. How I do it: $ cd /usr/lib/jvm/perf-map-agent/out $ java -cp attach-main.jar:$JAVA_HOME/lib/tools.jar net.virtualvoid.perf.AttachOnce PID # perf record -F 99 -a -g -- sleep 30; jmaps
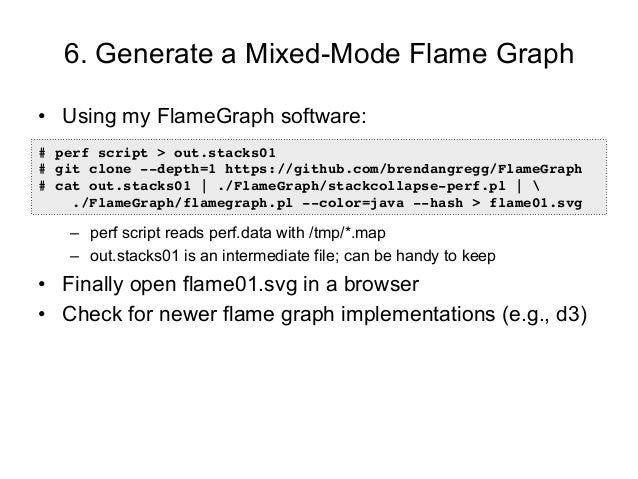
- 53. 6. Generate a Mixed-Mode Flame Graph • Using my FlameGraph software: – perf script reads perf.data with /tmp/*.map – out.stacks01 is an intermediate file; can be handy to keep • Finally open flame01.svg in a browser • Check for newer flame graph implementations (e.g., d3) # perf script > out.stacks01 # git clone --depth=1 https://github.com/brendangregg/FlameGraph # cat out.stacks01 | ./FlameGraph/stackcollapse-perf.pl | ./FlameGraph/flamegraph.pl --color=java --hash > flame01.svg
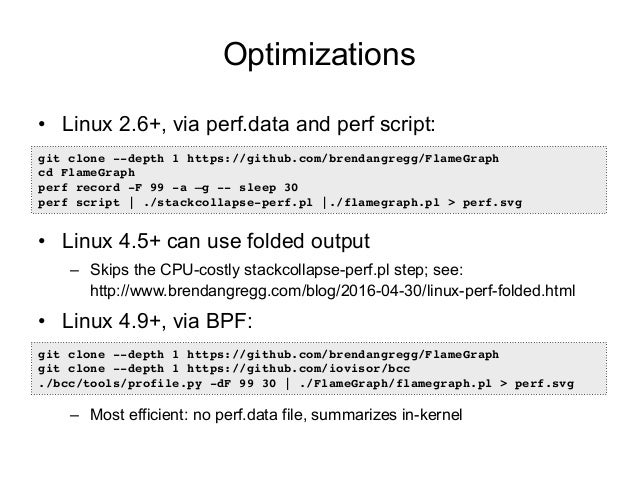
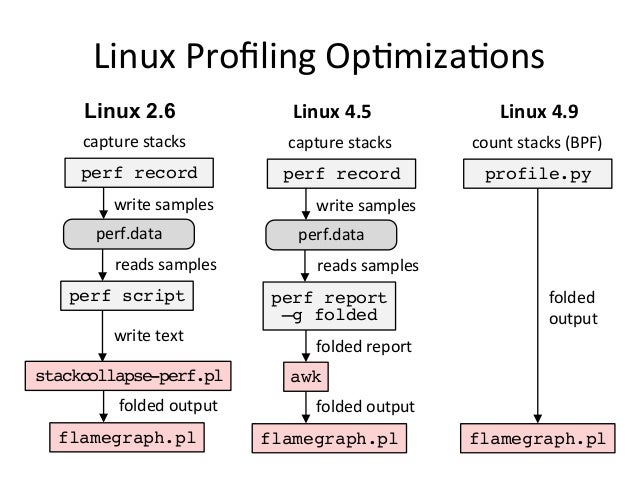
- 54. Optimizations • Linux 2.6+, via perf.data and perf script: • Linux 4.5+ can use folded output – Skips the CPU-costly stackcollapse-perf.pl step; see: http://www.brendangregg.com/blog/2016-04-30/linux-perf-folded.html • Linux 4.9+, via BPF: – Most efficient: no perf.data file, summarizes in-kernel git clone --depth 1 https://github.com/brendangregg/FlameGraph cd FlameGraph perf record -F 99 -a –g -- sleep 30 perf script | ./stackcollapse-perf.pl |./flamegraph.pl > perf.svg git clone --depth 1 https://github.com/brendangregg/FlameGraph git clone --depth 1 https://github.com/iovisor/bcc ./bcc/tools/profile.py -dF 99 30 | ./FlameGraph/flamegraph.pl > perf.svg
- 55. Linux 2.6 perf record perf script capture stacks write text stackcollapse-perf.pl flamegraph.pl perf.data write samples reads samples folded output perf record perf report –g folded capture stacks folded report awk flamegraph.pl perf.data write samples reads samples folded output Linux 4.5 count stacks (BPF) folded output flamegraph.pl profile.py Linux 4.9 Linux Profiling OpJmizaJons
- 56. Automation
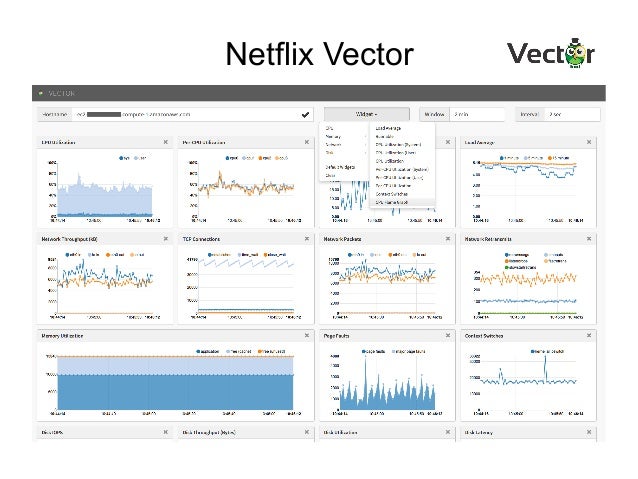
- 57. Netflix Vector
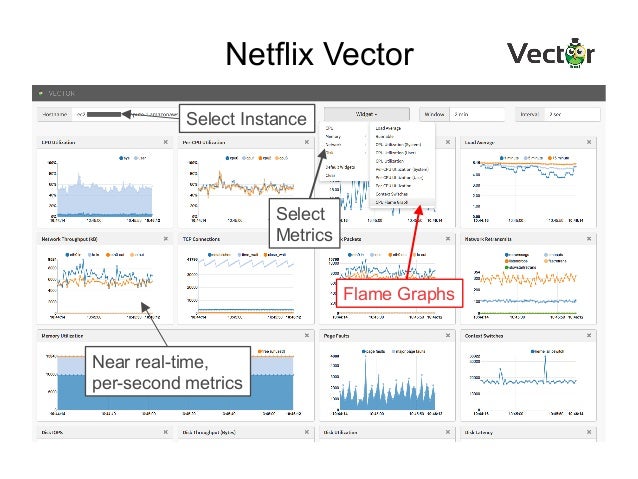
- 58. Netflix Vector Near real-time, per-second metrics Flame Graphs Select Metrics Select Instance
- 59. Netflix Vector • Open source, on-demand, instance analysis tool – https://github.com/netflix/vector • Shows various real-time metrics • Flame graph support currently in development – Automating previous steps – Using it internally already – Also developing a new d3 front end
- 60. Advanced Analysis
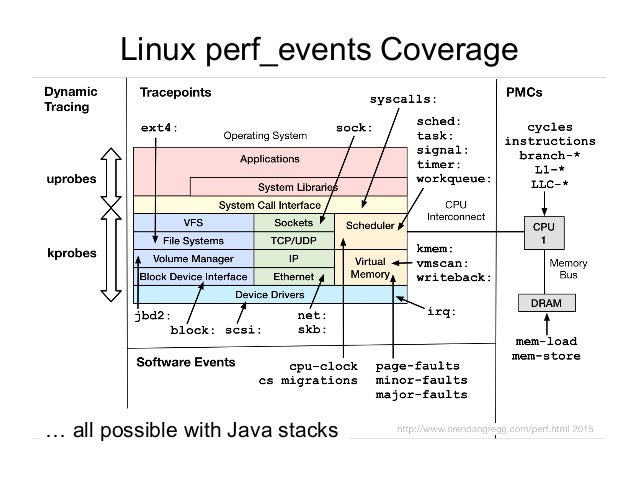
- 61. Linux perf_events Coverage … all possible with Java stacks
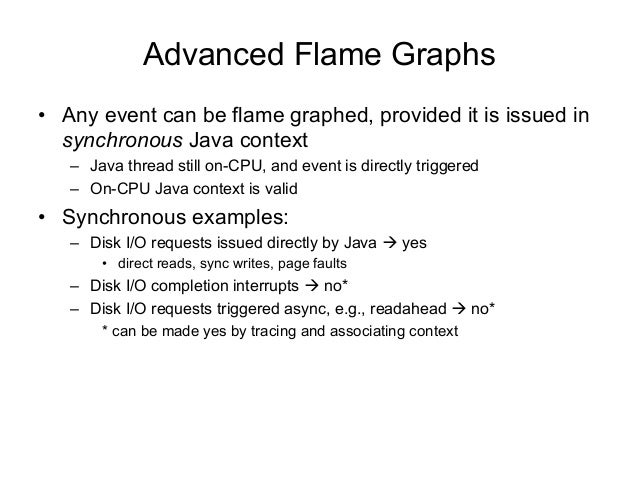
- 62. Advanced Flame Graphs • Any event can be flame graphed, provided it is issued in synchronous Java context – Java thread still on-CPU, and event is directly triggered – On-CPU Java context is valid • Synchronous examples: – Disk I/O requests issued directly by Java à yes • direct reads, sync writes, page faults – Disk I/O completion interrupts à no* – Disk I/O requests triggered async, e.g., readahead à no* * can be made yes by tracing and associating context
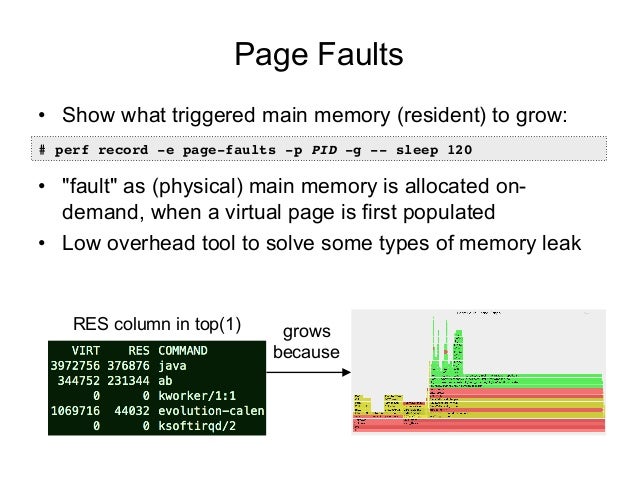
- 63. Page Faults • Show what triggered main memory (resident) to grow: • "fault" as (physical) main memory is allocated on- demand, when a virtual page is first populated • Low overhead tool to solve some types of memory leak # perf record -e page-faults -p PID -g -- sleep 120 RES column in top(1) grows because
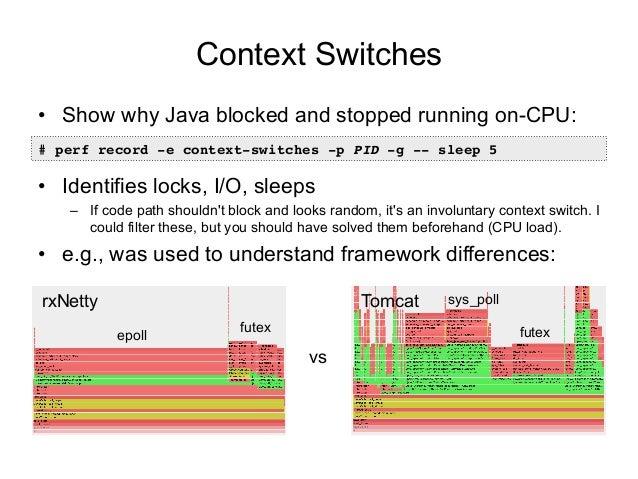
- 64. Context Switches • Show why Java blocked and stopped running on-CPU: • Identifies locks, I/O, sleeps – If code path shouldn't block and looks random, it's an involuntary context switch. I could filter these, but you should have solved them beforehand (CPU load). • e.g., was used to understand framework differences: # perf record -e context-switches -p PID -g -- sleep 5 vs rxNetty Tomcat futex sys_poll epoll futex
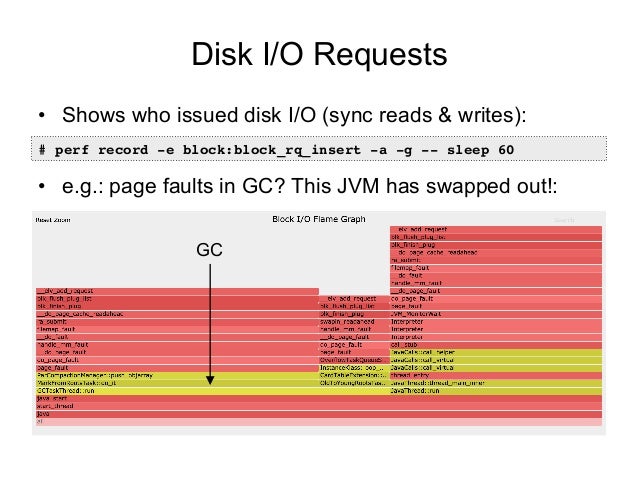
- 65. Disk I/O Requests • Shows who issued disk I/O (sync reads & writes): • e.g.: page faults in GC? This JVM has swapped out!: # perf record -e block:block_rq_insert -a -g -- sleep 60 GC
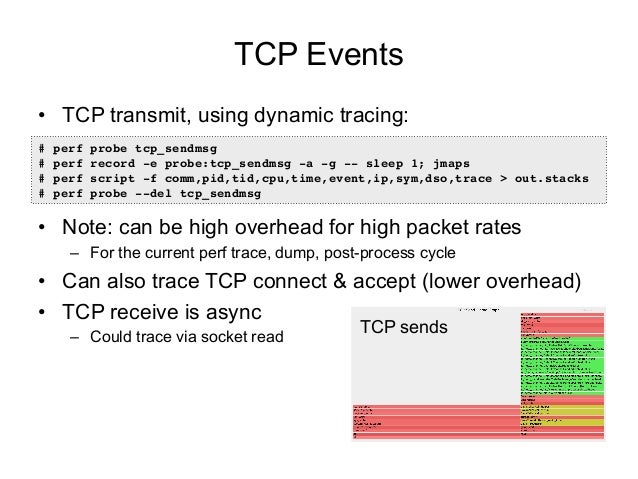
- 66. TCP Events • TCP transmit, using dynamic tracing: • Note: can be high overhead for high packet rates – For the current perf trace, dump, post-process cycle • Can also trace TCP connect & accept (lower overhead) • TCP receive is async – Could trace via socket read # perf probe tcp_sendmsg # perf record -e probe:tcp_sendmsg -a -g -- sleep 1; jmaps # perf script -f comm,pid,tid,cpu,time,event,ip,sym,dso,trace > out.stacks # perf probe --del tcp_sendmsg TCP sends
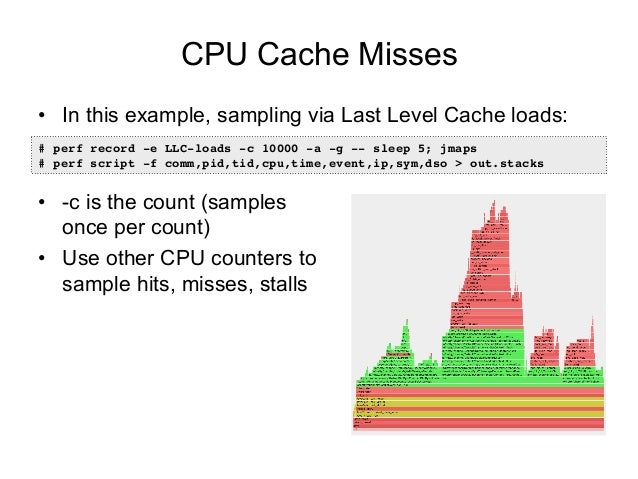
- 67. CPU Cache Misses • In this example, sampling via Last Level Cache loads: • -c is the count (samples once per count) • Use other CPU counters to sample hits, misses, stalls # perf record -e LLC-loads -c 10000 -a -g -- sleep 5; jmaps # perf script -f comm,pid,tid,cpu,time,event,ip,sym,dso > out.stacks
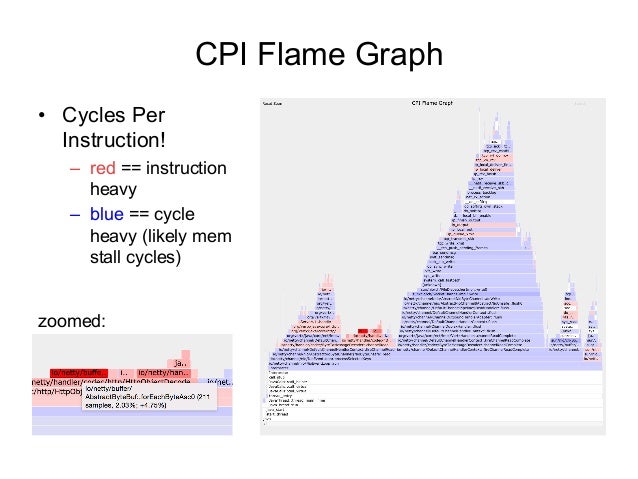
- 68. CPI Flame Graph • Cycles Per Instruction! – red == instruction heavy – blue == cycle heavy (likely mem stall cycles) zoomed:
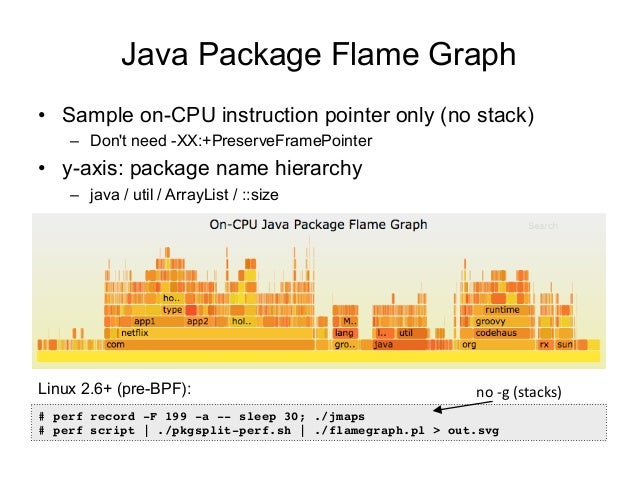
- 69. Java Package Flame Graph • Sample on-CPU instruction pointer only (no stack) – Don't need -XX:+PreserveFramePointer • y-axis: package name hierarchy – java / util / ArrayList / ::size # perf record -F 199 -a -- sleep 30; ./jmaps # perf script | ./pkgsplit-perf.sh | ./flamegraph.pl > out.svg no -g (stacks) Linux 2.6+ (pre-BPF):
- 70. Links & References • Flame Graphs – http://www.brendangregg.com/flamegraphs.html – http://www.brendangregg.com/FlameGraphs/cpuflamegraphs.html – http://queue.acm.org/detail.cfm?id=2927301 – "The Flame Graph" CACM, Vol. 56, No. 6 (June 2016) – http://techblog.netflix.com/2015/07/java-in-flames.html – http://techblog.netflix.com/2016/04/saving-13-million-computational-minutes.html – http://techblog.netflix.com/2014/11/nodejs-in-flames.html – http://www.brendangregg.com/blog/2014-11-09/differential-flame-graphs.html • Linux perf_events – https://perf.wiki.kernel.org/index.php/Main_Page – http://www.brendangregg.com/perf.html – http://www.brendangregg.com/blog/2015-02-27/linux-profiling-at-netflix.html – Linux 4.5: http://www.brendangregg.com/blog/2016-04-30/linux-perf-folded.html • Netflix Vector – https://github.com/netflix/vector – http://techblog.netflix.com/2015/04/introducing-vector-netflixs-on-host.html • hprof: http://www.brendangregg.com/blog/2014-06-09/java-cpu-sampling-using-hprof.html
- 71. Thanks • Questions? • http://techblog.netflix.com • http://slideshare.net/brendangregg • http://www.brendangregg.com • [email protected] • @brendangregg Sep 2016
Recommend
-
11
Coloring Flame Graphs: Code Hues 30 Jul 2017 I recently improved flame graph code coloring. If you're automating or implementing flame graphs, this is a small detail that may interest you. (For an intro to flame graphs, see...
-
10
USENIX/LISA 2013 Blazing Performance with Flame Graphs 23 Apr 2017 In 2013 I gave a plenary at USENIX LISA on flame graphs: my visualiza...
-
8
Java Mixed-Mode Flame Graphs at Netflix, JavaOne 2015 06 Nov 2015 At JavaOne this year I gave a talk on Java mixed-mode flame graphs, which we are rolling out at Netflix for CPU analysis and more. These make use of a new fea...
-
10
node.js Flame Graphs on Linux 17 Sep 2014 CPU flame graphs are a useful visualization application stack traces, allowing you to quickly identify and quantify what to...
-
6
Java Flame Graphs 12 Jun 2014 Java flame graphs are a hot new way to visualize CPU usage. I'll show how to create them using free and open source tools: Google's
-
10
USENIX ATC '17: Visualizing Performance with Flame Graphs25,696 viewsAug 16, 2017 ...
-
15
Blazing Performance with Flame Graphs 1. Blazing Performance with Flame Graphs Brendan Gregg
-
4
USENIX ATC 2017: Visualizing Performance with Flame Graphs 1. Visualizing Performance with Flame Graphs Brendan Gregg Senior Performance Architect Jul...
-
6
Java Mixed-Mode Flame Graphs3,752 viewsNov 6, 2015610ShareSave
-
8
LISA13 - Blazing Performance with Flame Graphs17,118 viewsDec 6, 20131161ShareSave ...
About Joyk
Aggregate valuable and interesting links.
Joyk means Joy of geeK