
2

SREcon 2016 Performance Checklists for SREs
source link: https://www.slideshare.net/brendangregg/srecon-2016-performance-checklists-for-sres
Go to the source link to view the article. You can view the picture content, updated content and better typesetting reading experience. If the link is broken, please click the button below to view the snapshot at that time.
SREcon 2016 Performance Checklists for SREs
- 1. Performance Checklists for SREs Brendan Gregg Senior Performance Architect
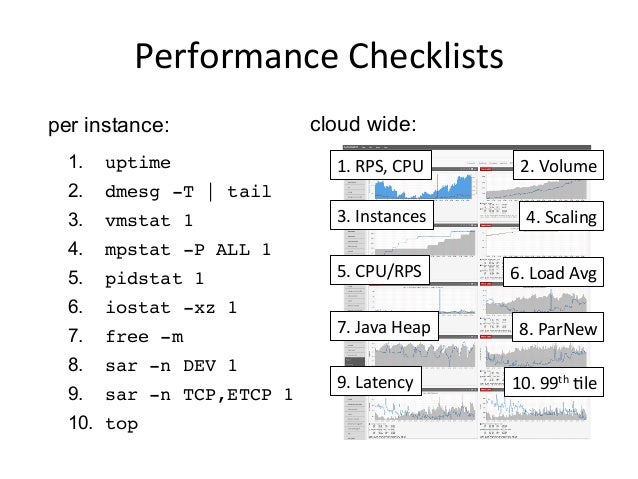
- 2. Performance Checklists 1. uptime 2. dmesg -T | tail 3. vmstat 1 4. mpstat -P ALL 1 5. pidstat 1 6. iostat -xz 1 7. free -m 8. sar -n DEV 1 9. sar -n TCP,ETCP 1 10. top per instance: cloud wide: 1. RPS, CPU 2. Volume 6. Load Avg 3. Instances 4. Scaling 5. CPU/RPS 7. Java Heap 8. ParNew 9. Latency 10. 99th Qle
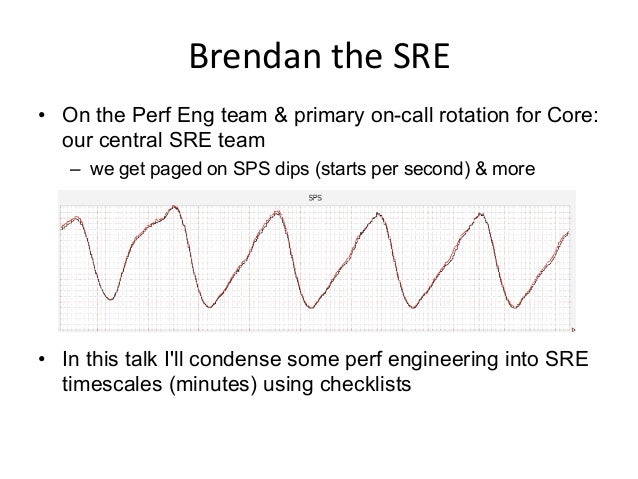
- 3. Brendan the SRE • On the Perf Eng team & primary on-call rotation for Core: our central SRE team – we get paged on SPS dips (starts per second) & more • In this talk I'll condense some perf engineering into SRE timescales (minutes) using checklists
- 4. Performance Engineering != SRE Performance Incident Response
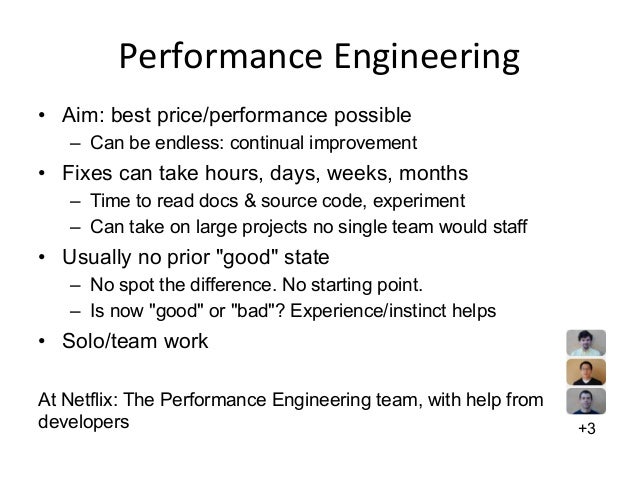
- 5. Performance Engineering • Aim: best price/performance possible – Can be endless: continual improvement • Fixes can take hours, days, weeks, months – Time to read docs & source code, experiment – Can take on large projects no single team would staff • Usually no prior "good" state – No spot the difference. No starting point. – Is now "good" or "bad"? Experience/instinct helps • Solo/team work At Netflix: The Performance Engineering team, with help from developers +3
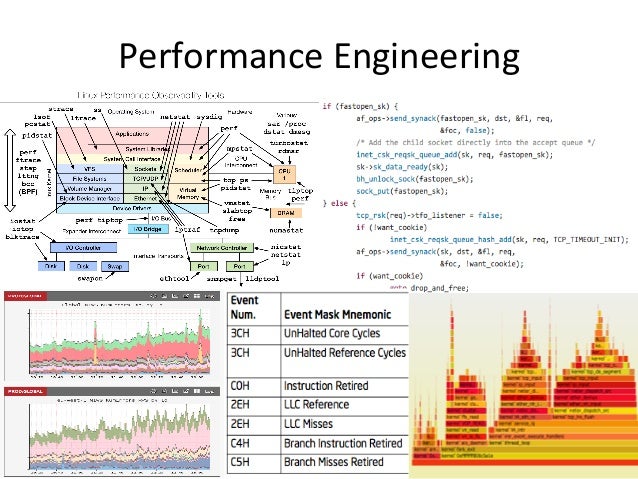
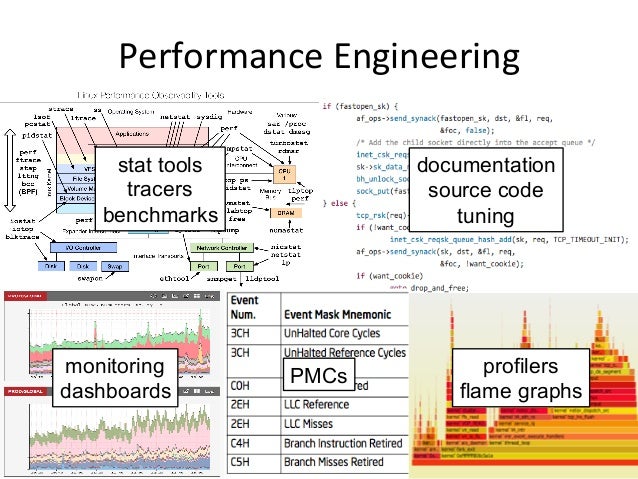
- 6. Performance Engineering
- 7. Performance Engineering stat tools tracers benchmarks documentation source code tuning PMCs profilers flame graphs monitoring dashboards
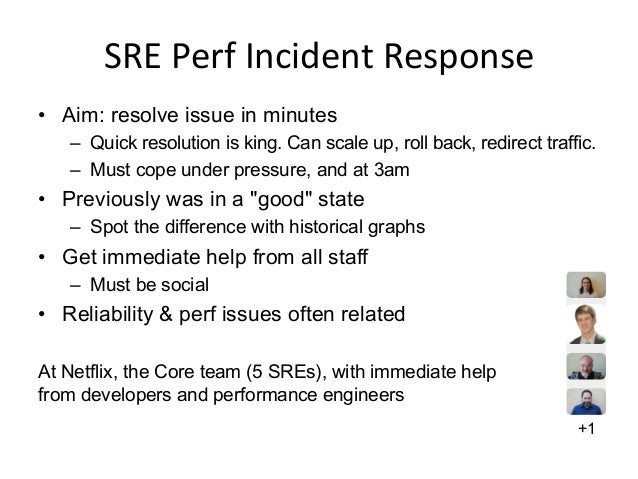
- 8. SRE Perf Incident Response • Aim: resolve issue in minutes – Quick resolution is king. Can scale up, roll back, redirect traffic. – Must cope under pressure, and at 3am • Previously was in a "good" state – Spot the difference with historical graphs • Get immediate help from all staff – Must be social • Reliability & perf issues often related At Netflix, the Core team (5 SREs), with immediate help from developers and performance engineers +1
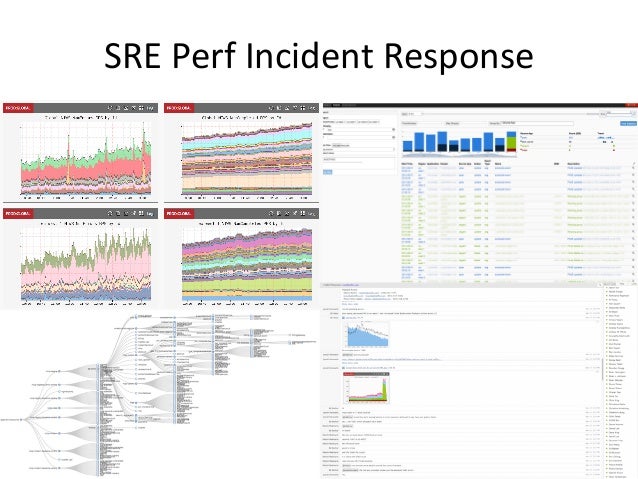
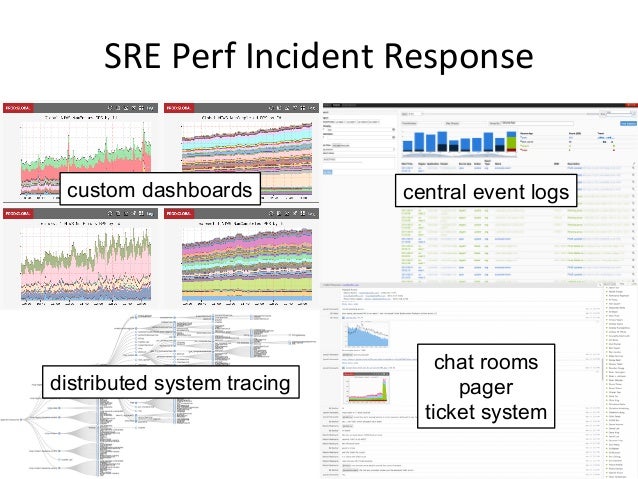
- 9. SRE Perf Incident Response
- 10. SRE Perf Incident Response custom dashboards central event logs distributed system tracing chat rooms pager ticket system
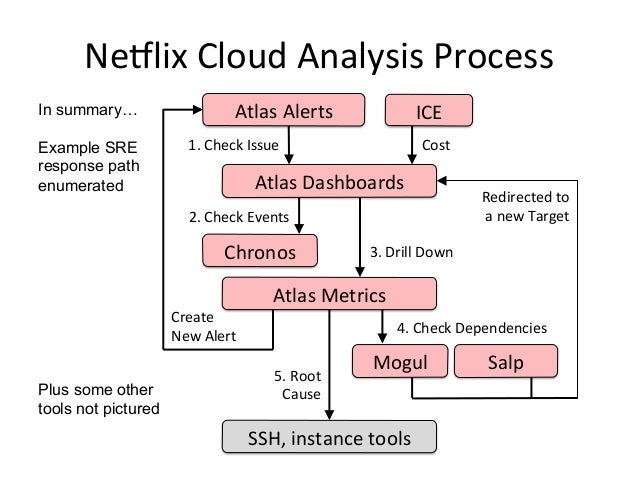
- 11. NeSlix Cloud Analysis Process Atlas Alerts Atlas Dashboards Atlas Metrics Salp Mogul SSH, instance tools ICE 4. Check Dependencies Create New Alert Plus some other tools not pictured Cost 3. Drill Down 5. Root Cause Chronos 2. Check Events In summary… Example SRE response path enumerated Redirected to a new Target 1. Check Issue
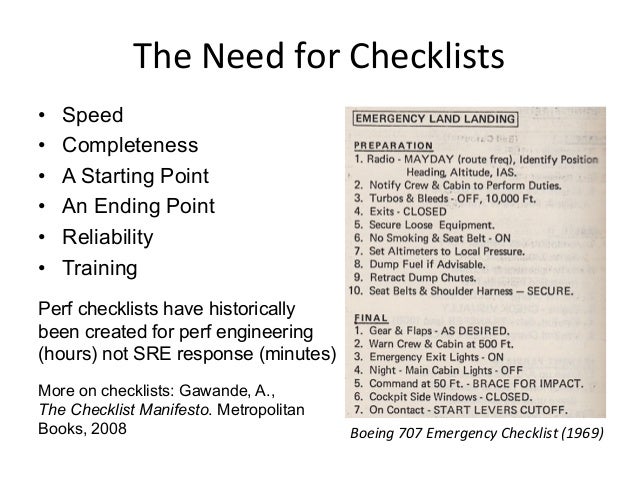
- 12. The Need for Checklists • Speed • Completeness • A Starting Point • An Ending Point • Reliability • Training Perf checklists have historically been created for perf engineering (hours) not SRE response (minutes) More on checklists: Gawande, A., The Checklist Manifesto. Metropolitan Books, 2008 Boeing 707 Emergency Checklist (1969)
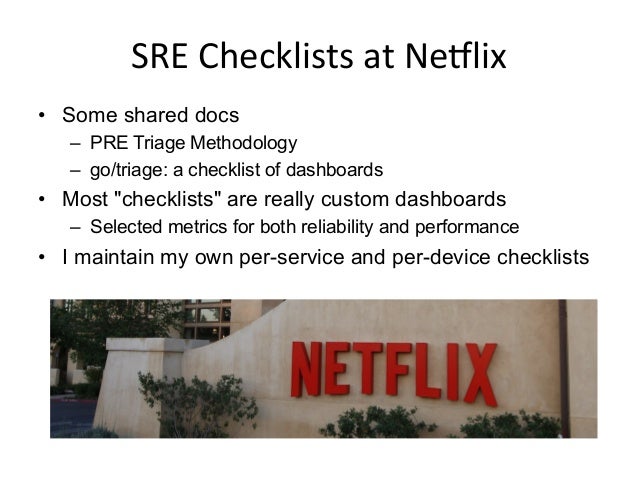
- 13. SRE Checklists at NeSlix • Some shared docs – PRE Triage Methodology – go/triage: a checklist of dashboards • Most "checklists" are really custom dashboards – Selected metrics for both reliability and performance • I maintain my own per-service and per-device checklists
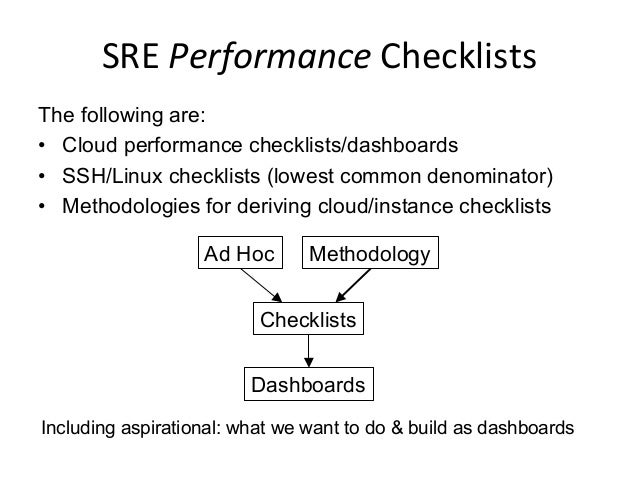
- 14. SRE Performance Checklists The following are: • Cloud performance checklists/dashboards • SSH/Linux checklists (lowest common denominator) • Methodologies for deriving cloud/instance checklists Ad Hoc Methodology Checklists Dashboards Including aspirational: what we want to do & build as dashboards
- 15. 1. PRE Triage Checklist Our iniQal checklist NeSlix specific
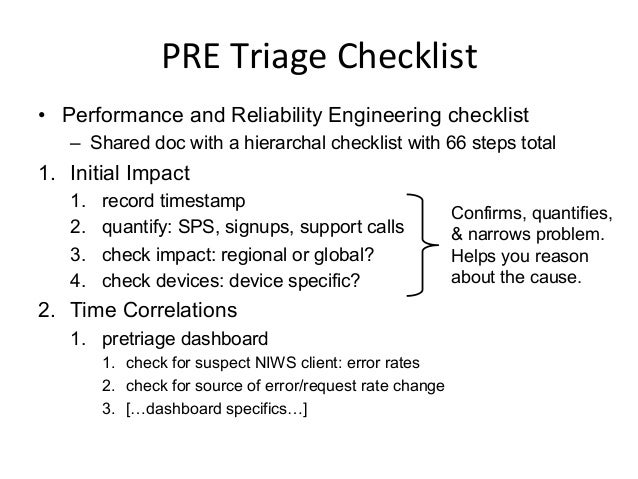
- 16. PRE Triage Checklist • Performance and Reliability Engineering checklist – Shared doc with a hierarchal checklist with 66 steps total 1. Initial Impact 1. record timestamp 2. quantify: SPS, signups, support calls 3. check impact: regional or global? 4. check devices: device specific? 2. Time Correlations 1. pretriage dashboard 1. check for suspect NIWS client: error rates 2. check for source of error/request rate change 3. […dashboard specifics…] Confirms, quantifies, & narrows problem. Helps you reason about the cause.
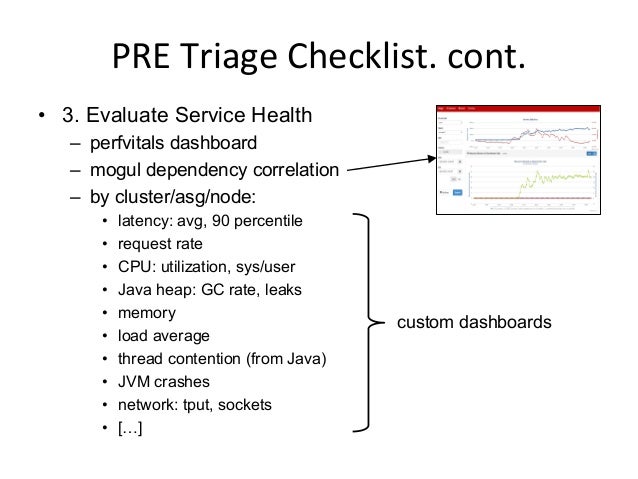
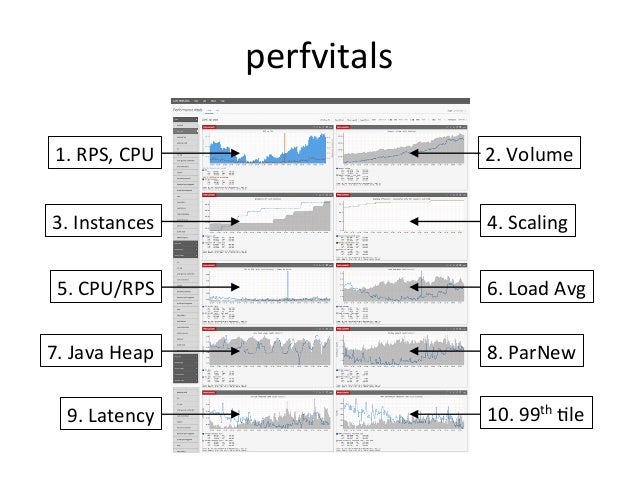
- 17. PRE Triage Checklist. cont. • 3. Evaluate Service Health – perfvitals dashboard – mogul dependency correlation – by cluster/asg/node: • latency: avg, 90 percentile • request rate • CPU: utilization, sys/user • Java heap: GC rate, leaks • memory • load average • thread contention (from Java) • JVM crashes • network: tput, sockets • […] custom dashboards
- 18. 2. predash IniQal dashboard NeSlix specific
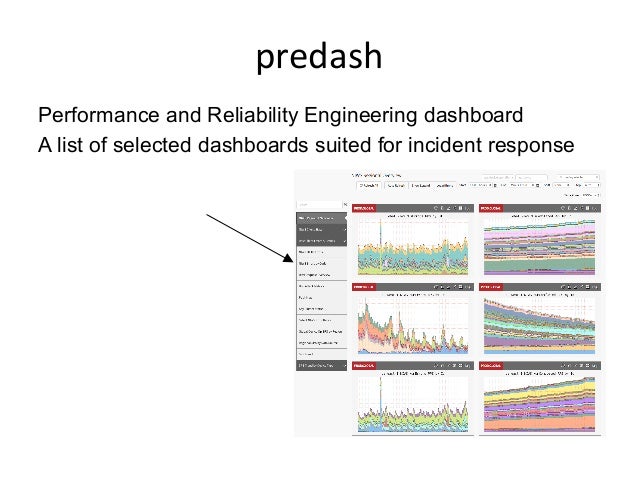
- 19. predash Performance and Reliability Engineering dashboard A list of selected dashboards suited for incident response
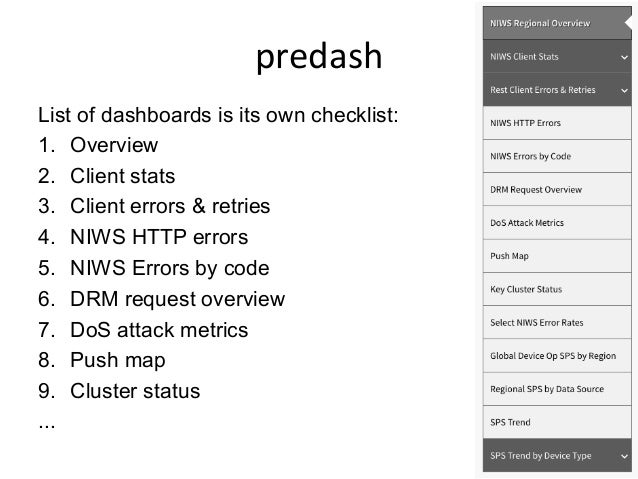
- 20. predash List of dashboards is its own checklist: 1. Overview 2. Client stats 3. Client errors & retries 4. NIWS HTTP errors 5. NIWS Errors by code 6. DRM request overview 7. DoS attack metrics 8. Push map 9. Cluster status ...
- 21. 3. perfvitals Service dashboard
- 22. 1. RPS, CPU 2. Volume 6. Load Avg 3. Instances 4. Scaling 5. CPU/RPS 7. Java Heap 8. ParNew 9. Latency 10. 99th Qle perfvitals
- 23. 4. Cloud ApplicaQon Performance Dashboard A generic example
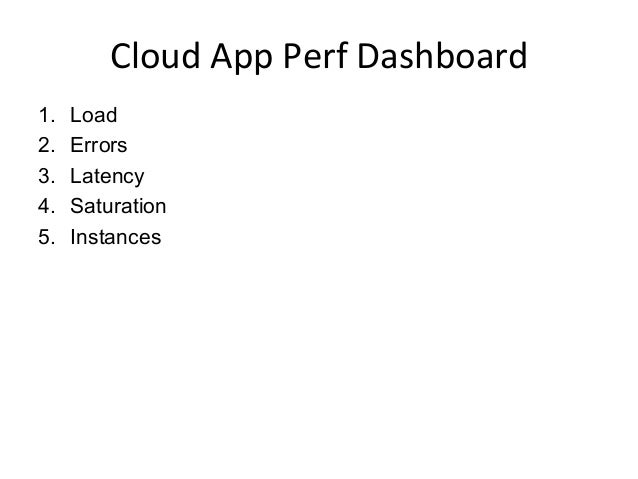
- 24. Cloud App Perf Dashboard 1. Load 2. Errors 3. Latency 4. Saturation 5. Instances
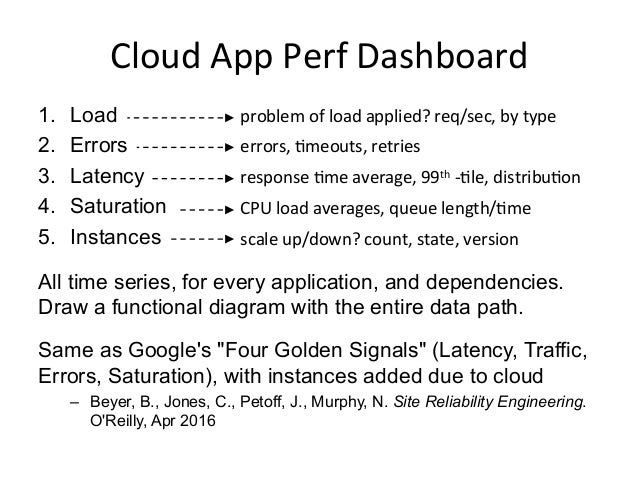
- 25. Cloud App Perf Dashboard 1. Load 2. Errors 3. Latency 4. Saturation 5. Instances All time series, for every application, and dependencies. Draw a functional diagram with the entire data path. Same as Google's "Four Golden Signals" (Latency, Traffic, Errors, Saturation), with instances added due to cloud – Beyer, B., Jones, C., Petoff, J., Murphy, N. Site Reliability Engineering. O'Reilly, Apr 2016 problem of load applied? req/sec, by type errors, Qmeouts, retries response Qme average, 99th -‐Qle, distribuQon CPU load averages, queue length/Qme scale up/down? count, state, version
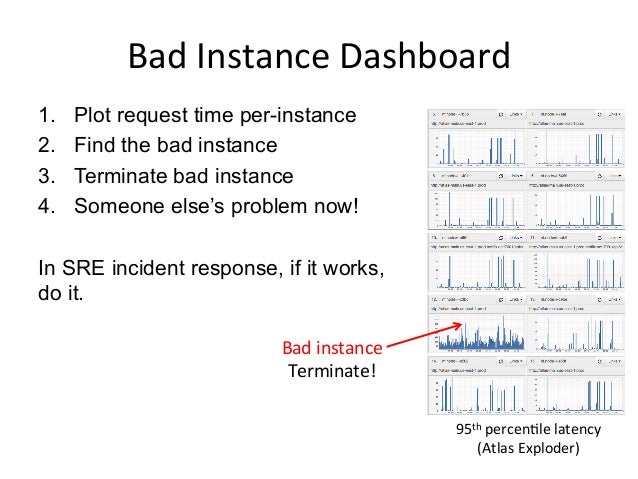
- 26. 5. Bad Instance Dashboard An An>-‐Methodology
- 27. Bad Instance Dashboard 1. Plot request time per-instance 2. Find the bad instance 3. Terminate bad instance 4. Someone else’s problem now! In SRE incident response, if it works, do it. 95th percenQle latency (Atlas Exploder) Bad instance Terminate!
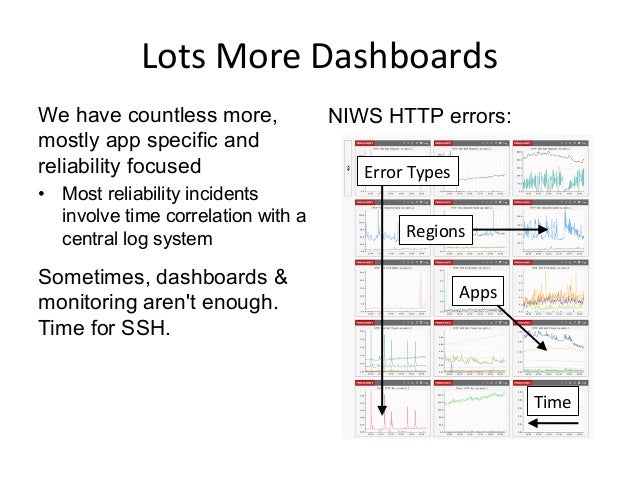
- 28. Lots More Dashboards We have countless more, mostly app specific and reliability focused • Most reliability incidents involve time correlation with a central log system Sometimes, dashboards & monitoring aren't enough. Time for SSH. NIWS HTTP errors: Error Types Regions Apps Time
- 29. 6. Linux Performance Analysis in 60,000 milliseconds
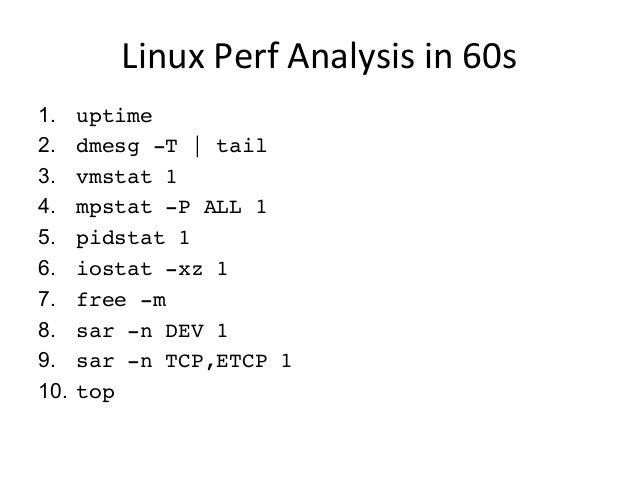
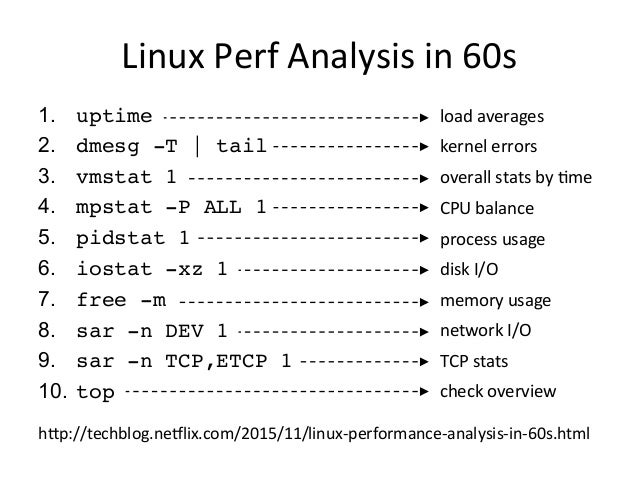
- 30. Linux Perf Analysis in 60s 1. uptime 2. dmesg -T | tail 3. vmstat 1 4. mpstat -P ALL 1 5. pidstat 1 6. iostat -xz 1 7. free -m 8. sar -n DEV 1 9. sar -n TCP,ETCP 1 10. top
- 31. Linux Perf Analysis in 60s 1. uptime 2. dmesg -T | tail 3. vmstat 1 4. mpstat -P ALL 1 5. pidstat 1 6. iostat -xz 1 7. free -m 8. sar -n DEV 1 9. sar -n TCP,ETCP 1 10. top load averages kernel errors overall stats by Qme CPU balance process usage disk I/O memory usage network I/O TCP stats check overview hap://techblog.neSlix.com/2015/11/linux-‐performance-‐analysis-‐in-‐60s.html
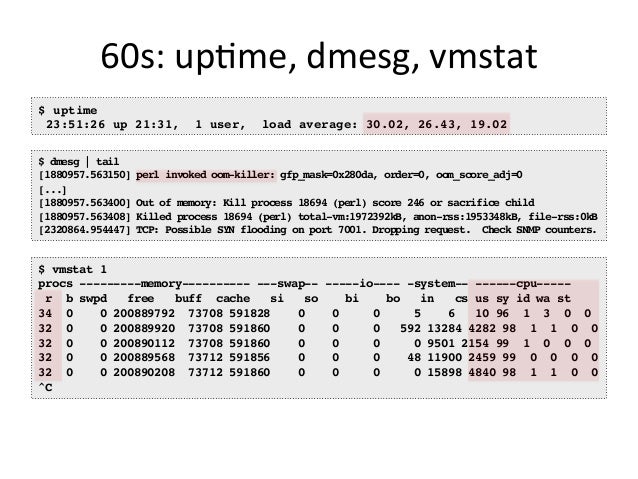
- 32. 60s: upQme, dmesg, vmstat $ uptime 23:51:26 up 21:31, 1 user, load average: 30.02, 26.43, 19.02 $ dmesg | tail [1880957.563150] perl invoked oom-killer: gfp_mask=0x280da, order=0, oom_score_adj=0 [...] [1880957.563400] Out of memory: Kill process 18694 (perl) score 246 or sacrifice child [1880957.563408] Killed process 18694 (perl) total-vm:1972392kB, anon-rss:1953348kB, file-rss:0kB [2320864.954447] TCP: Possible SYN flooding on port 7001. Dropping request. Check SNMP counters. $ vmstat 1 procs ---------memory---------- ---swap-- -----io---- -system-- ------cpu----- r b swpd free buff cache si so bi bo in cs us sy id wa st 34 0 0 200889792 73708 591828 0 0 0 5 6 10 96 1 3 0 0 32 0 0 200889920 73708 591860 0 0 0 592 13284 4282 98 1 1 0 0 32 0 0 200890112 73708 591860 0 0 0 0 9501 2154 99 1 0 0 0 32 0 0 200889568 73712 591856 0 0 0 48 11900 2459 99 0 0 0 0 32 0 0 200890208 73712 591860 0 0 0 0 15898 4840 98 1 1 0 0 ^C
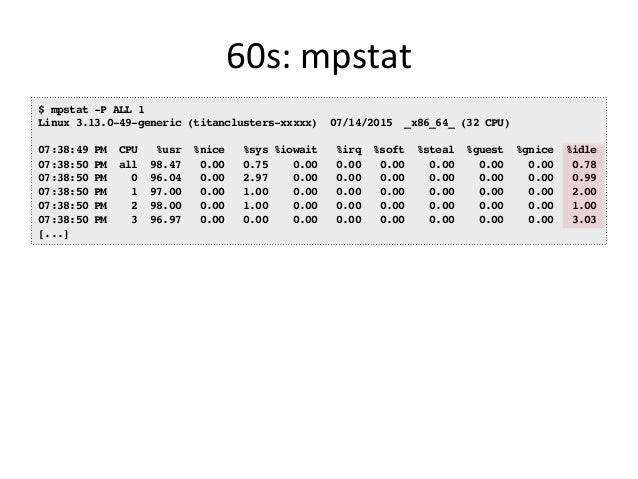
- 33. 60s: mpstat $ mpstat -P ALL 1 Linux 3.13.0-49-generic (titanclusters-xxxxx) 07/14/2015 _x86_64_ (32 CPU) 07:38:49 PM CPU %usr %nice %sys %iowait %irq %soft %steal %guest %gnice %idle 07:38:50 PM all 98.47 0.00 0.75 0.00 0.00 0.00 0.00 0.00 0.00 0.78 07:38:50 PM 0 96.04 0.00 2.97 0.00 0.00 0.00 0.00 0.00 0.00 0.99 07:38:50 PM 1 97.00 0.00 1.00 0.00 0.00 0.00 0.00 0.00 0.00 2.00 07:38:50 PM 2 98.00 0.00 1.00 0.00 0.00 0.00 0.00 0.00 0.00 1.00 07:38:50 PM 3 96.97 0.00 0.00 0.00 0.00 0.00 0.00 0.00 0.00 3.03 [...]
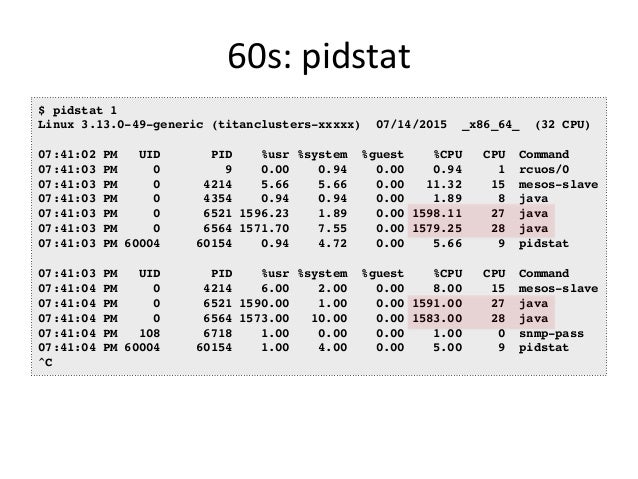
- 34. 60s: pidstat $ pidstat 1 Linux 3.13.0-49-generic (titanclusters-xxxxx) 07/14/2015 _x86_64_ (32 CPU) 07:41:02 PM UID PID %usr %system %guest %CPU CPU Command 07:41:03 PM 0 9 0.00 0.94 0.00 0.94 1 rcuos/0 07:41:03 PM 0 4214 5.66 5.66 0.00 11.32 15 mesos-slave 07:41:03 PM 0 4354 0.94 0.94 0.00 1.89 8 java 07:41:03 PM 0 6521 1596.23 1.89 0.00 1598.11 27 java 07:41:03 PM 0 6564 1571.70 7.55 0.00 1579.25 28 java 07:41:03 PM 60004 60154 0.94 4.72 0.00 5.66 9 pidstat 07:41:03 PM UID PID %usr %system %guest %CPU CPU Command 07:41:04 PM 0 4214 6.00 2.00 0.00 8.00 15 mesos-slave 07:41:04 PM 0 6521 1590.00 1.00 0.00 1591.00 27 java 07:41:04 PM 0 6564 1573.00 10.00 0.00 1583.00 28 java 07:41:04 PM 108 6718 1.00 0.00 0.00 1.00 0 snmp-pass 07:41:04 PM 60004 60154 1.00 4.00 0.00 5.00 9 pidstat ^C
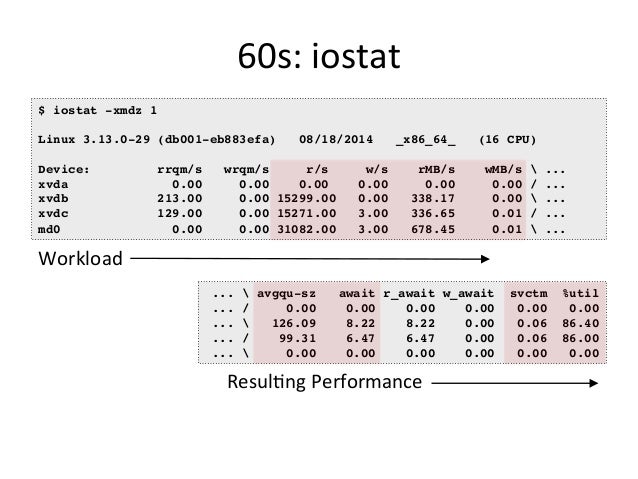
- 35. 60s: iostat $ iostat -xmdz 1 Linux 3.13.0-29 (db001-eb883efa) 08/18/2014 _x86_64_ (16 CPU) Device: rrqm/s wrqm/s r/s w/s rMB/s wMB/s ... xvda 0.00 0.00 0.00 0.00 0.00 0.00 / ... xvdb 213.00 0.00 15299.00 0.00 338.17 0.00 ... xvdc 129.00 0.00 15271.00 3.00 336.65 0.01 / ... md0 0.00 0.00 31082.00 3.00 678.45 0.01 ... ... avgqu-sz await r_await w_await svctm %util ... / 0.00 0.00 0.00 0.00 0.00 0.00 ... 126.09 8.22 8.22 0.00 0.06 86.40 ... / 99.31 6.47 6.47 0.00 0.06 86.00 ... 0.00 0.00 0.00 0.00 0.00 0.00 Workload ResulQng Performance
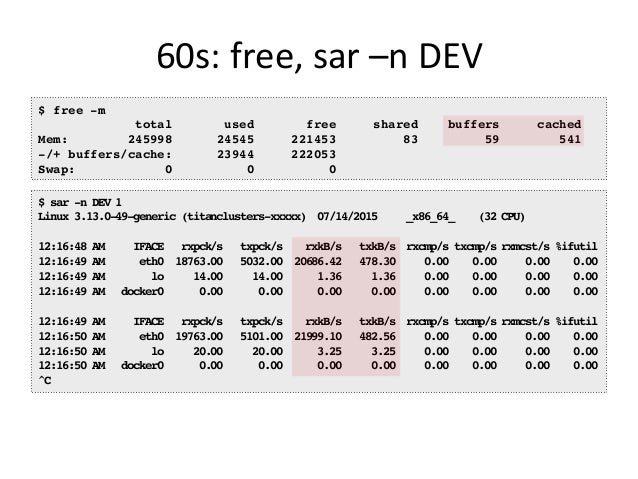
- 36. 60s: free, sar –n DEV $ free -m total used free shared buffers cached Mem: 245998 24545 221453 83 59 541 -/+ buffers/cache: 23944 222053 Swap: 0 0 0 $ sar -n DEV 1 Linux 3.13.0-49-generic (titanclusters-xxxxx) 07/14/2015 _x86_64_ (32 CPU) 12:16:48 AM IFACE rxpck/s txpck/s rxkB/s txkB/s rxcmp/s txcmp/s rxmcst/s %ifutil 12:16:49 AM eth0 18763.00 5032.00 20686.42 478.30 0.00 0.00 0.00 0.00 12:16:49 AM lo 14.00 14.00 1.36 1.36 0.00 0.00 0.00 0.00 12:16:49 AM docker0 0.00 0.00 0.00 0.00 0.00 0.00 0.00 0.00 12:16:49 AM IFACE rxpck/s txpck/s rxkB/s txkB/s rxcmp/s txcmp/s rxmcst/s %ifutil 12:16:50 AM eth0 19763.00 5101.00 21999.10 482.56 0.00 0.00 0.00 0.00 12:16:50 AM lo 20.00 20.00 3.25 3.25 0.00 0.00 0.00 0.00 12:16:50 AM docker0 0.00 0.00 0.00 0.00 0.00 0.00 0.00 0.00 ^C
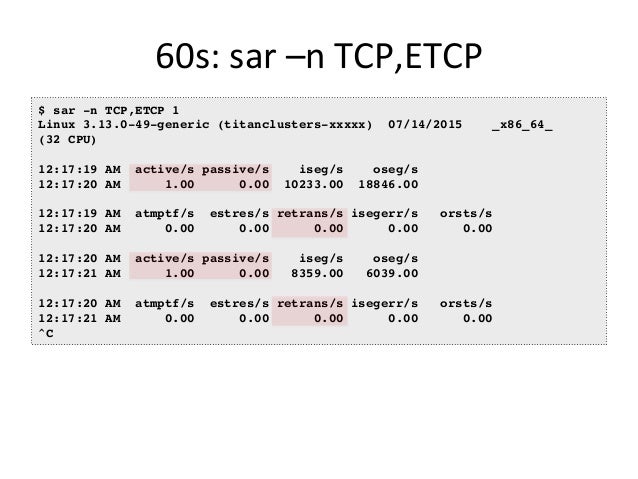
- 37. 60s: sar –n TCP,ETCP $ sar -n TCP,ETCP 1 Linux 3.13.0-49-generic (titanclusters-xxxxx) 07/14/2015 _x86_64_ (32 CPU) 12:17:19 AM active/s passive/s iseg/s oseg/s 12:17:20 AM 1.00 0.00 10233.00 18846.00 12:17:19 AM atmptf/s estres/s retrans/s isegerr/s orsts/s 12:17:20 AM 0.00 0.00 0.00 0.00 0.00 12:17:20 AM active/s passive/s iseg/s oseg/s 12:17:21 AM 1.00 0.00 8359.00 6039.00 12:17:20 AM atmptf/s estres/s retrans/s isegerr/s orsts/s 12:17:21 AM 0.00 0.00 0.00 0.00 0.00 ^C
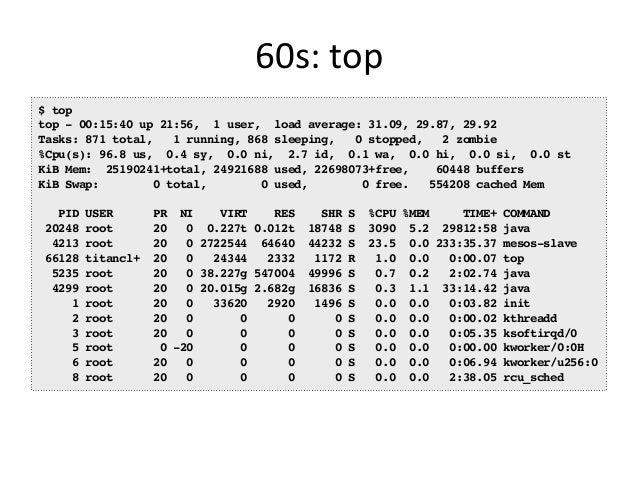
- 38. 60s: top $ top top - 00:15:40 up 21:56, 1 user, load average: 31.09, 29.87, 29.92 Tasks: 871 total, 1 running, 868 sleeping, 0 stopped, 2 zombie %Cpu(s): 96.8 us, 0.4 sy, 0.0 ni, 2.7 id, 0.1 wa, 0.0 hi, 0.0 si, 0.0 st KiB Mem: 25190241+total, 24921688 used, 22698073+free, 60448 buffers KiB Swap: 0 total, 0 used, 0 free. 554208 cached Mem PID USER PR NI VIRT RES SHR S %CPU %MEM TIME+ COMMAND 20248 root 20 0 0.227t 0.012t 18748 S 3090 5.2 29812:58 java 4213 root 20 0 2722544 64640 44232 S 23.5 0.0 233:35.37 mesos-slave 66128 titancl+ 20 0 24344 2332 1172 R 1.0 0.0 0:00.07 top 5235 root 20 0 38.227g 547004 49996 S 0.7 0.2 2:02.74 java 4299 root 20 0 20.015g 2.682g 16836 S 0.3 1.1 33:14.42 java 1 root 20 0 33620 2920 1496 S 0.0 0.0 0:03.82 init 2 root 20 0 0 0 0 S 0.0 0.0 0:00.02 kthreadd 3 root 20 0 0 0 0 S 0.0 0.0 0:05.35 ksoftirqd/0 5 root 0 -20 0 0 0 S 0.0 0.0 0:00.00 kworker/0:0H 6 root 20 0 0 0 0 S 0.0 0.0 0:06.94 kworker/u256:0 8 root 20 0 0 0 0 S 0.0 0.0 2:38.05 rcu_sched
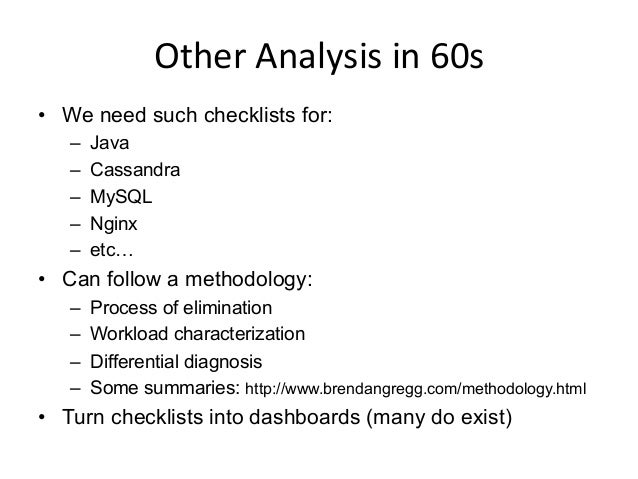
- 39. Other Analysis in 60s • We need such checklists for: – Java – Cassandra – MySQL – Nginx – etc… • Can follow a methodology: – Process of elimination – Workload characterization – Differential diagnosis – Some summaries: http://www.brendangregg.com/methodology.html • Turn checklists into dashboards (many do exist)
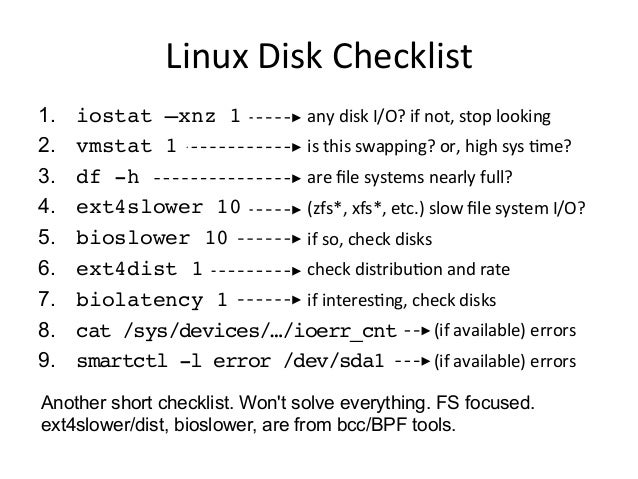
- 40. 7. Linux Disk Checklist
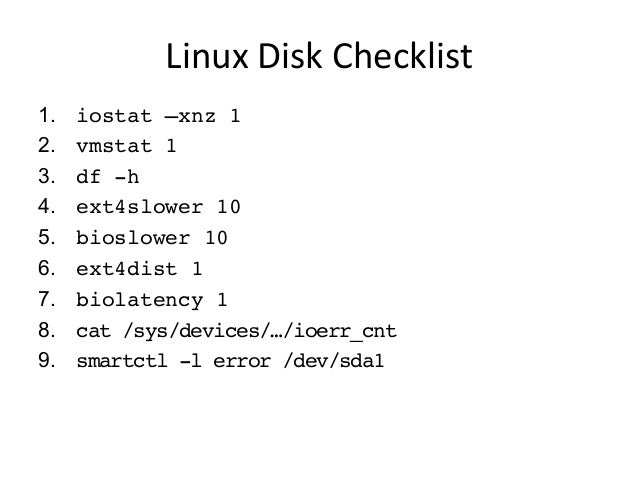
- 41. Linux Disk Checklist 1. iostat –xnz 1 2. vmstat 1 3. df -h 4. ext4slower 10 5. bioslower 10 6. ext4dist 1 7. biolatency 1 8. cat /sys/devices/…/ioerr_cnt 9. smartctl -l error /dev/sda1
- 42. Linux Disk Checklist 1. iostat –xnz 1 2. vmstat 1 3. df -h 4. ext4slower 10 5. bioslower 10 6. ext4dist 1 7. biolatency 1 8. cat /sys/devices/…/ioerr_cnt 9. smartctl -l error /dev/sda1 any disk I/O? if not, stop looking is this swapping? or, high sys Qme? are file systems nearly full? (zfs*, xfs*, etc.) slow file system I/O? if so, check disks check distribuQon and rate if interesQng, check disks (if available) errors (if available) errors Another short checklist. Won't solve everything. FS focused. ext4slower/dist, bioslower, are from bcc/BPF tools.
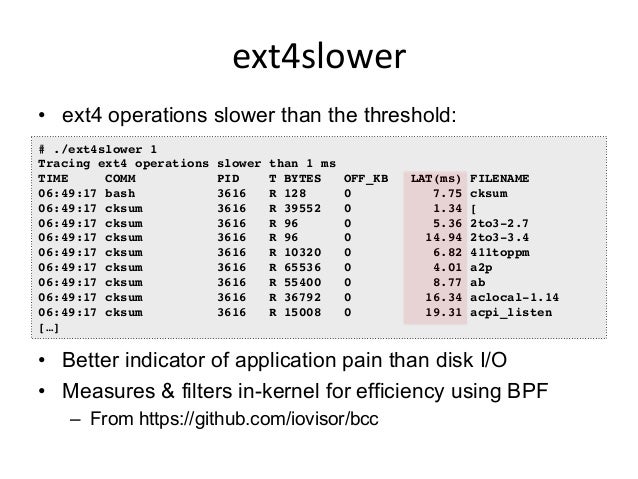
- 43. ext4slower • ext4 operations slower than the threshold: • Better indicator of application pain than disk I/O • Measures & filters in-kernel for efficiency using BPF – From https://github.com/iovisor/bcc # ./ext4slower 1 Tracing ext4 operations slower than 1 ms TIME COMM PID T BYTES OFF_KB LAT(ms) FILENAME 06:49:17 bash 3616 R 128 0 7.75 cksum 06:49:17 cksum 3616 R 39552 0 1.34 [ 06:49:17 cksum 3616 R 96 0 5.36 2to3-2.7 06:49:17 cksum 3616 R 96 0 14.94 2to3-3.4 06:49:17 cksum 3616 R 10320 0 6.82 411toppm 06:49:17 cksum 3616 R 65536 0 4.01 a2p 06:49:17 cksum 3616 R 55400 0 8.77 ab 06:49:17 cksum 3616 R 36792 0 16.34 aclocal-1.14 06:49:17 cksum 3616 R 15008 0 19.31 acpi_listen […]
- 44. BPF is coming… Free your mind
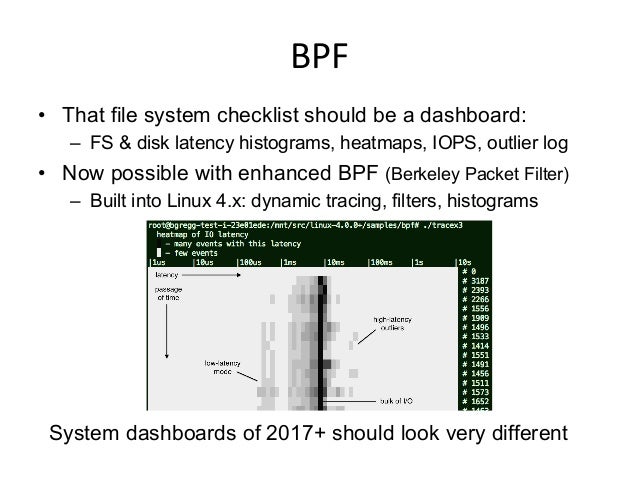
- 45. BPF • That file system checklist should be a dashboard: – FS & disk latency histograms, heatmaps, IOPS, outlier log • Now possible with enhanced BPF (Berkeley Packet Filter) – Built into Linux 4.x: dynamic tracing, filters, histograms System dashboards of 2017+ should look very different
- 46. 8. Linux Network Checklist
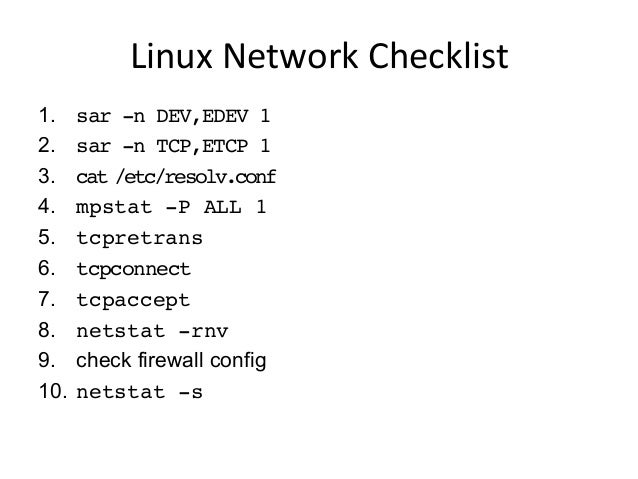
- 47. Linux Network Checklist 1. sar -n DEV,EDEV 1 2. sar -n TCP,ETCP 1 3. cat /etc/resolv.conf 4. mpstat -P ALL 1 5. tcpretrans 6. tcpconnect 7. tcpaccept 8. netstat -rnv 9. check firewall config 10. netstat -s
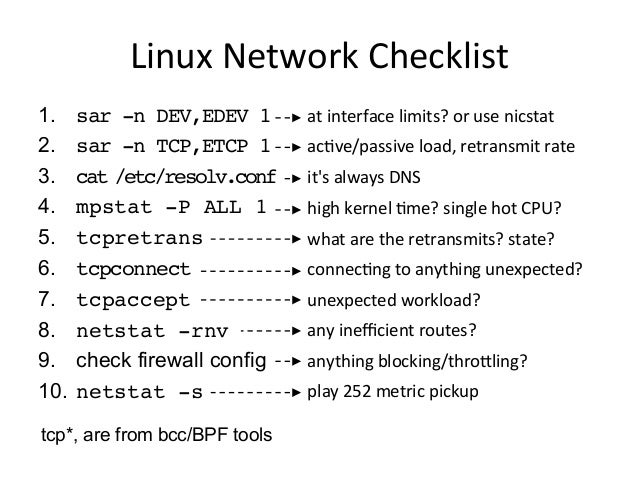
- 48. Linux Network Checklist 1. sar -n DEV,EDEV 1 2. sar -n TCP,ETCP 1 3. cat /etc/resolv.conf 4. mpstat -P ALL 1 5. tcpretrans 6. tcpconnect 7. tcpaccept 8. netstat -rnv 9. check firewall config 10. netstat -s at interface limits? or use nicstat acQve/passive load, retransmit rate it's always DNS high kernel Qme? single hot CPU? what are the retransmits? state? connecQng to anything unexpected? unexpected workload? any inefficient routes? anything blocking/throaling? play 252 metric pickup tcp*, are from bcc/BPF tools
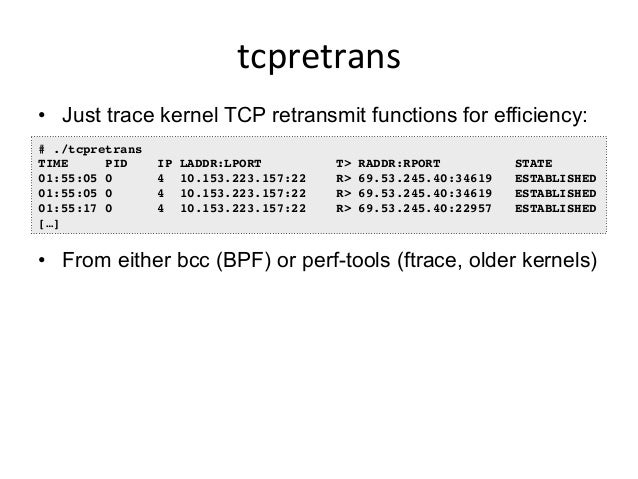
- 49. tcpretrans • Just trace kernel TCP retransmit functions for efficiency: • From either bcc (BPF) or perf-tools (ftrace, older kernels) # ./tcpretrans TIME PID IP LADDR:LPORT T> RADDR:RPORT STATE 01:55:05 0 4 10.153.223.157:22 R> 69.53.245.40:34619 ESTABLISHED 01:55:05 0 4 10.153.223.157:22 R> 69.53.245.40:34619 ESTABLISHED 01:55:17 0 4 10.153.223.157:22 R> 69.53.245.40:22957 ESTABLISHED […]
- 50. 9. Linux CPU Checklist
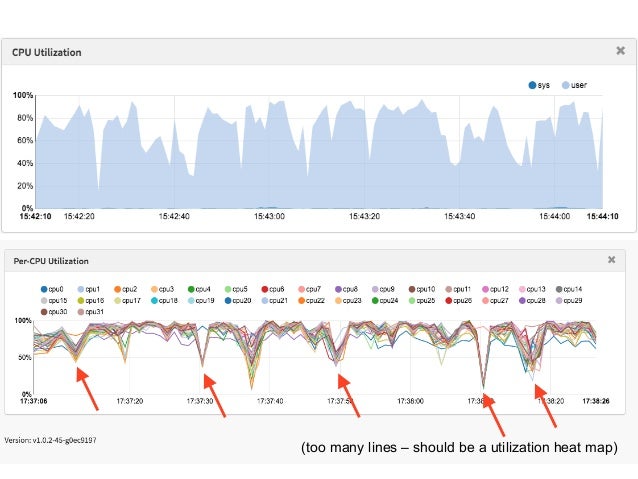
- 51. (too many lines – should be a utilization heat map)
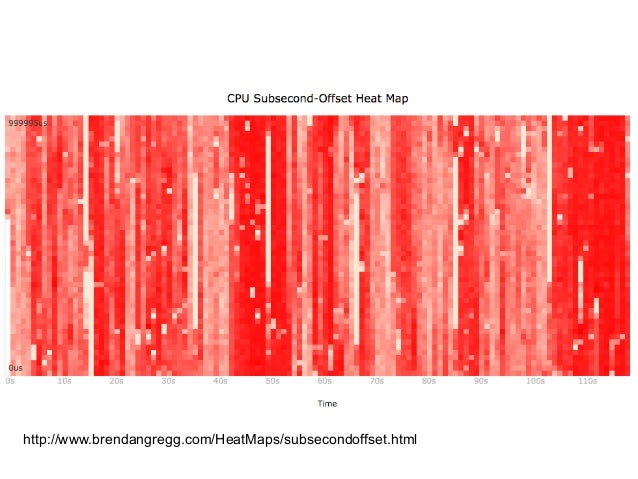
- 52. http://www.brendangregg.com/HeatMaps/subsecondoffset.html
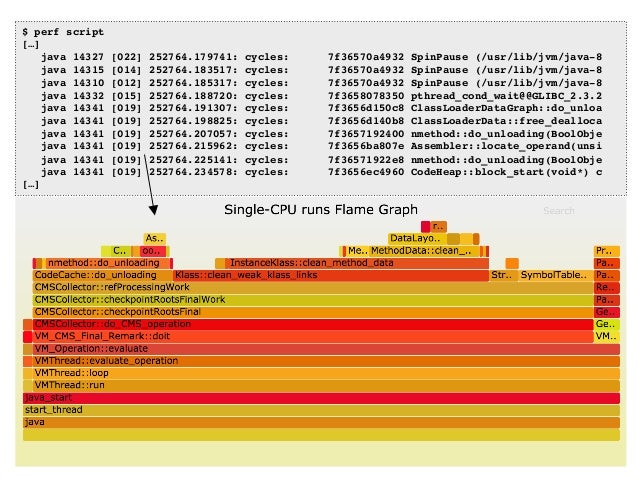
- 53. $ perf script […] java 14327 [022] 252764.179741: cycles: 7f36570a4932 SpinPause (/usr/lib/jvm/java-8 java 14315 [014] 252764.183517: cycles: 7f36570a4932 SpinPause (/usr/lib/jvm/java-8 java 14310 [012] 252764.185317: cycles: 7f36570a4932 SpinPause (/usr/lib/jvm/java-8 java 14332 [015] 252764.188720: cycles: 7f3658078350 pthread_cond_wait@@GLIBC_2.3.2 java 14341 [019] 252764.191307: cycles: 7f3656d150c8 ClassLoaderDataGraph::do_unloa java 14341 [019] 252764.198825: cycles: 7f3656d140b8 ClassLoaderData::free_dealloca java 14341 [019] 252764.207057: cycles: 7f3657192400 nmethod::do_unloading(BoolObje java 14341 [019] 252764.215962: cycles: 7f3656ba807e Assembler::locate_operand(unsi java 14341 [019] 252764.225141: cycles: 7f36571922e8 nmethod::do_unloading(BoolObje java 14341 [019] 252764.234578: cycles: 7f3656ec4960 CodeHeap::block_start(void*) c […]
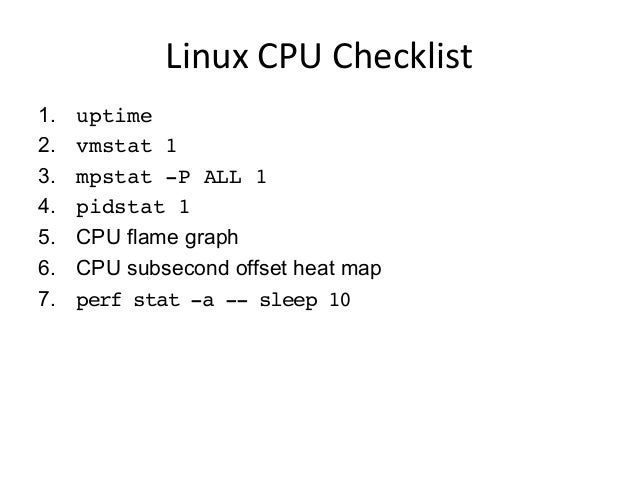
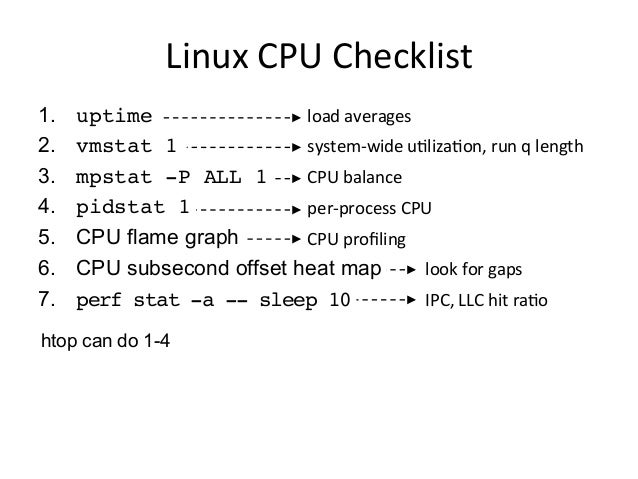
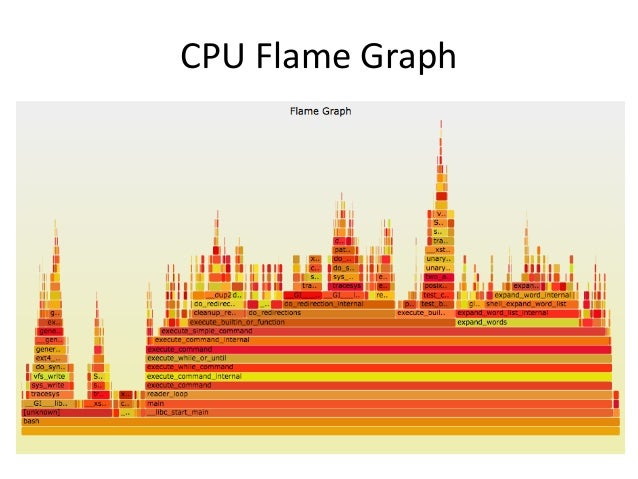
- 54. Linux CPU Checklist 1. uptime 2. vmstat 1 3. mpstat -P ALL 1 4. pidstat 1 5. CPU flame graph 6. CPU subsecond offset heat map 7. perf stat -a -- sleep 10
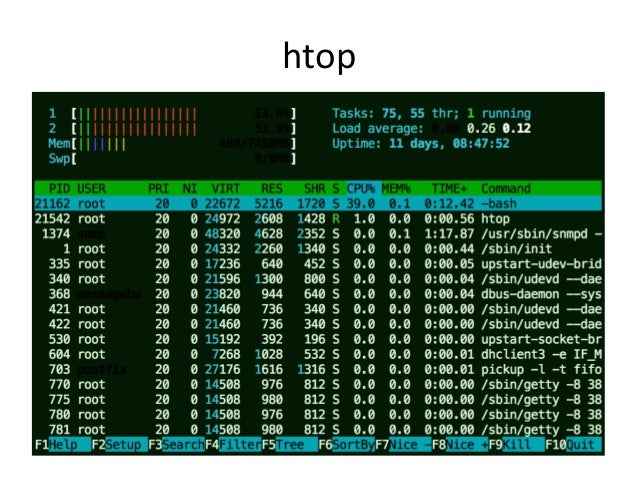
- 55. Linux CPU Checklist 1. uptime 2. vmstat 1 3. mpstat -P ALL 1 4. pidstat 1 5. CPU flame graph 6. CPU subsecond offset heat map 7. perf stat -a -- sleep 10 load averages system-‐wide uQlizaQon, run q length CPU balance per-‐process CPU CPU profiling look for gaps IPC, LLC hit raQo htop can do 1-4
- 56. htop
- 57. CPU Flame Graph
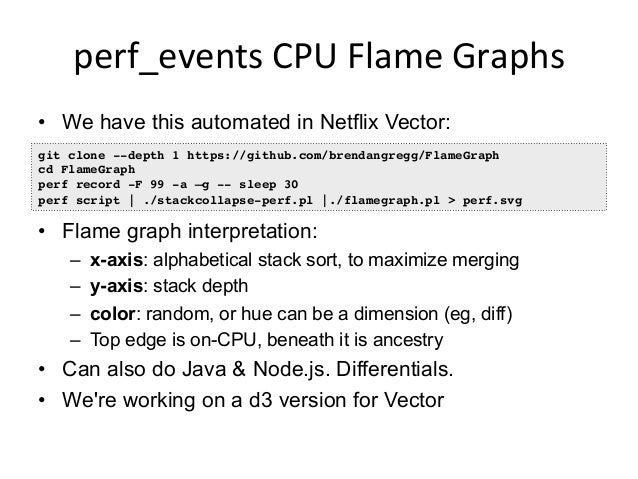
- 58. perf_events CPU Flame Graphs • We have this automated in Netflix Vector: • Flame graph interpretation: – x-axis: alphabetical stack sort, to maximize merging – y-axis: stack depth – color: random, or hue can be a dimension (eg, diff) – Top edge is on-CPU, beneath it is ancestry • Can also do Java & Node.js. Differentials. • We're working on a d3 version for Vector git clone --depth 1 https://github.com/brendangregg/FlameGraph cd FlameGraph perf record -F 99 -a –g -- sleep 30 perf script | ./stackcollapse-perf.pl |./flamegraph.pl > perf.svg
- 59. 10. Tools Method An An>-‐Methodology
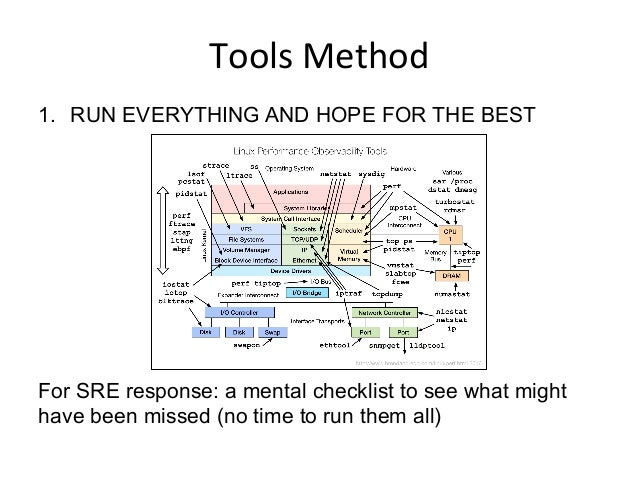
- 60. Tools Method 1. RUN EVERYTHING AND HOPE FOR THE BEST For SRE response: a mental checklist to see what might have been missed (no time to run them all)
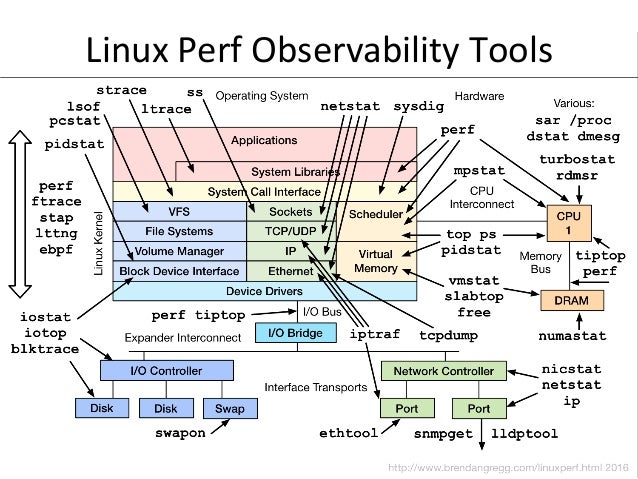
- 61. Linux Perf Observability Tools
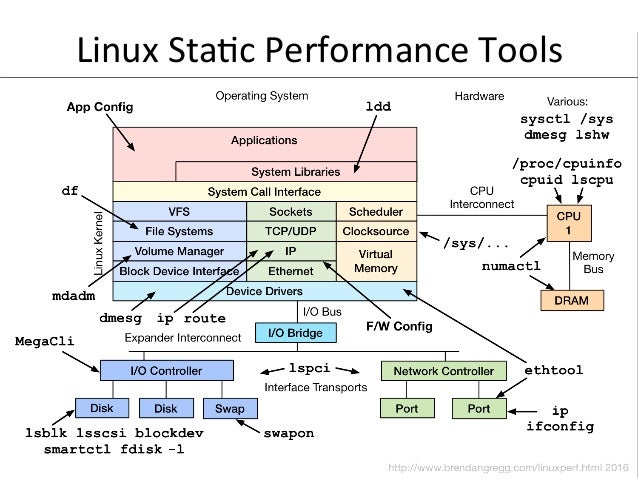
- 62. Linux StaQc Performance Tools
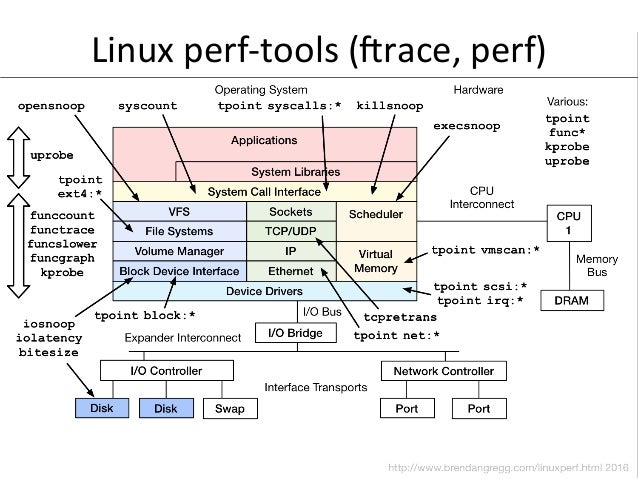
- 63. Linux perf-‐tools (mrace, perf)
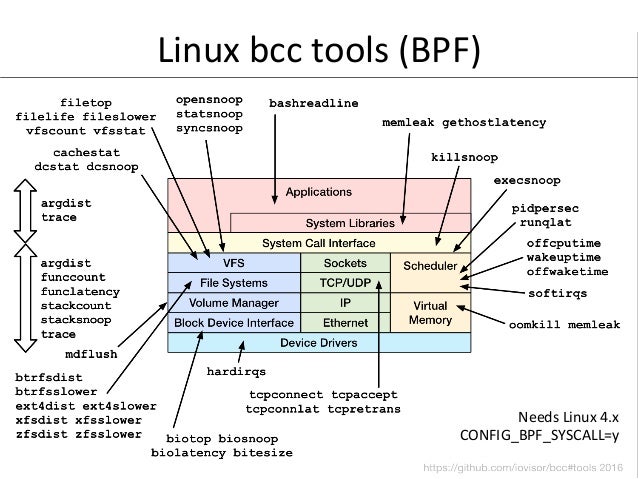
- 64. Linux bcc tools (BPF) Needs Linux 4.x CONFIG_BPF_SYSCALL=y
- 65. 11. USE Method A Methodology
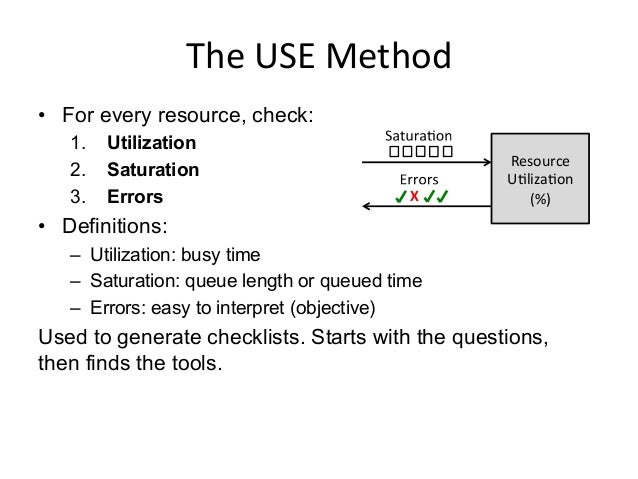
- 66. The USE Method • For every resource, check: 1. Utilization 2. Saturation 3. Errors • Definitions: – Utilization: busy time – Saturation: queue length or queued time – Errors: easy to interpret (objective) Used to generate checklists. Starts with the questions, then finds the tools. Resource UQlizaQon (%) X
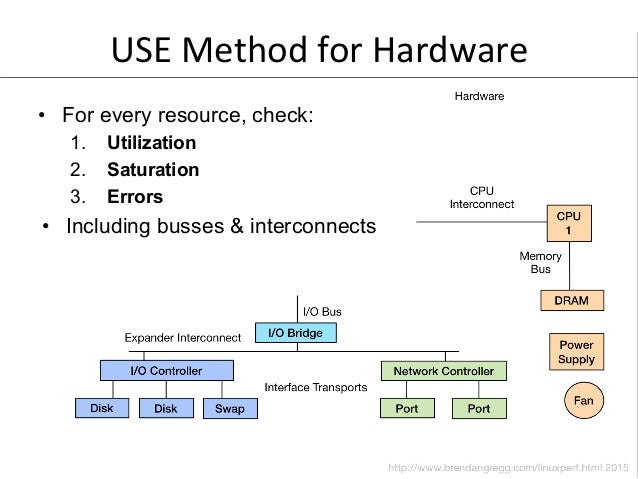
- 67. USE Method for Hardware • For every resource, check: 1. Utilization 2. Saturation 3. Errors • Including busses & interconnects
- 68. (hap://www.brendangregg.com/USEmethod/use-‐linux.html)
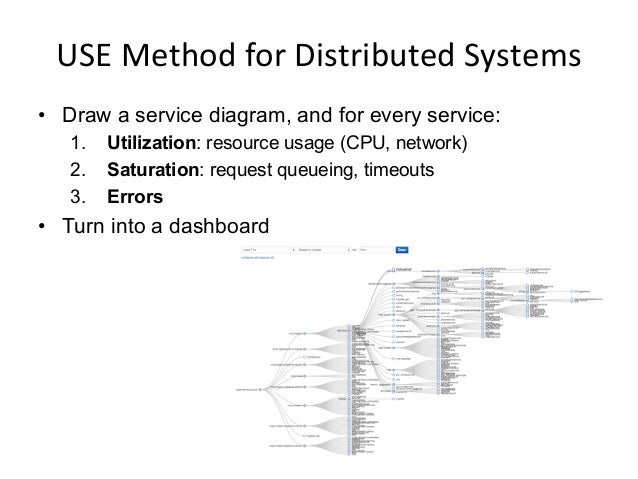
- 69. USE Method for Distributed Systems • Draw a service diagram, and for every service: 1. Utilization: resource usage (CPU, network) 2. Saturation: request queueing, timeouts 3. Errors • Turn into a dashboard
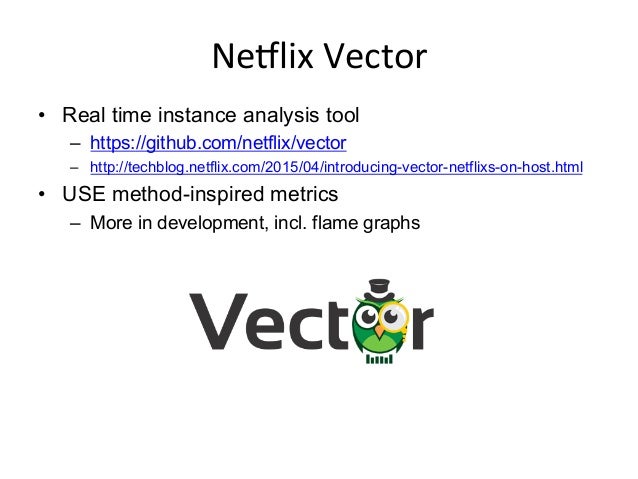
- 70. NeSlix Vector • Real time instance analysis tool – https://github.com/netflix/vector – http://techblog.netflix.com/2015/04/introducing-vector-netflixs-on-host.html • USE method-inspired metrics – More in development, incl. flame graphs
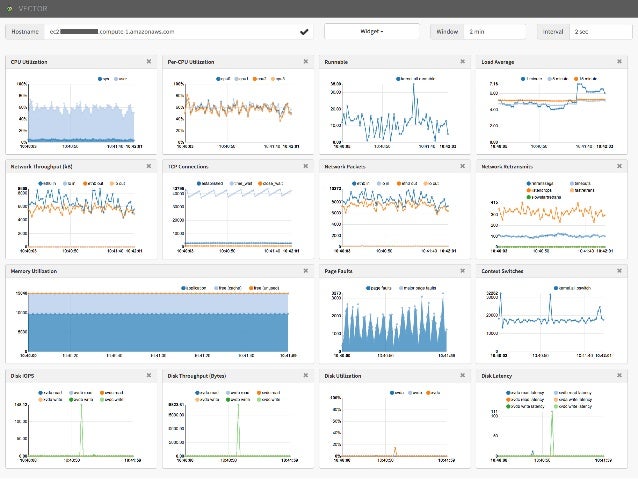
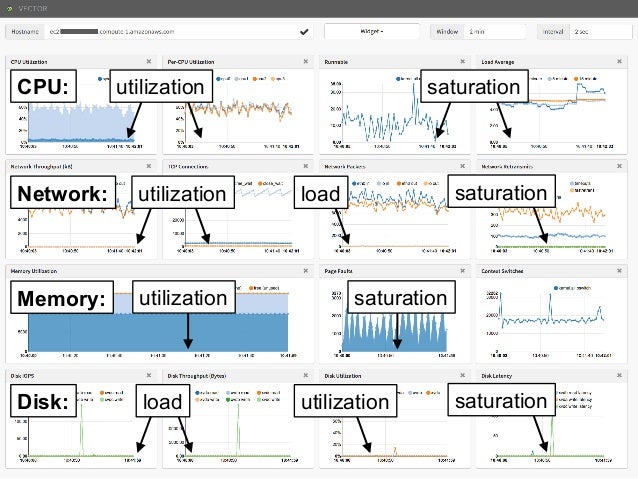
- 71. NeSlix Vector
- 72. NeSlix Vector utilization saturationCPU: utilization saturationNetwork: load utilization saturationMemory: load saturationDisk: utilization
- 73. 12. Bonus: External Factor Checklist
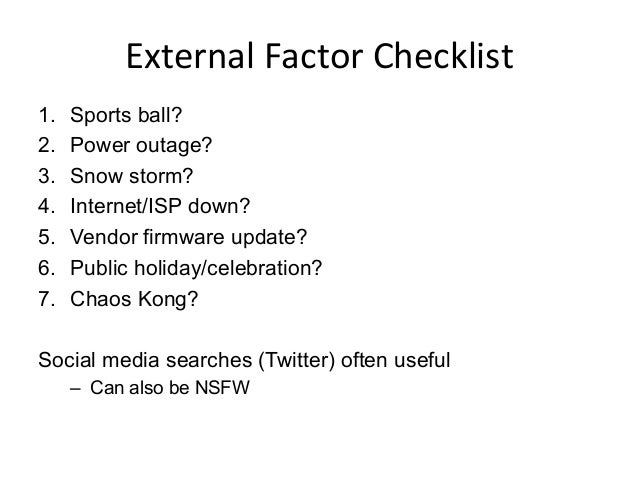
- 74. External Factor Checklist 1. Sports ball? 2. Power outage? 3. Snow storm? 4. Internet/ISP down? 5. Vendor firmware update? 6. Public holiday/celebration? 7. Chaos Kong? Social media searches (Twitter) often useful – Can also be NSFW
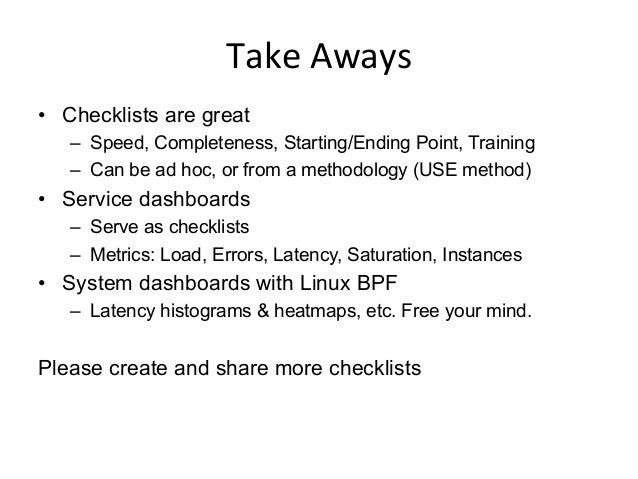
- 75. Take Aways • Checklists are great – Speed, Completeness, Starting/Ending Point, Training – Can be ad hoc, or from a methodology (USE method) • Service dashboards – Serve as checklists – Metrics: Load, Errors, Latency, Saturation, Instances • System dashboards with Linux BPF – Latency histograms & heatmaps, etc. Free your mind. Please create and share more checklists
- 76. References • Netflix Tech Blog: • http://techblog.netflix.com/2015/11/linux-performance-analysis-in-60s.html • http://techblog.netflix.com/2015/02/sps-pulse-of-netflix-streaming.html • http://techblog.netflix.com/2015/04/introducing-vector-netflixs-on-host.html • Linux Performance & BPF tools: • http://www.brendangregg.com/linuxperf.html • https://github.com/iovisor/bcc#tools • USE Method Linux: • http://www.brendangregg.com/USEmethod/use-linux.html • Flame Graphs: • http://www.brendangregg.com/FlameGraphs/cpuflamegraphs.html • Heat maps: • http://cacm.acm.org/magazines/2010/7/95062-visualizing-system-latency/fulltext • http://www.brendangregg.com/heatmaps.html • Books: • Beyer, B., et al. Site Reliability Engineering. O'Reilly,Apr 2016 • Gawande, A. The Checklist Manifesto. Metropolitan Books, 2008 • Gregg, B. Systems Performance. Prentice Hall, 2013 (more checklists & methods!) • Thanks: Netflix Perf & Core teams for predash, pretriage, Vector, etc
- 77. Thanks http://slideshare.net/brendangregg http://www.brendangregg.com [email protected] @brendangregg Netflix is hiring SREs!
Recommend
About Joyk
Aggregate valuable and interesting links.
Joyk means Joy of geeK