

New Features: Heroku Errors and a Magic Dashboard
source link: https://blog.appsignal.com/2021/05/06/heroku-errors.html
Go to the source link to view the article. You can view the picture content, updated content and better typesetting reading experience. If the link is broken, please click the button below to view the snapshot at that time.

“I absolutely love AppSignal.”
Discover AppSignal
We have been collecting Logplex data for our Heroku customers for a while now. With that data we create Magic Dashboards for Postgres and Redis integrations, and track Heroku Host Metrics.
Starting today, we also extract error incidents from Heroku Logplex data and provide you with a magic dashboard for Heroku status codes.
Heroku Errors
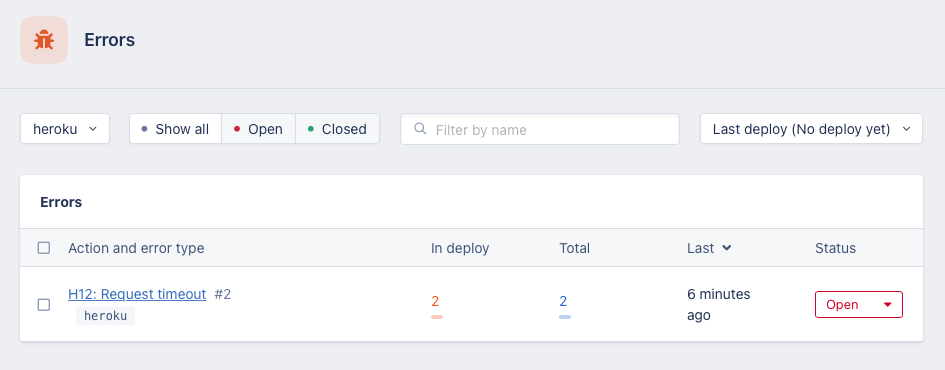
With the latest update to our Logplex parser, we can now extract Heroku errors from the data stream. We add a “heroku” namespace in AppSignal, where we capture errors such as “H12: Request timeout”, “H14: No web dynos running,” and many other error codes, complete with samples like any other error.
These errors can help you debug issues that might otherwise not be captured, such as the timeout error and no dyno’s running error. The AppSignal agent requires a running (Ruby/Elixir/Node.js) process to catch errors, and with these Logplex errors, we can capture the last missing errors in your Heroku stack.
Installation
To capture these errors, we need access to your Heroku logs. To do this, add a Heroku Logdrain as described in our Heroku Logdrain documentation.
A logdrain is easily added by using the Heroku CLI and running the following command in your application directory:
heroku drains:add "https://appsignal-endpoint.net/logplex?api_key=<push_api_key>&name=<app_name>&environment=<app_environment>"
Replace the placeholders with your AppSignal Push API key, app name, and environment. You can find these values on the “Push & Deploy” page on AppSignal.
Errors are captured automatically after adding the logdrain.
A Magic Dashboard with Heroku Status Codes
Together with these errors, we’ll also add a new Magic Dashboard to your app that tracks the overall response counts for each HTTP status code group (2xx, 3xx, 4xx, 5xx). This gives an overview of the overall response rates of your Heroku application. These metrics also allow you to set up Anomaly Detection triggers on the response codes to track any anomaly on Heroku.

Thanking Our Customers
We want to thank our customers who have contacted the support team for suggesting these features! If you would like to see something not already available on AppSignal, don’t hesitate to reach out, we’d love to hear from you!
If you are not using AppSignal yet, maybe this encourages you to try us out and experience our developer-to-developer support.
Recommend
-
11
Today, we’ve added a magic dashboard to the Node.js integration that shows you the performance and volume of your PostgreSQL queries. Making Things Easy for Node.js Users We’ve ensured that all the basics are in place to moni...
-
10
Today, we will dive into one of the hard parts of using any monitoring - making sense out of all the data that is emitted. We think this is one of the hard parts. And being developers building for developers, we think a lot like you do – we t...
-
9
Today we’re adding another Magic Dashboard! Here’s what we’ve added, and which metrics are useful to track. Heroku (host) metrics A while ago we introduced
-
9
Monitoring your application can be a difficult task if you’re just getting started with it. You need to know which metrics matter most and understand which ones you can combine into meaningful graphs. In the (not just holiday ⛄️) spiri...
-
7
We just released a Magic Dashboard for Garbage Collection stats for our Node.js integration. If you are leaking memory, this dashboard will help you discover and fix this problem. No setting up is required, this dashboard will magically autom...
-
20
New Dashboard features to save you timeStripe on Twitter The Stripe Dashboard is the hub for millions of businesses to take action—whether that’s a founder at a small startup that interacts directly w...
-
9
Listen to this article Remaining 10:57 ...
-
5
Fly.io: the Reclaimer of Heroku's Magic A 6 minute read. Heroku was catalytic to my career. It's been hard to watch the fall from grace. Don't get me wrong, Heroku still works, but it's obviously been in maintenan...
-
5
appsignalAppSignal for Ruby Gem 3.1: MRI VM Magic Dashboard
-
11
Introducing New Heroku Postgres Plans Posted by Jonathan K. BrownPr...
About Joyk
Aggregate valuable and interesting links.
Joyk means Joy of geeK