

How to identify the source of backpressure?
source link: https://flink.apache.org/2021/07/07/backpressure.html
Go to the source link to view the article. You can view the picture content, updated content and better typesetting reading experience. If the link is broken, please click the button below to view the snapshot at that time.
How to identify the source of backpressure?
07 Jul 2021 Piotr Nowojski (@PiotrNowojski)
Backpressure monitoring in the web UI
The backpressure topic was tackled from different angles over the last couple of years. However, when it comes to identifying and analyzing sources of backpressure, things have changed quite a bit in the recent Flink releases (especially with new additions to metrics and the web UI in Flink 1.13). This post will try to clarify some of these changes and go into more detail about how to track down the source of backpressure, but first…
What is backpressure?
This has been explained very well in an old, but still accurate, post by Ufuk Celebi. I highly recommend reading it if you are not familiar with this concept. For a much deeper and low-level understanding of the topic and how Flink’s network stack works, there is a more advanced explanation available here.
At a high level, backpressure happens if some operator(s) in the Job Graph cannot process records at the same rate as they are received. This fills up the input buffers of the subtask that is running this slow operator. Once the input buffers are full, backpressure propagates to the output buffers of the upstream subtasks. Once those are filled up, the upstream subtasks are also forced to slow down their records’ processing rate to match the processing rate of the operator causing this bottleneck down the stream. Backpressure further propagates up the stream until it reaches the source operators.
As long as the load and available resources are static and none of the operators produce short bursts of data (like windowing operators), those input/output buffers should only be in one of two states: almost empty or almost full. If the downstream operator or subtask is able to keep up with the influx of data, the buffers will be empty. If not, then the buffers will be full [1]. In fact, checking the buffers’ usage metrics was the basis of the previously recommended way on how to detect and analyze backpressure described a couple of years back by Nico Kruber. As I mentioned in the beginning, Flink now offers much better tools to do the same job, but before we get to that, there are two questions worth asking.
Why should I care about backpressure?
Backpressure is an indicator that your machines or operators are overloaded. The buildup of backpressure directly affects the end-to-end latency of the system, as records are waiting longer in the queues before being processed. Secondly, aligned checkpointing takes longer with backpressure, while unaligned checkpoints will be larger (you can read more about aligned and unaligned checkpoints in the documentation. If you are struggling with checkpoint barriers propagation times, taking care of backpressure would most likely help to solve the problem. Lastly, you might just want to optimize your job in order to reduce the costs of running the job.
In order to address the problem for all cases, one needs to be aware of it, then locate and analyze it.
Why shouldn’t I care about backpressure?
Frankly, you do not always have to care about the presence of backpressure. Almost by definition, lack of backpressure means that your cluster is at least ever so slightly underutilized and over-provisioned. If you want to minimize idling resources, you probably can not avoid incurring some backpressure. This is especially true for batch processing.
How to detect and track down the source of backpressure?
One way to detect backpressure is to use metrics, however, in Flink 1.13 it’s no longer necessary to dig so deep. In most cases, it should be enough to just look at the job graph in the Web UI.
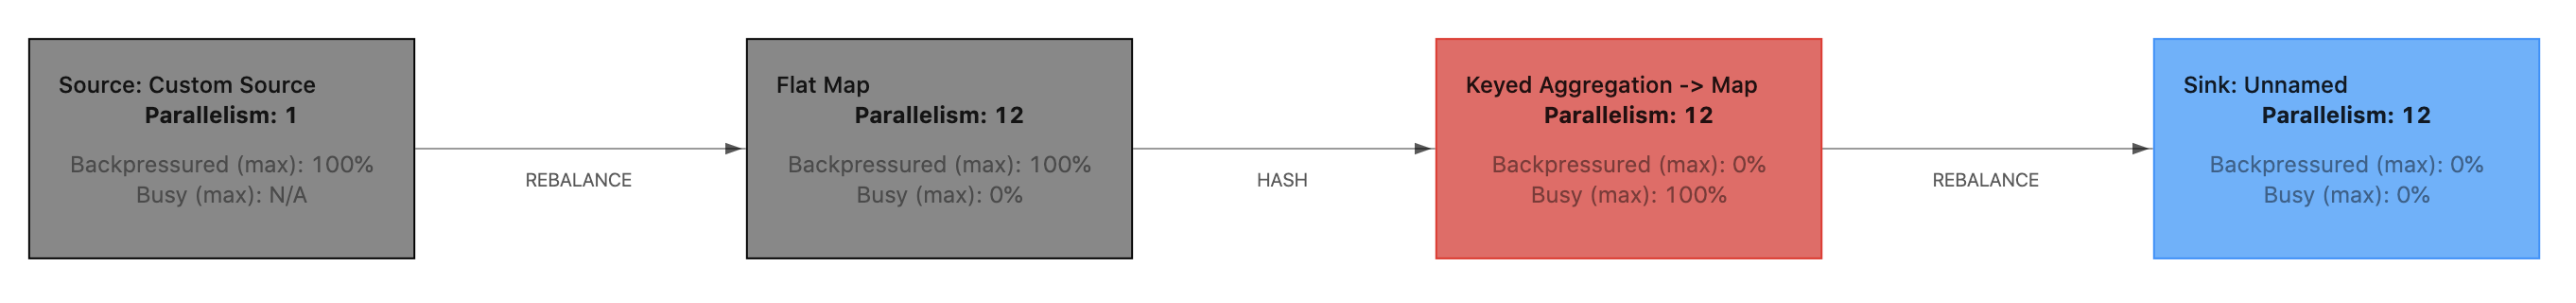
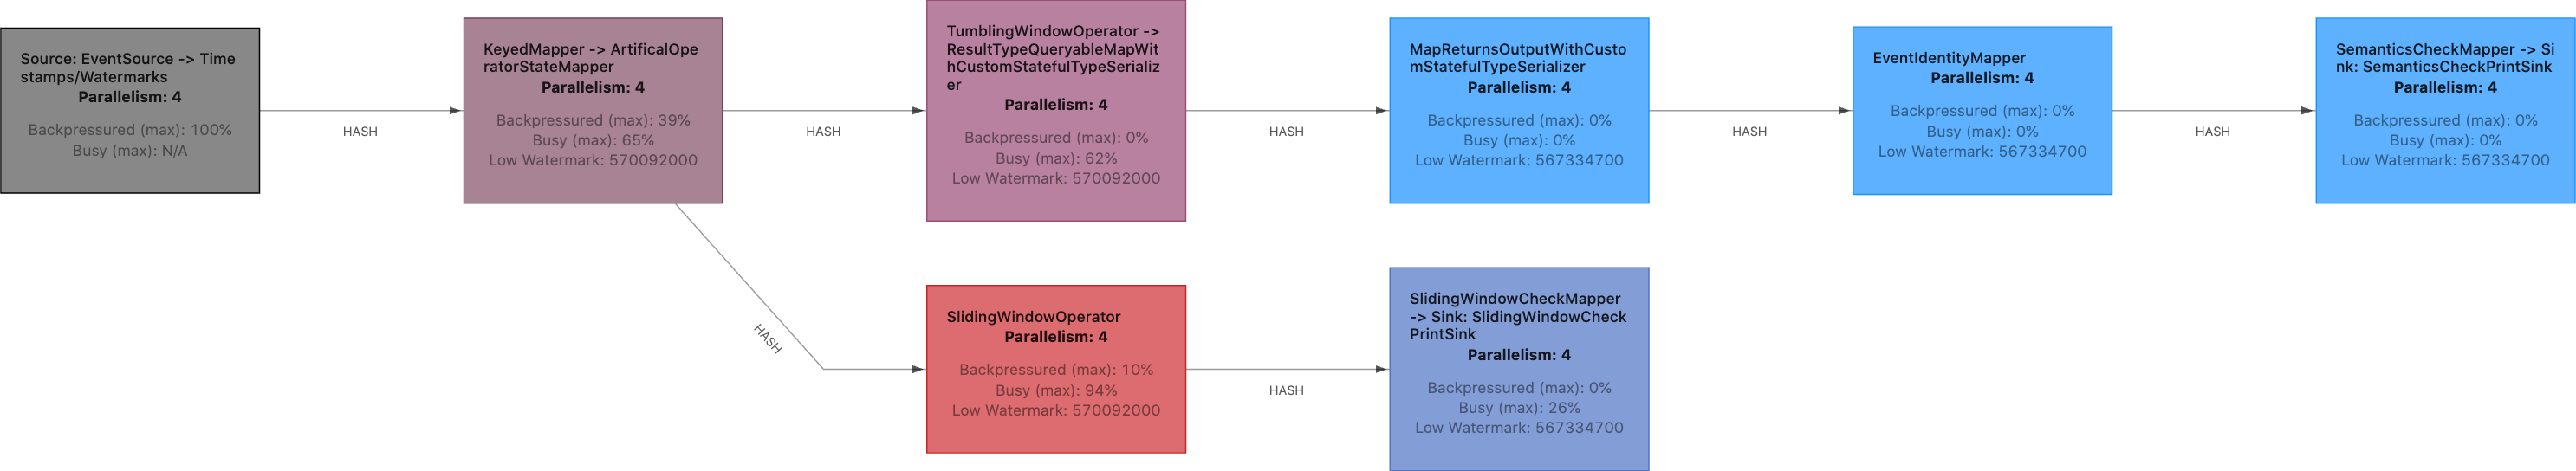
The first thing to note in the example above is that different tasks have different colors. Those colors represent a combination of two factors: under how much backpressure this task is and how busy it is. Idling tasks will be blue, fully busy tasks will be red hot, and fully backpressured tasks will be black. Anything in between will be a combination/shade of those three colors. With this knowledge, one can easily spot the backpressured tasks (black). The busiest (red) task downstream of the backpressured tasks will most likely be the source of the backpressure (the bottleneck).
If you click on one particular task and go into the “BackPressure” tab you will be able to further dissect the problem and check what is the busy/backpressured/idle status of every subtask in that task. For example, this is especially handy if there is a data skew and not all subtasks are equally utilized.
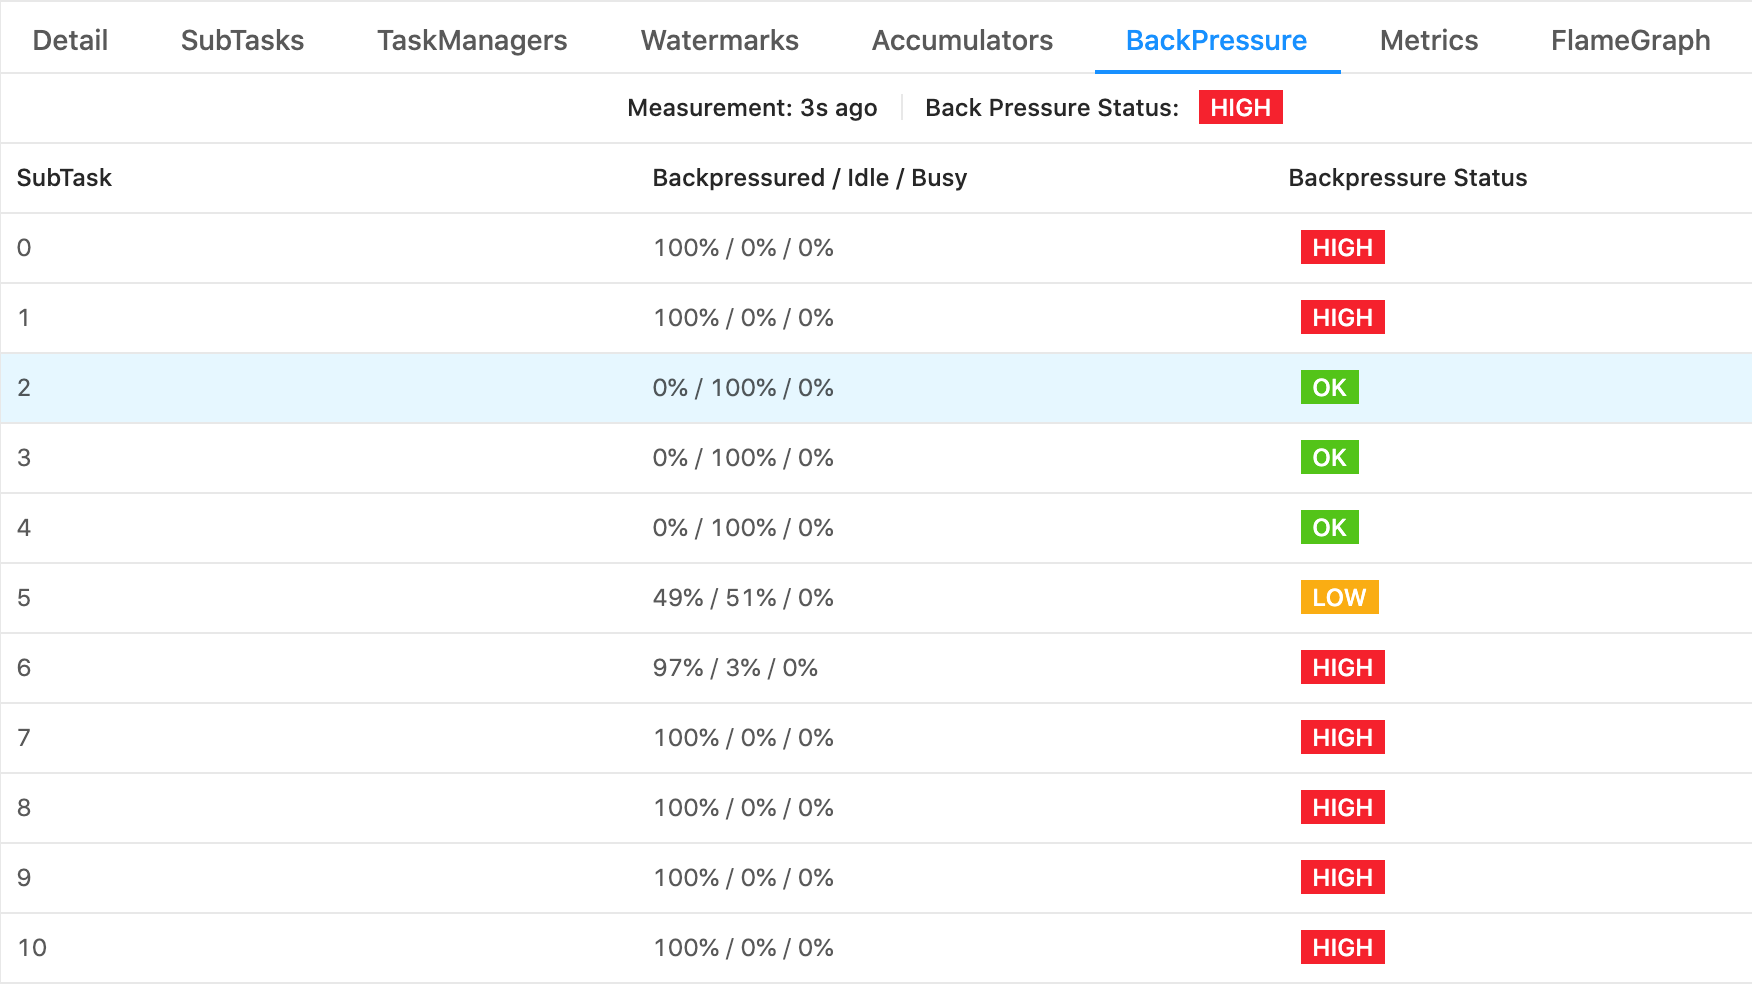
Backpressure among subtasks
In the above example, we can clearly see which subtasks are idling, which are backpressured, and that none of them are busy. And frankly, in a nutshell, that should be enough to quickly understand what is happening with your Job :) However, there are a couple of more details worth explaining.
What are those numbers?
If you are curious how it works underneath, we can go a little deeper. At the base of this new mechanism we have three new metrics that are exposed and calculated by each subtask:
idleTimeMsPerSecondbusyTimeMsPerSecondbackPressuredTimeMsPerSecond
Each of them measures the average time in milliseconds per second that the subtask spent being idle, busy, or backpressured respectively. Apart from some rounding errors they should complement each other and add up to 1000ms/s. In essence, they are quite similar to, for example, CPU usage metrics.
Another important detail is that they are being averaged over a short period of time (a couple of seconds)
and they take into account everything that is happening inside the subtask’s thread: operators, functions,
timers, checkpointing, records serialization/deserialization, network stack, and other Flink internal
overheads. A WindowOperator that is busy firing timers and producing results will be reported as busy or backpressured.
A function doing some expensive computation in CheckpointedFunction#snapshotState call, for instance flushing
internal buffers, will also be reported as busy.
One limitation, however, is that busyTimeMsPerSecond and idleTimeMsPerSecond metrics are oblivious
to anything that is happening in separate threads, outside of the main subtask’s execution loop.
Fortunately, this is only relevant for two cases:
- Custom threads that you manually spawn in your operators (a discouraged practice).
- Old-style sources that implement the deprecated
SourceFunctioninterface. Such sources will reportNaN/N/Aas the value for busyTimeMsPerSecond. For more information on the topic of Data Sources please take a look here.
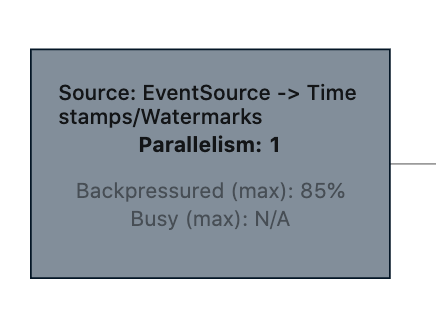
Old-style sources do not report busy time
In order to present those raw numbers in the web UI, those metrics need to be aggregated from all subtasks (on the job graph we are showing only tasks). This is why the web UI presents the maximal value from all subtasks of a given task and why the aggregated maximal values of busy and backpressured may not add up to 100%. One subtask can be backpressured at 60%, while another can be busy at 60%. This can result in a task that is both backpressured and busy at 60%.
Varying load
There is one more thing. Do you remember that those metrics are measured and averaged over a couple of seconds?
Keep this in mind when analyzing jobs or tasks with varying load, such as (sub)tasks containing a WindowOperator
that is firing periodically. Both the subtask with a constant load of 50% and the subtask that alternates every
second between being fully busy and fully idle will be reporting the same value of busyTimeMsPerSecond
of 500ms/s.
Furthermore, varying load and especially firing windows can move the bottleneck to a different place in the job graph:
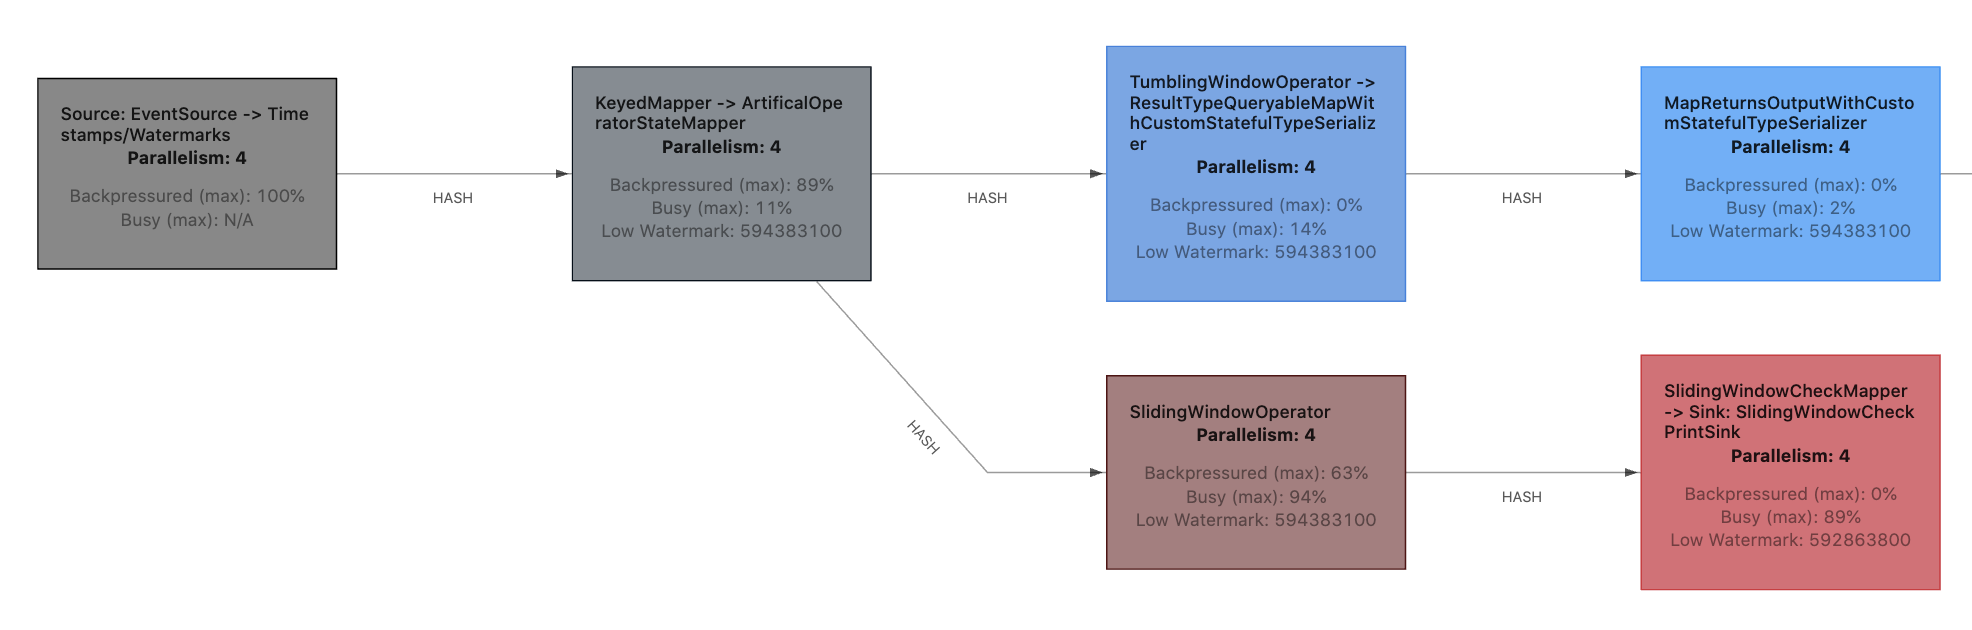
Bottleneck alternating between two tasks
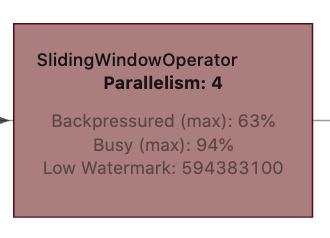
SlidingWindowOperator
In this particular example, SlidingWindowOperator was the bottleneck as long as it was accumulating records.
However, as soon as it starts to fire its windows (once every 10 seconds), the downstream task
SlidingWindowCheckMapper -> Sink: SlidingWindowCheckPrintSink becomes the bottleneck and SlidingWindowOperator
gets backpressured. As those busy/backpressured/idle metrics are averaging time over a couple of seconds,
this subtlety is not immediately visible and has to be read between the lines. On top of that, the web UI
is updating its state only once every 10 seconds, which makes spotting more frequent changes a bit more difficult.
What can I do with backpressure?
In general this is a complex topic that is worthy of a dedicated blog post. It was, to a certain extent, addressed in previous blog posts. In short, there are two high-level ways of dealing with backpressure. Either add more resources (more machines, faster CPU, more RAM, better network, using SSDs…) or optimize usage of the resources you already have (optimize the code, tune the configuration, avoid data skew). In either case, you first need to analyze what is causing backpressure by:
- Identifying the presence of backpressure.
- Locating which subtask(s) or machines are causing it.
- Digging deeper into what part of the code is causing it and which resource is scarce.
Backpressure monitoring improvements and metrics can help you with the first two points. To tackle the last one, profiling the code can be the way to go. To help with profiling, also starting from Flink 1.13, Flame Graphs are integrated into Flink’s web UI. Flame Graphs is a well known profiling tool and visualization technique and I encourage you to give it a try.
But keep in mind that after locating where the bottleneck is, you can analyze it the same way you would any other non-distributed application (by checking resource utilization, attaching a profiler, etc). Usually there is no silver bullet for problems like this. You can try to scale up but sometimes it might not be easy or practical to do.
Anyway… The aforementioned improvements to backpressure monitoring allow us to easily detect the source of backpressure, and Flame Graphs can help us to analyze why a particular subtask is causing problems. Together those two features should make the previously quite tedious process of debugging and performance analysis of Flink jobs that much easier! Please upgrade to Flink 1.13.x and try them out!
[1] There is a third possibility. In a rare case when network exchange is actually the bottleneck in your job, the downstream task will have empty input buffers, while upstream output buffers will be full.
Recommend
About Joyk
Aggregate valuable and interesting links.
Joyk means Joy of geeK