
10

seaborn常用的10种数据分析图表
source link: https://zhuanlan.zhihu.com/p/130510767
Go to the source link to view the article. You can view the picture content, updated content and better typesetting reading experience. If the link is broken, please click the button below to view the snapshot at that time.
seaborn常用的10种数据分析图表
公号:Python大数据分析,关注进学习群
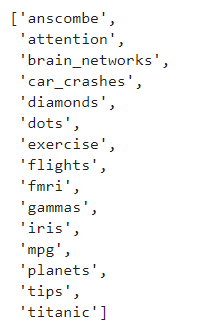
内置示例数据集
seaborn内置了十几个示例数据集,通过load_dataset函数可以调用。
其中包括常见的泰坦尼克、鸢尾花等经典数据集。
# 查看数据集种类
import seaborn as sns
sns.get_dataset_names()
import seaborn as sns
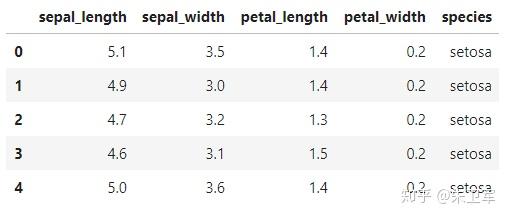
# 导出鸢尾花数据集
data = sns.load_dataset('iris')
data.head()
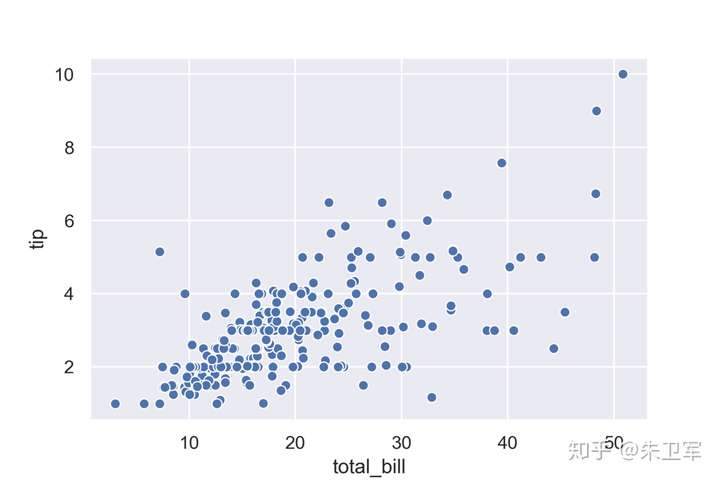
1、散点图
函数sns.scatterplot
import seaborn as sns
sns.set()
import matplotlib.pyplot as plt
%matplotlib inline
# 小费数据集
tips = sns.load_dataset('tips')
ax = sns.scatterplot(x='total_bill',y='tip',data=tips)
plt.show()
2、条形图
函数sns.barplot
显示数据平均值和置信区间
import seaborn as sns
sns.set()
import matplotlib.pyplot as plt
%matplotlib inline
# 小费数据集
tips = sns.load_dataset("tips")
ax = sns.barplot(x="day", y="total_bill", data=tips)
plt.show()
3、线型图
函数sns.lineplot
绘制折线图和置信区间
import seaborn as sns
sns.set()
import matplotlib.pyplot as plt
%matplotlib inline
fmri = sns.load_dataset("fmri")
ax = sns.lineplot(x="timepoint", y="signal", data=fmri)
plt.show()
4、箱线图
函数seaborn.boxplot
import seaborn as sns
sns.set()
import matplotlib.pyplot as plt
%matplotlib inline
tips = sns.load_dataset("tips")
ax = sns.boxplot(x="day", y="total_bill", data=tips)
plt.show()
5、直方图
函数seaborn.distplot
import seaborn as sns
import numpy as np
sns.set()
import matplotlib.pyplot as plt
%matplotlib inline
np.random.seed(0)
x = np.random.randn(1000)
ax = sns.distplot(x)
plt.show()
6、热力图
函数seaborn.heatmap
import numpy as np
np.random.seed(0)
import seaborn as sns
sns.set()
import matplotlib.pyplot as plt
%matplotlib inline
uniform_data = np.random.rand(10, 12)
ax = sns.heatmap(uniform_data)
plt.show()
7、散点图矩阵
函数sns.pairplot
import seaborn as sns
sns.set()
import matplotlib.pyplot as plt
%matplotlib inline
iris = sns.load_dataset("iris")
ax = sns.pairplot(iris)
plt.show()
8、分类散点图
函数seaborn.catplot
import seaborn as sns
sns.set()
import matplotlib.pyplot as plt
%matplotlib inline
exercise = sns.load_dataset("exercise")
ax = sns.catplot(x="time", y="pulse", hue="kind", data=exercise)\
plt.show()
9、计数条形图
函数seaborn.countplot
import seaborn as sns
sns.set()
import matplotlib.pyplot as plt
%matplotlib inline
titanic = sns.load_dataset("titanic")
ax = sns.countplot(x="class", data=titanic)
plt.show()
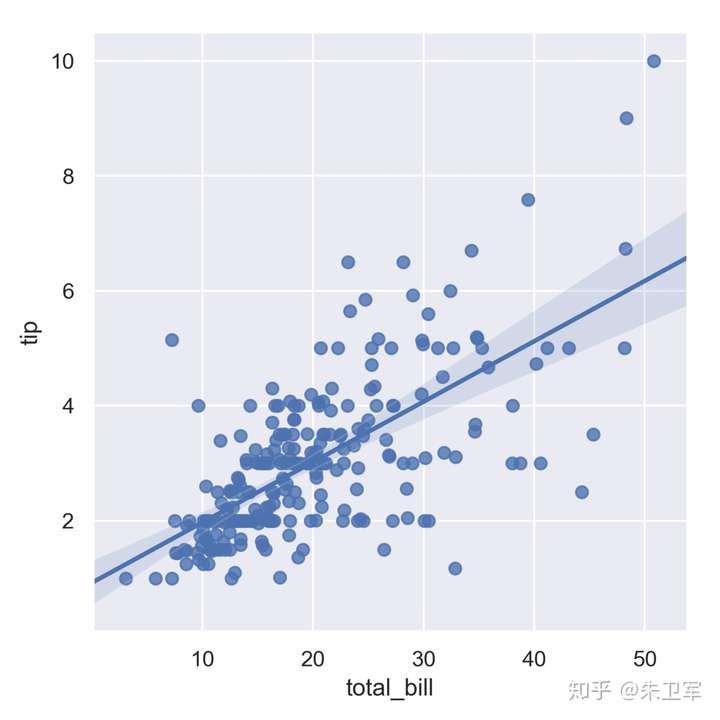
10、回归图
函数 seaborn.lmplot
绘制散点及回归图
import seaborn as sns
sns.set()
import matplotlib.pyplot as plt
%matplotlib inline
tips = sns.load_dataset("tips")
ax = sns.lmplot(x="total_bill", y="tip", data=tips)

plt.show()
Recommend
About Joyk
Aggregate valuable and interesting links.
Joyk means Joy of geeK