

Using the Shelly Plug to monitor Starlink's power consumption
source link: https://www.jeffgeerling.com/blog/2021/using-shelly-plug-monitor-starlinks-power-consumption
Go to the source link to view the article. You can view the picture content, updated content and better typesetting reading experience. If the link is broken, please click the button below to view the snapshot at that time.
Using the Shelly Plug to monitor Starlink's power consumption
April 19, 2021
I recently wrote about using a Raspberry Pi to remotely monitor an Internet connection, and in my case, to monitor Starlink (SpaceX's satellite Internet service).
One other important thing I wanted to monitor was how much power Starlink used over time, and I was considering just manually taking a reading off my Kill-A-Watt every morning, but that's boring. And not very accurate since it's one point in time per day.

Digging around, I found out about the Shelly Plug US, which had its own little built-in HTTP API and a supposedly-accurate power monitor. It's based on the ESP8266, and you can even flash alternative firmware like Tasmota for more control over the device.
Getting Shelly Plug US
At the time of writing, the Shelly Plug US seemed to be stuck in pre-order status, but there were some available on eBay, so I bought one from someone who seemed reputable there.
When it arrived, it was in a very tidy little box hardly larger than the plug itself, and I am happy to report it's not a fake or knockoff (I'm always a little nervous buying IoT devices from eBay. Though Amazon has also been vying for the 'who should I trust the least' slot lately).
Setting up the Shelly Plug
I didn't want to create a Shelly Cloud account, use the Shelly App, and all that jazz. I'd rather not have some of my home's electrical infrastructure controllable over the Internet by default.
So instead, I did the following:
- Plug in the Shelly Plug, and plug a load into it (in this case, my Starlink power brick, which powers the Starlink dish and router).
- Press the power button on it to turn it on.
- On my Mac, connect to the
shellyplug___network (the Plug is in AP mode by default). - Wait for a DHCP address on my Mac, then connect to the
.1of that CIDR (in my case, I connected to192.168.33.1in my browser).
At this point, I got to the Shelly Plug web UI:
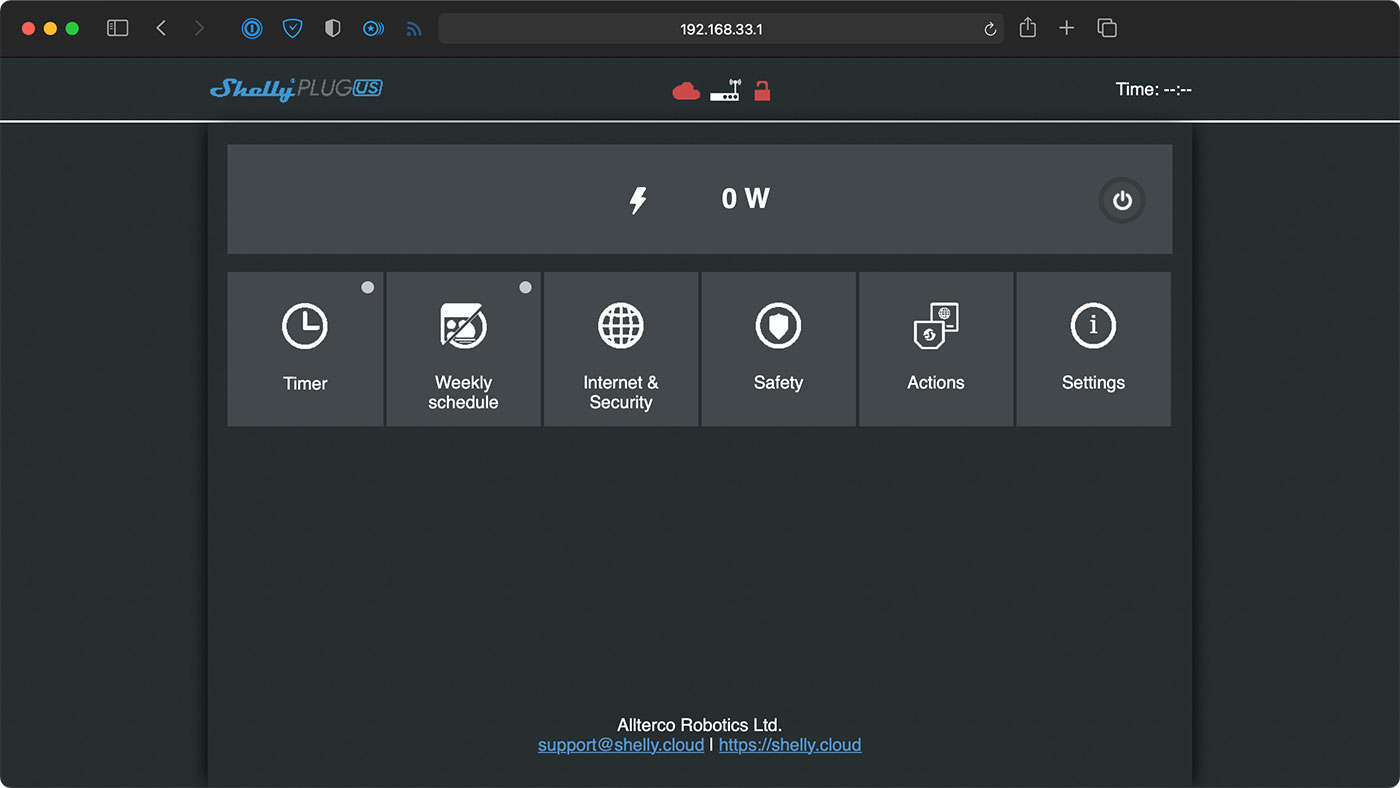
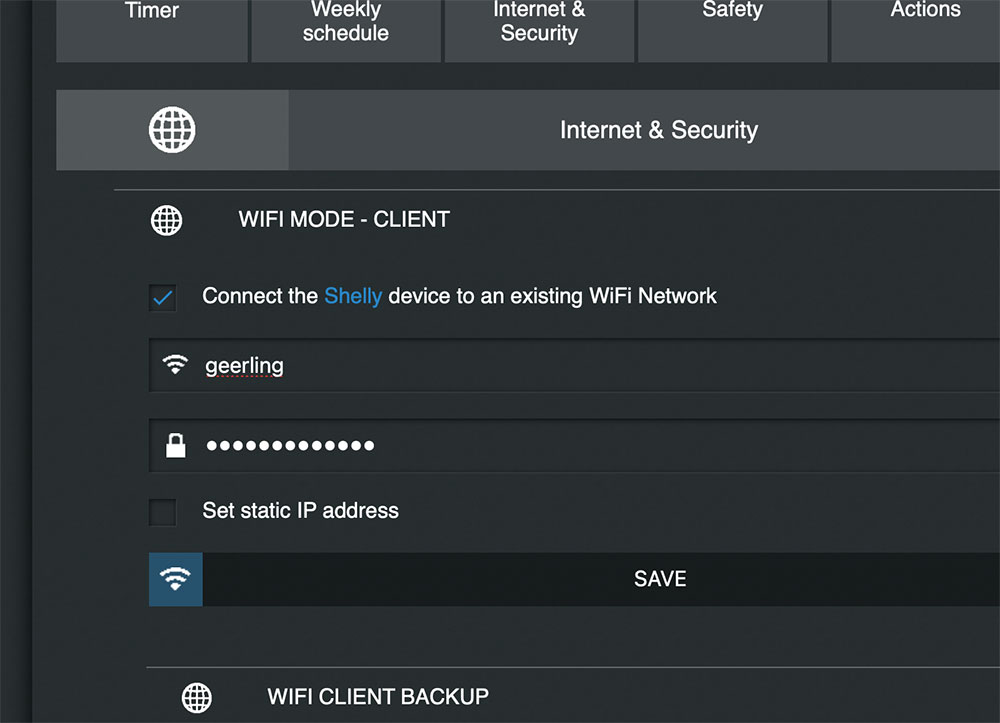
I went to the 'Internet & Security' pane, and set the Plug to connect to my existing WiFi network (note: the Plug only operates on 2.4 GHz, so don't try connecting to a 5 GHz-only network!):
Then I used fing (you could also use nmap) to find the new Shelly plug once it had connected to my WiFi network. If you set a static IP you could skip this step.
I connected back to it again, then updated my DHCP and DNS servers to add a static IP address and DNS mapping for the plug, so it would be easy to connect to it inside my house at shelly1.geerli.net.
Note: I also updated the device's firmware at this point, and set a Web UI access password. It's better than nothing, but in general, if you don't trust the company that makes the device (and even if you do...), don't buy it, or segregate it on a separate WiFi network.
Getting power consumption
I dug into the Shelly Plug API to see how I could get the one valuable bit of information I wanted out of it: the current power consumption.
And it looks like I can get that data through the endpoint /meter/0, so I confirmed as much with curl:
$ curl http://admin:[email protected]/meter/0
{"power":85.05,"overpower":0.00,"is_valid":true,"timestamp":1618501251,"counters":[90.138, 26.141, 0.000],"total":116}
The power is returned in Watts, and the total is "Total energy consumed by the attached electrical appliance in Watt-minute", which I'm guessing is reset every now and then. No problem, we'll be using the spot value from power, and we can aggregate the data to get things like daily/weekly/monthly totals later.
Monitoring the data with Prometheus and Grafana
All right, so I have a way to get the data from the Shelly plug, but I want to add a graph of this data over time, to see if there are any trends (e.g. does Dishy consume more energy at night, or on a cloudy or stormy day?), and to have a 100% accurate calculation of the kilowatt-hours of energy it consumes (which can be converted into a cost estimation for other people interested in Starlink).
I initially dug into the Prometheus documentation for how to generate metrics using their official client libraries (see Writing exporters), but it seemed like that documentation—and most everything else on the internet like it—was laser-focused on "getting app metric data out of your [Go|Python|Ruby|etc.] app", and not on the use case of "write a really simple scraper that drops a couple values into Prometheus."
# HELP my_metric A metric I'm interested in monitoring, like power in Watts.
# TYPE my_metric gauge
my_metric 79
So I just looked at the expected metrics endpoint output format (above), pulled out my golden hammer (PHP), and wrote a 52-line PHP script (see my shelly-plug-prometheus project) that:
- Grabs some environment vars for connection configuration.
- Requests the metrics endpoint for the Shelly Plug.
- Parses out relevant metrics.
- Returns that data at the /metrics endpoint.
And being a super-lazy developer (lazy could also be called 'efficient'), I didn't want to spend the extra 5 minutes building a Docker image and maintaining that, so I built the PHP script so I could just run it inside an instance of the official PHP Docker image like so:
docker run -d -p 9924:80 --name shelly-plug \
  -e SHELLY_HOSTNAME='my-shelly-plug-host-or-ip' \
  -e SHELLY_HTTP_USERNAME='username' \
  -e SHELLY_HTTP_PASSWORD='password' \
  -v "$PWD":/var/www/html \
  php:8-apache
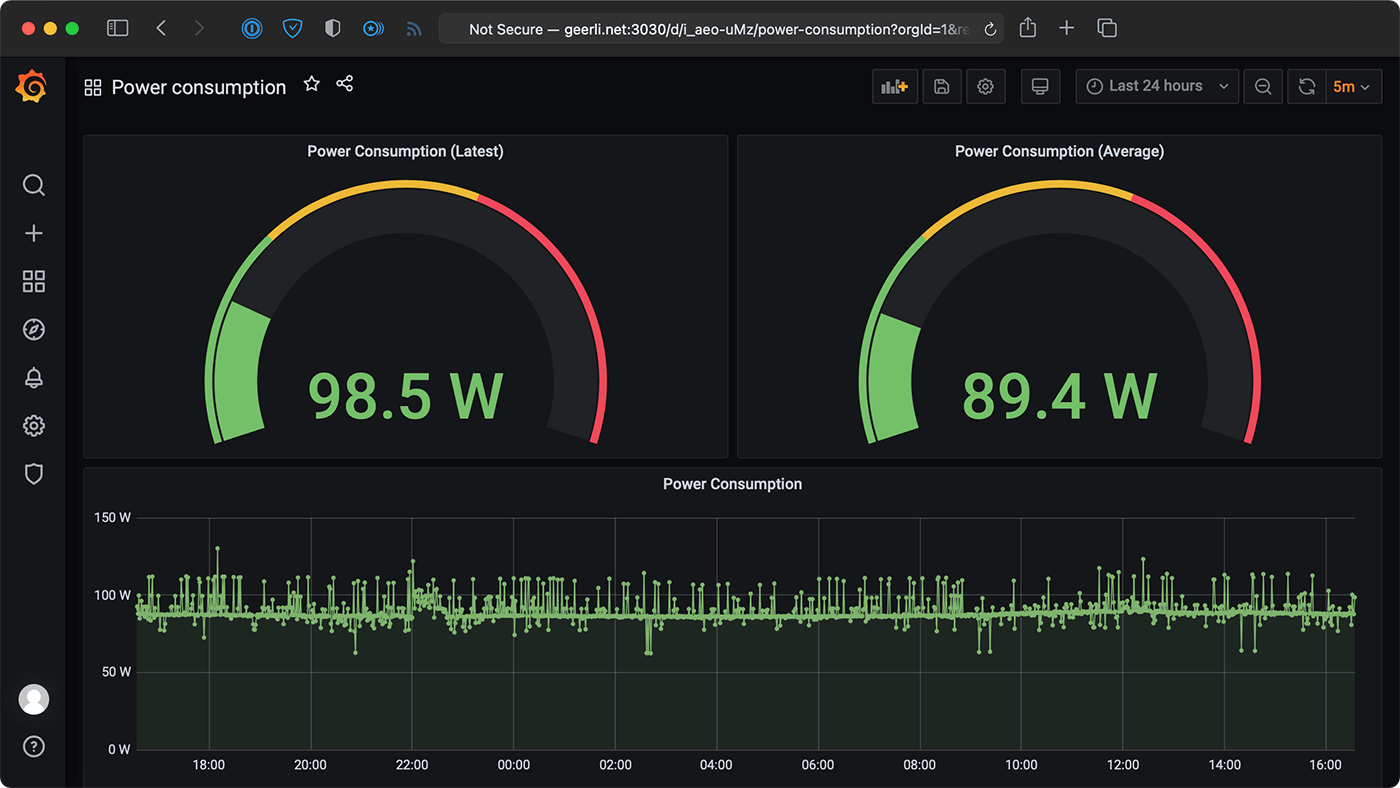
I added configuration to start the Shelly Plug monitoring container to my internet-pi repository, deployed it to the Raspberry Pi that dutifully reminds me how often my main ISP (Spectrum) does not give me near the performance I pay for, and then built a dashboard that shows me power usage:
That dashboard is in code here: https://github.com/geerlingguy/internet-monitoring/blob/master/grafana/provisioning/dashboards/power-consumption.json.
The one thing missing is a display of kWh for the selected time period (or just a graph of kWh per day or something like that). My Grafana-foo is not yet good enough to figure out how to put the math involved in translating point-in-time Watt readings (or one average) into a kWh display using Prometheus data (it seems like the people who do power monitoring with Grafana mostly use InfluxDB and the query syntax there is more familiar to me).
Yes, I know I could use Home Assistant to do all this, but I don't right now and I'm still waiting for more maturation in the whole "Connected Home" space before I trust putting even more things in my living space into some central API!
And yes, I know I could also configure MQTT to do some of this stuff, but I don't currently use MQTT so it's as much work (for now) to create a separate exporter and manage the data myself.
Conclusion
Since I found the Shelly Plug, I'm happy enough with it. It saved me from trying to build some sort of Pi or Pico-connected power measurement device, though I'm surprised more manufacturers don't have power-monitoring smart plugs.
I mean, P3 International, makers of the Kill-A-Watt, would be a shoe in for 'easily incorporate the already-measured data into a dashboard', I would think.
As it is, there are only a few smart plugs that do power monitoring on the device / appliance-level. Otherwise you have to build a whole home monitoring solution in your electrical box, and you can only really get the data there on a circuit-level.
I'll be reviewing SpaceX's Starlink more in-depth soon, but for now, it seems to use about 90W continuously, on average, all day every day, with very few spikes above 100W, and seemingly no power consumption correlation to transmit/receive activity or weather.
Recommend
About Joyk
Aggregate valuable and interesting links.
Joyk means Joy of geeK