

Ganglia Cluster Monitoring: monitoring spark cluster
source link: https://blog.knoldus.com/ganglia-cluster-monitoring-monitoring-spark-cluster/
Go to the source link to view the article. You can view the picture content, updated content and better typesetting reading experience. If the link is broken, please click the button below to view the snapshot at that time.

Ganglia Cluster Monitoring: monitoring spark cluster
Reading Time: 3 minutes
Ganglia is cluster monitoring tool to monitor the health of distributed cluster of spark and hadoop. I know you all have question that we already have a Application UI (http://masternode:4040) and Cluster UI (http://masternode:8080) then why we need ganglia? So answer is, Spark cluster UI and application UI dont provide us all information related to our cluster like Network I/O and health of every node. And with the help of spark default monitoring we cant monitor whole cluster hardware health and all matrices for each parameter like cpu usage, ip addresses, memory etc. So we now we got the answer that ganglia use for Advance Monitoring of any cluster.
Now we see how Ganglia works and its internal architecture.
Ganglia have 3 main components as follows:
- gmond: gmond is monitoring deamon which collect data from each node in the cluster and send it to specific host.
- gmetad: gmetad is a metadata deamon to collect data from the monitoring deamons and store it into RRD(round robin database).
- Ganglia web interface: Its provide a web interface which aggregate all node data and represent in metrics form and we can monitor specific node of cluster.
So from above component we can draw the below architecture
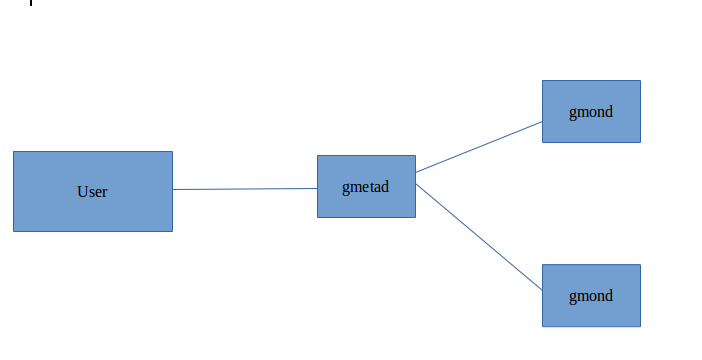
In the above diagram the gmond collect data at each node and send to gmetad and use can monitor it with web-interface.
Now we see how to install ganglia and configure it:
To install ganglia we run following commands
sudo apt-get install ganglia-monitor rrdtool gmetad ganglia-webfrontend
Above command install ganglia monitor, rrd tool,gmetad and ganglia-webfrontend services.
Now to run ganglia on apache2 server we need to copy /etc/ganglia-webfrontend/apache.conf into /etc/apache2/sites-enabled/ganglia.conf, so run following command.
sudo cp /etc/ganglia-webfrontend/apache.conf /etc/apache2/sites-enabled/ganglia.conf
And on other nodes or we can say worker node we need to install ganglia monitor which is gmond deamon.
sudo apt-get install ganglia-monitor
Configure ganglia for spark cluster
We just set up our spark cluster on single machine for demo so after setup spark cluster we need to configure ganglia.
So we consider our gmetad is master of spark cluster so configure /etc/ganglia/gmetad.conf on master machine as follows
data_source “myCluster” 30 masternode:8649
setuid_username “xyz”
In the above config data_source line is the name of the cluster , time after that host collect data here its 30 seconds and hostname which collect it.
And now we need to configure etc/ganglia/gmond.conf on each worker machine of spark cluster as follows
globals {
daemonize = yes
setuid = yes
user = ganglia
debug_level = 0
max_udp_msg_len = 1472
mute = no
deaf = no
host_dmax = 0
cleanup_threshold = 400
gexec = no
send_metadata_interval = 20
}
/* If a cluster attribute is specified, then all gmond hosts are wrapped inside
* of a <CLUSTER> tag. If you do not specify a cluster tag, then all <HOSTS> will
* NOT be wrapped inside of a <CLUSTER> tag. */
cluster {
name = “myCluster”
owner = “clusterOwner”
latlong = “unspecified”
url = “unspecified”
}
/* The host section describes attributes of the host, like the location */
host {
location = “unspecified”
}
/* Feel free to specify as many udp_send_channels as you like. Gmond
used to only support having a single channel */
udp_send_channel {
host = localhost
port = 8649
ttl = 1
}
/* You can specify as many udp_recv_channels as you like as well. */
udp_recv_channel {
port = 8649
}
/* You can specify as many tcp_accept_channels as you like to share
an xml description of the state of the cluster */
tcp_accept_channel {
port = 8649
}
Right now we have a single machine cluster so we set host as local host you can set master machine host in it, Configure gmond.conf on each worker machine.
ganglia use rrd so you need to create directory for rrd to store gmetad data on master machine as follows
 sudo mkdir –p /var/lib/ganglia/rrds

sudo chown -R xyz /var/lib/ganglia/
Now we need to start services as follows
sudo service ganglia-monitor start
sudo service gmetad start
sudo service apache2 start
Now ganglia start collecting data of your cluster if you want to monitor your cluster go to localhost/ganglia and explore interesting information of spark cluster in web-interface like below
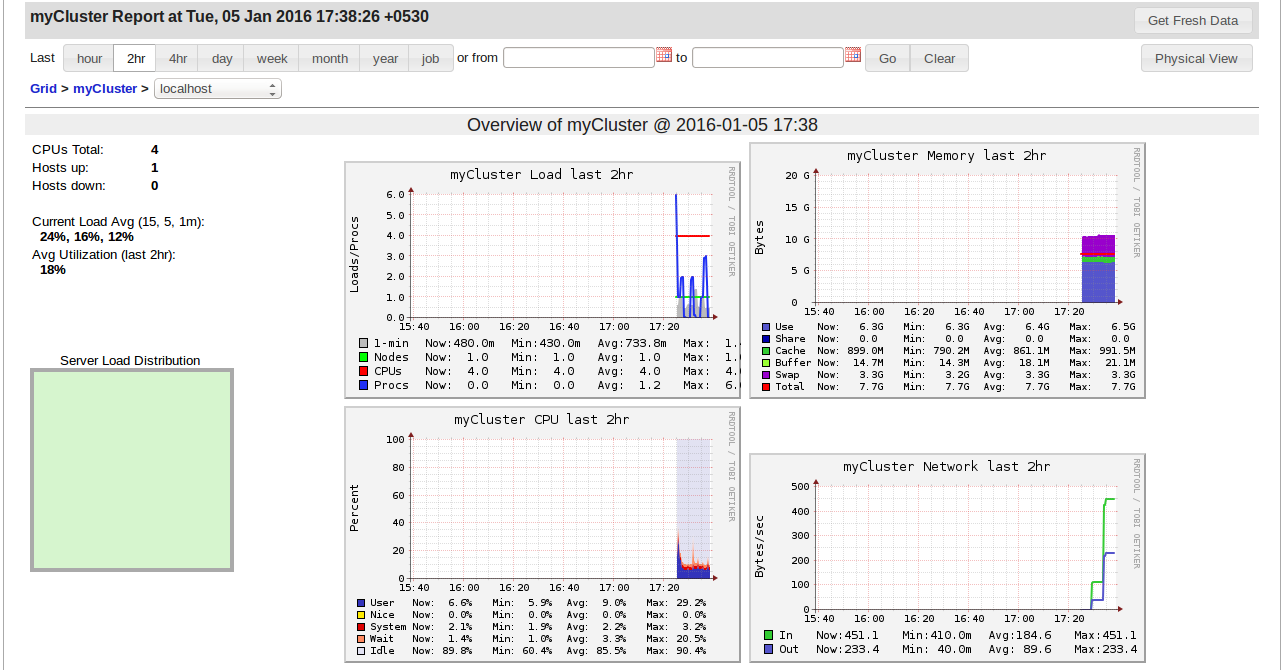
The above steps are basic monitoring with ganglia you can do many things with it like unicast,multicast, time interval , matrics etc by configurations.
Recommend
-
38
背景:最近根据公司要求,需要一个能够监控主机CPU、内存、网络等资源情况的工具,由此想到了Ganglia。然后看了下部署方式,实在看得头大,安装过程非常繁琐,并且依赖问题也是比较烦人,于是有了这文章。废话不多说,直接开干!第一步:搜索可用镜像dockersearchg...
-
4
Cluster vs Client: Execution modes for a Spark application Reading Time: 3 minutes Whenever we submit a
-
6
修改ganglia指标保存目录 修改ganglia指标保存目录 假设要把指标数据保存到目录 /data/rrds 下面 新建新的指标保存目录并修改目录所有者 mkdir -v /data/rrds chown -R nobody:nobody /data/rrds
-
9
Deploy a Spark Application on Cluster Reading Time: 2 minutesIn one of our previous blog, Setup a Apa...
-
7
Spark-shell on yarn resource manager: Basic steps to create hadoop cluster and run spark on it Reading Time: 3 minutesIn t...
-
4
Logging Spark Application on standalone cluster Reading Time: < 1 minuteLogging of the application is much important to...
-
6
centos部署Ganglia 2014-11-28操作系统 Ganglia+RRDTool这对组合可以说是不错的机群监控软...
-
2
Nagios4+Nginx+Ganglia配置 2013/11/29 20:14 | Comments 本文...
-
5
Tuning Spark Applications to Efficiently Utilize Dataproc Cluster
-
3
Spark: Cluster Computing with Working Sets 本文是对spark作者早期论文《
About Joyk
Aggregate valuable and interesting links.
Joyk means Joy of geeK