

Speculating The Entire X86-64 Instruction Set In Seconds With This One Weird Tri...
source link: https://movaxbx.ru/2021/03/28/speculating-the-entire-x86-64-instruction-set-in-seconds-with-this-one-weird-trick/
Go to the source link to view the article. You can view the picture content, updated content and better typesetting reading experience. If the link is broken, please click the button below to view the snapshot at that time.
Speculating The Entire X86-64 Instruction Set In Seconds With This One Weird Trick
As cheesy as the title sounds, I promise it cannot beat the cheesiness of the technique I’ll be telling you about in this post. The morning I saw Mark Ermolov’s tweet about the undocumented instruction reading from/writing to the CRBUS, I had a bit of free time in my hands and I knew I had to find out the opcode so I started theory-crafting right away. After a few hours of staring at numbers, I ended up coming up with a method of discovering practically every instruction in the processor using a side(?)-channel. It’s an interesting method involving even more interesting components of the processor so I figured I might as well write about it, so here it goes.
You can find the full data-set and the implementation source at haruspex.can.ac / Github.
Preface 1/2: If storks are busy delivering babies, where do micro-instructions come from?
Modern processors are built with a crazy amount of microarchitectural complexity these days and as one would expect the good old instruction decoders no longer decode for the execution unit directly. They end up decoding them into micro-instructions according to the micro-code of the processor to dispatch to the execution ports of the processor. There are two units that perform this translation in a modern Intel processor:
- Micro-instruction Translation Engine (MITE). The unit responsible for the translation of simple legacy instructions that translate to four or less micro-instructions.
- Microcode Sequencer (MS). The unit responsible for the translation of much more complex instructions that drive the CISC craziness of the Intel architecture we all hold dearly.
Another unit that dispatches these micro-instructions is the Decoded Stream Buffer (DSB) more frequently known as the iCache but it is not really relevant to the experiment we’re going to do. Now, why am I telling you all of this? Mainly because we can profile these extremely low-level units thanks to the performance counters Intel gracefully provides us; mainly these two bad boys:
One of the advantages of utilizing these events compared to a Sandsifter-like approach is that even if the microcode of the instruction throws a #UD (say if the password does not match or if the conditions are not met) it cannot fool us as it’d still have to be decoded.
Preface 2/2: Executing in a parallel universe
Now the problem is getting those instructions there. There are a million of ways you can shoot yourself in the foot by executing random instructions. What happens if we hit an instruction that changes our interruptibility state, causes a system reset, messes with the internal caches or the very performance counters we’re using, the stack we’re executing on, the code of the profiler, the code segment we’re executing in…
The easy solution is to simply, not execute, at least in our visible universe, which brings us to our second cool microarchitectural detail: speculative and out-of-order execution. The processor evaluating the branch condition at the branch has apparently grown out of fashion so what really happens when you do a branch is that, first, the branch prediction engine attempts to guess the branch you are going to take to reduce the cost of the reversal of the instruction pipelines, given an equal possibility both branches execute at the same time where possible and no speculation fences are present and then one of them gets their net change reverted… which is pretty much what we wanted isn’t it? Now although probing the branch to reset the branch prediction state is possible and I’ve experimented with it before, it’s a bit bothersome so an easier way is to simply do a CALL. Consider this snippet:
This will cause the execution of the speculated code and the invoked subroutine out-of-order if possible. The XCHG may seem a bit overkill compared to a simpler solution popping the stack but as far as my experiments went, the processor is too smart to split the execution if the routine is non-returning so we need to feed the branch target buffer what it wants. I’ve used XCHG here instead of a MOV since it implies LOCK which will cause the processor to end up in a memory stall given that it has to end up visible given the atomicity –or at least so I theorize.
We will also need to trash the Decoded Stream Buffer I’ve mentioned previously so that we do not get any micro-instructions fed from the cache but there’s a very simple solution for that. The instruction cache also has to handle self-rewriting code so execute memory is extremely sensitive to any memory writes, given this information adding the simple snippet below before every measurement takes care of this issue.
0x0: Precise data collection
Finally, we’ve hit the exciting part of the experiment, experimenting. We want precise results which implies non-interruptibility. You might be tricked into thinking being in kernel-mode and doing a CLI solves this problem but this does not really work that way in reality. The first thing that worries me is an #SMI being delivered, although I keep hearing it freezes PMCs, as far as I’ve experimented it really doesn’t do a great job at that, but even if it did it’s still an impurity we have to eliminate so I’ll repeat the experiment until the mighty IA32_MSR_SMI_COUNT stays constant during the execution. #NMI is the other bugger, so setting the interrupt handler so that it signals a retry solves this problem (since I’m too lazy to unwind). #MC would also be considered in this category but at that point might as well let it all burn.
Repeating the experiment multiple times and picking the Mod(x), and writing the code in a tight manner eliminates pretty much every other problem we’ve left. The next step is simply writing the code and actually collecting the data. The speculated code will be 15 copies of NOP and a 0xCE at the end to cause an actual #UD and halt the speculative execution. We’ll be trying pretty much every opcode in the range of 0x00-0xFF and they will optionally take a prefix of 0x0F and optionally another prefix in the set { 0x66, 0xF2, 0xF3 } since Intel likes to use them to create new opcodes out of thin-air (e.g. the recent FRED instruction ERETS with its F2 0F 01 CA encoding). We also need to add a suffix for discovering ModR/M variants. This process completes in mere seconds, which gave the title to this post.
0x1: Reducing the results
First of all, we’ll get two baseline measurements, the NOPs left as is, and the 0xCE as the first opcode which will reveal the counter values for a complete execution and the for-real-#UD case (I’ve tested other opcodes, 0xCE really isn’t an NSA backdoor, it’s the real deal as far as #UD’s go.).
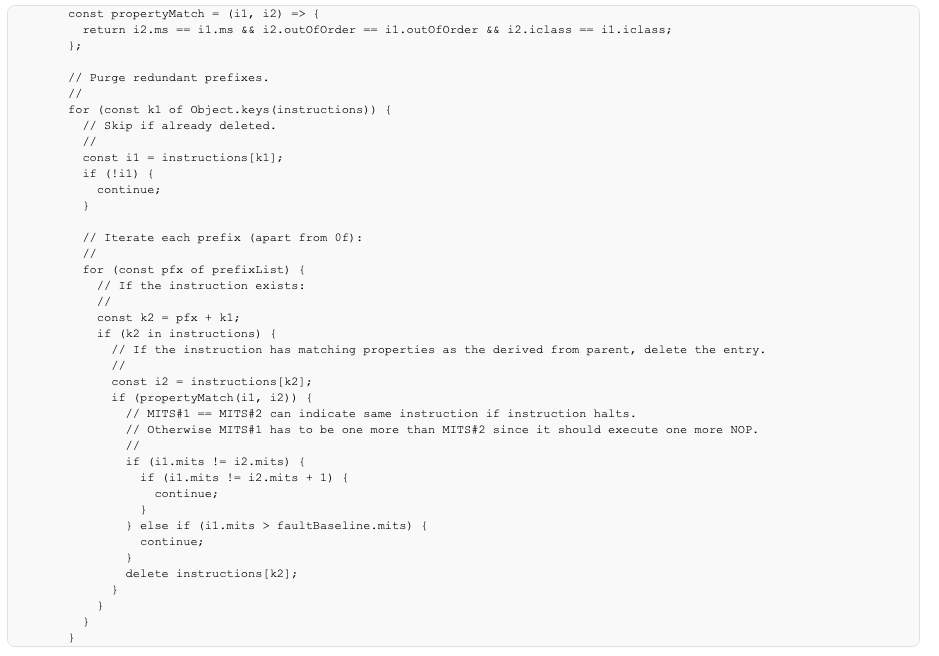
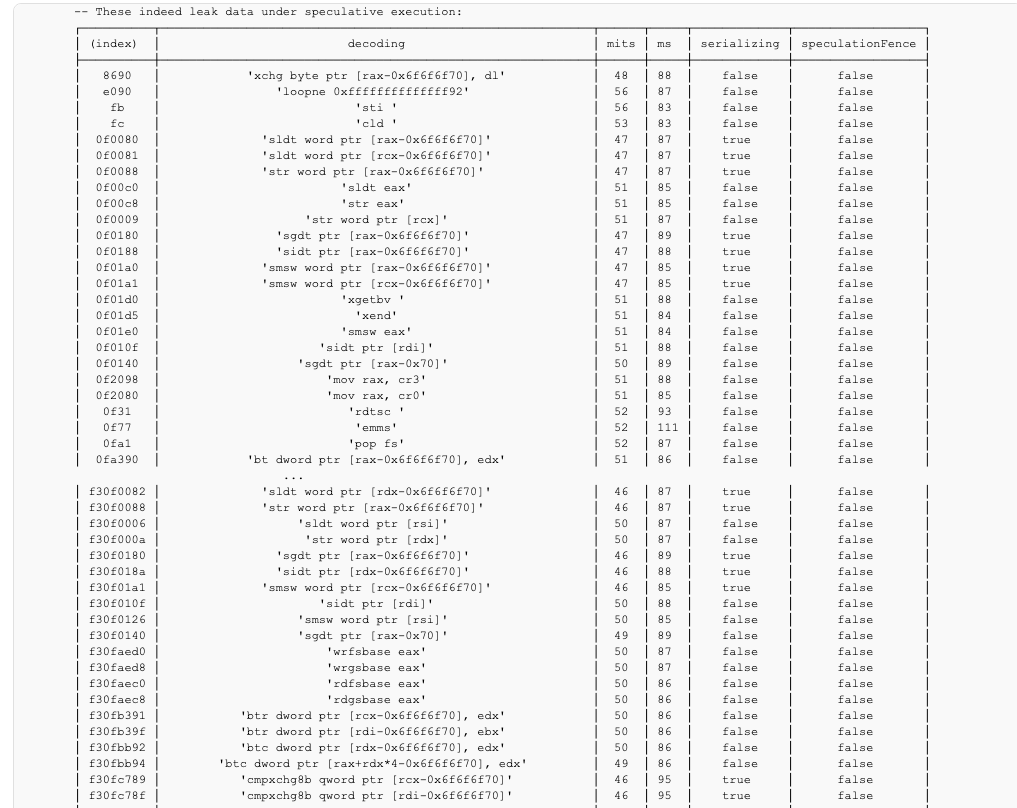
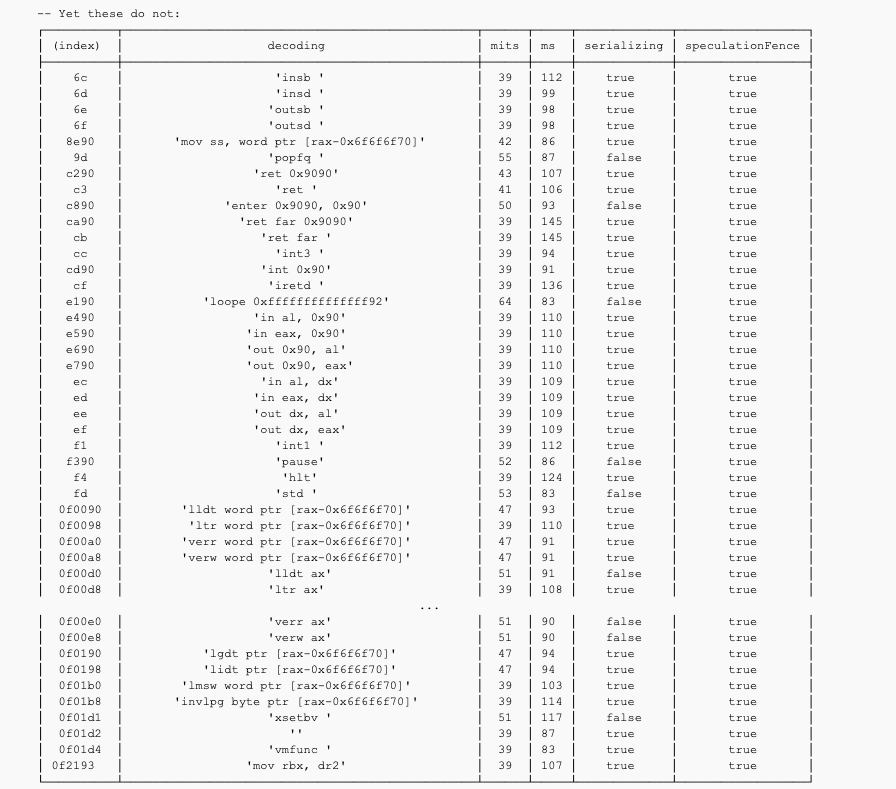
Simply removing all measurements matching the for-real-#UD case measurement gets rid of most of the garbage, now we need to get rid of the redundant prefixes, taking a look at the data below you can see a pattern emerge:
Every nop translates to a single micro-instruction that will be handled by the MITE, which means if the prefix is redundant MITS should be always off by just one and MS should stay the same, additionally, we can filter out some redundant checks by declaring 0x0F never redundant. Combining both we get rid of most of the redundancies in a simple fashion and even might be able to calculate the instruction length, neat! The code below gets rid of 54954 entries.
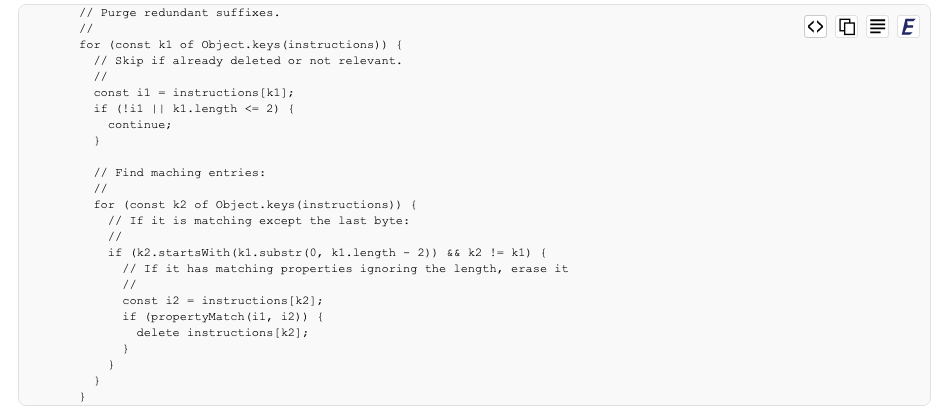
Suffix-based purging is also more or less the same logic which gets rid of 72869 instructions, leaving us with 1699 entries, which is good enough to start the analysis!
0x2: Deduction of behavior
Let’s demonstrate the amazing amount of information we’ve gathered just from these two counters and some bytes existing at some fixed place without even being executed. If MS is below the nop baseline, this would indicate that the control flow is interrupted meaning that it must be a branch or an exception and if the MITS is the same as the fault-baseline, this likely indicates a serializing instruction which dispatched a number of micro-instructions (given that it passed our initial filter of MS or MITS not remaining same) but then halted the speculative flow (since none of the NOP opcodes were decoded).
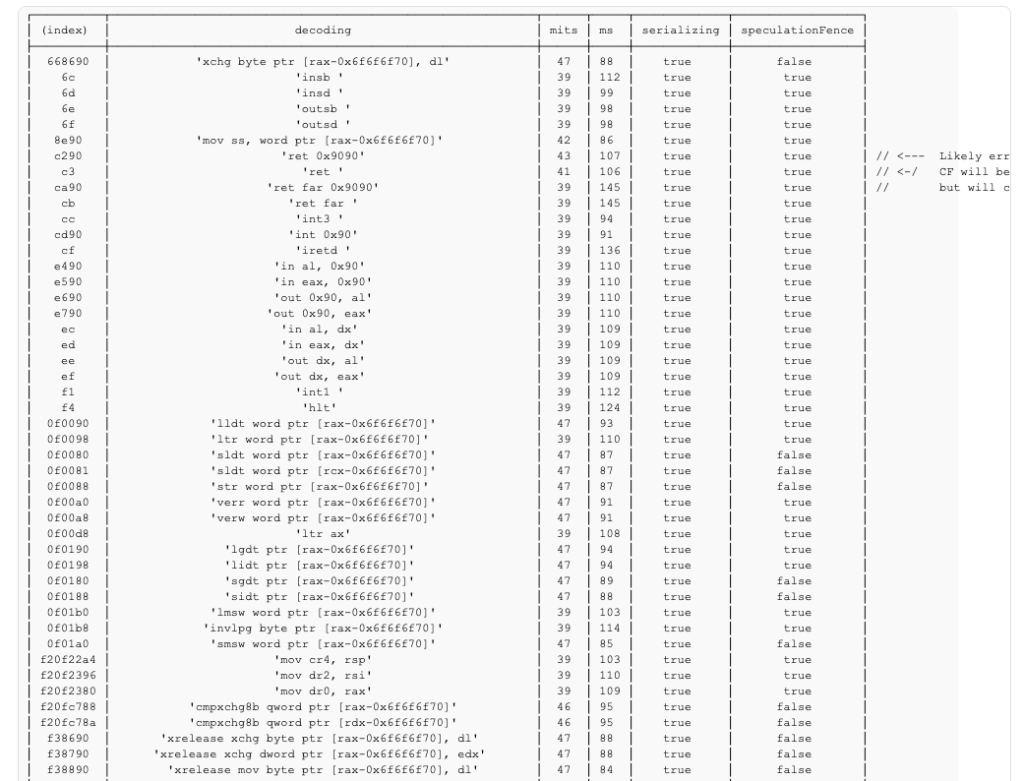
Considering how simplistic the conditions are, not bad right?
0x3: Deduction of speculative behavior
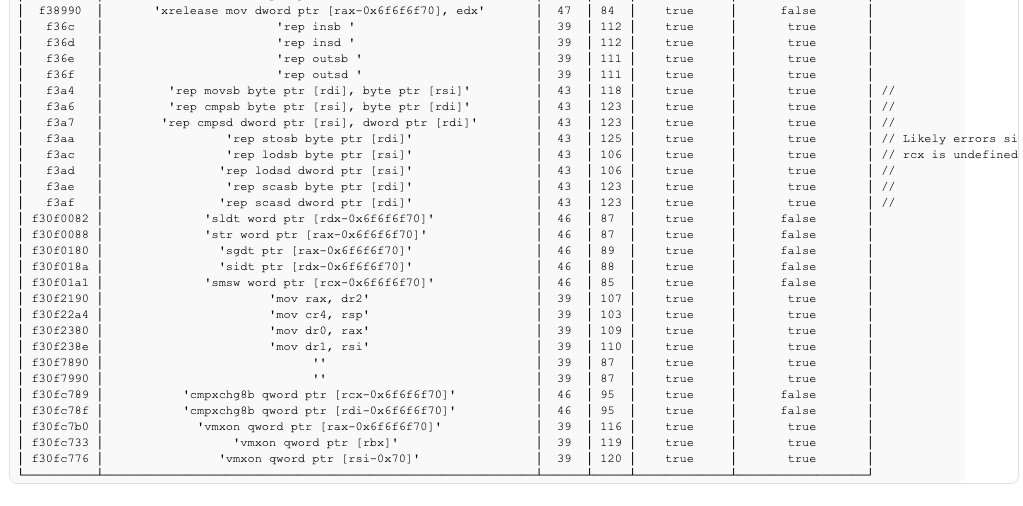
You might have noticed the “Speculation fence” indication in the previous data dump. I’ve gotten a bit greedy and wanted to also know if the instructions speculatively execute or if they halt the queue for the sake of side-channeling the results so I went ahead and collected another piece of information, which comes from a rather unexpected performance counter:
You might be wondering what this has to do with anything. This particular counter is very useful given the fact that we don’t do any divisions in our previous code. Why? Because this means adding a division right after the instruction and seeing if the cycles is non-zero will let us know if the speculative execution was halted or not. We achieve this by first squeezing a divps xmm4, xmm5 there right before the #UD‘ing 0xCE and finally we waste some cycles at the non-speculative counterpart to cause a stall giving the speculative code more execution time from the execution port. Changing the previous routine code to the following pretty much gives us the perfect setup:

AVX to SSE switch, memory stall, register dependencies, atomicity, this one has it all! Marking the entries that have non-zero counters as “speculative friendly” essentially lets us know what instructions we can speculatively execute and leak information from, and as you can see in the next example it seems to work pretty nicely.
0x : Some of the interesting results
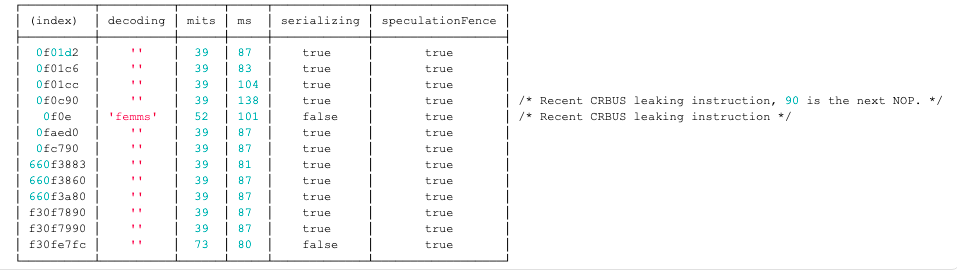
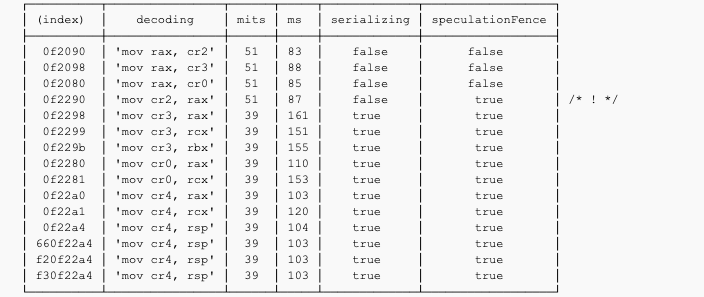
Here is the full list of undocumented easter-egg instructions my i7 6850k comes with:
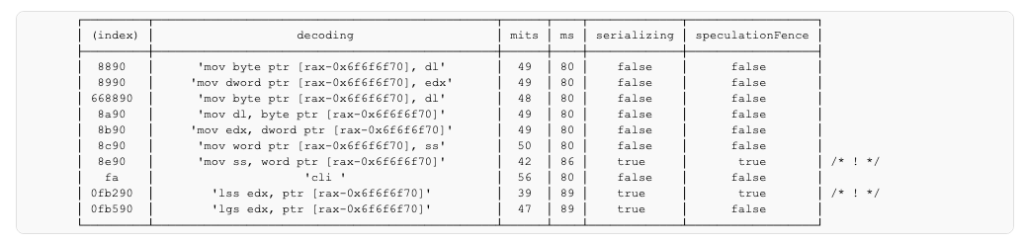
Contrary to popular belief mov cr2, reg is not serializing.
Despite lacking the CPL check of int imm8, int1 has more logic in the microcode.
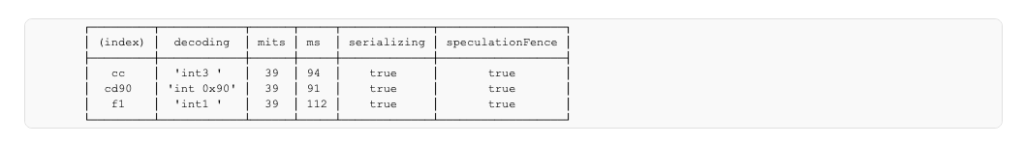
mov ss is a speculation fence whereas cli isn’t. lss is a speculation fence whereas lgs isn’t.
Понравилось это:
РубрикиcpuМеткиCPU, Intel, undocument
Recommend
-
84
SIMD Everywhere The SIMDe header-only library provides fast, portable implementations of SIMD intrinsics on hardware which doesn't natively support them, such as calling
-
70
README.md ___ ___ ___ ___ ___ ___ ___ ___ ___ /\ \ /\ \ ___ /\__\ /\ \ /\__\ /\__\ /\...
-
16
My wife is big fan of Animal Crossing. I will admit that I mostly don’t understand the game but I find it very cute. She was very upset a couple of days ago when the Bank of Nook decided to cut the interest rate down to 0....
-
2
You Won’t Believe This One Weird CPU Instruction! Posted on 8 September 2019 Tags: programming This...
-
4
Sellful is a turn-key business softwate for creating an entire business infrastructure in seconds
-
3
HTML 5 Developers Speculating About the Long-Distant Future: 2022 Chris Coyier on...
-
1
Bitcoin: Stop Speculating and Start Innovating - The Shift of Currency to AssetsAugust 16th 2022 new story
-
4
Uniglo (GLO) Holders Speculating On High Prices After Launch, Similar To Holo (HOT), Celo (CELO) And Nem (XEM) September 7, 2022
-
0
Here’s 44 seconds of the Moto Razr Ultra because an entire ad has leaked / Evan Blass has done it again with another giant leak.By
-
7
Let's focus on AI's tangible risks rather than speculating about its potential to pose an existential threat by Nuria Oliver, Bernhard Schölkopf, Florence d'Alch...
About Joyk
Aggregate valuable and interesting links.
Joyk means Joy of geeK