

SpringBoot(五) 健康检查(上)
source link: https://zhouj000.github.io/2020/01/28/springboot-5/
Go to the source link to view the article. You can view the picture content, updated content and better typesetting reading experience. If the link is broken, please click the button below to view the snapshot at that time.
SpringBoot(一) 启动与自动配置
SpringBoot(二) starter与servlet容器
SpringBoot(三) Environment
SpringBoot(四) 集成apollo遇到的事儿
SpringBoot(五) 健康检查(上)
SpringBoot(六) 健康检查(下)
springBoot提供的健康检查只需要引入依赖即可:
<dependency>
	<groupId>org.springframework.boot</groupId>
	<artifactId>spring-boot-starter-actuator</artifactId>
</dependency>
spring-boot-starter-actuator其实只是个空项目,统一管理的引入了:
// 自动配置
+ spring-boot-actuator-autoconfigure
	// actuator
	+ spring-boot-actuator
// 提供了记录度量指标类
// SpringBoot 2.X使用mircrometer进行统计数据和发布数据到监控系统,1.X是使用了dropwizard-metrics
+ micrometer-core
启动项目,可以看到打印了Exposing 2 endpoint(s) beneath base path '/actuator',我们访问这个路径看到打印了:
{
	"_links": {
		"self": {
			"href": "http://127.0.0.1:8080/actuator",
			"templated": false
		},
		"health-component": {
			"href": "http://127.0.0.1:8080/actuator/health/{component}",
			"templated": true
		},
		"health-component-instance": {
			"href": "http://127.0.0.1:8080/actuator/health/{component}/{instance}",
			"templated": true
		},
		"health": {
			"href": "http://127.0.0.1:8080/actuator/health",
			"templated": false
		},
		"info": {
			"href": "http://127.0.0.1:8080/actuator/info",
			"templated": false
		}
	}
}
其实在SpringBoot2.X以前,有许多监控端点是打开的,比如env、beans等。但是2.X以后有以下规则:
1、要通过actuator暴露端点,必须同时是启用(enabled)的和暴露(exposed)的
2、所有除了/health和/info的端点,默认都是不暴露的
3、所有除了/shutdown的端点,默认都是启用的(enabled)
4、生产环境由于安全性的问题,注意不要暴露敏感端点(如果使用Spring Security,则可以使用Spring Security的内容协商策略保护端点)
所以通过application.properties或application.ymal配置可以打开这些监控端点:
#management.endpoints.enabled-by-default=true
// 启用指定监控端点,只有shutdown是默认未启用的
management.endpoint.shutdown.enabled=true

// 只暴露/排除指定监控端点,可以使用*表示全部
// 全部暴露,除了env端点
management.endpoints.web.exposure.include=*
management.endpoints.web.exposure.exclude=env

// 一个链接所有端点的”discovery页面”被添加,默认情况下,”discovery页面”在/actuator上可用
// 修改访问根路径,使用配置自定义的管理上下文路径,”discovery页面”自动从/actuator移动到管理上下文的根
management.endpoints.web.base-path=/monitor
// 修改端口映射,改变端点路径,比如重新映射/monitor/health到/monitor/healthcheck
management.endpoints.web.path-mapping.health=healthcheck

// <name>端点缓存的生存时间设置为10秒
management.endpoint.<name>.cache.time-to-live=10s

// CORS跨源资源共享设置,指定授权的跨域请求
management.endpoints.web.cors.allowed-origins=http://example.com
management.endpoints.web.cors.allowed-methods=GET,POST
// 使用不同的HTTP端口来公开端点
management.server.port=8081
management.server.XXX=xxx


//激活所有的JMX方式请求
management.endpoints.jmx.exposure.include=*
#management.endpoints.jmx.exposure.exclude=
// 不暴露JMX端点
#endpoints.jmx.enabled=false
这样启动后就会看到Exposing 12 endpoint(s) beneath base path '/monitor'
@ConfigurationProperties列表
env
显示 ConfigurableEnvironment 中的属性
info
提供当前SpringBoot应用的任意信息,可以通过Environment或application.properties等形式提供以info.为前缀的任何配置项,然后info这个endpoint就会将这些配置项的值作为信息的一部分展示出来
health
显示应用的健康信息(未认证只显示status,认证显示全部信息详情)
metrics
当前SprinBoot应用的metrics信息
httptrace
显示HTTP跟踪信息(默认显示最后100个HTTP请求 - 响应交换)
mappings
如果是基于SpringMVC的Web应用,显示所有@RequestMapping路径集列表
scheduledtasks
显示应用程序中的计划任务
sessions
允许从Spring会话支持的会话存储中检索和删除用户会话
Actuator
shutdown
用于关闭当前SpringBoot应用的endpoint
dump
用于执行线程的dump操作,heapdump和threaddump
如果要做一个应用是否启动的检查,其实很简单,我们可以直接使用Spring MVC的rest访问即可;
@RestController
public class HealthController {

    @GetMapping("myhealth")
    public Health myHealth() {
        return new Health("UP");
    }

}

public class Health {
    private String status;
	// ...
}
可以得到{"status":"UP"}的结果,那么改动方法内的实现,也可以完成类似简易的健康检查
上面那种方式其实只是依赖了Spring MVC,言归正传,使用actuator一般可以使用其health或metrics的扩展,或自定义endpoint
health健康信息
health端点公开的信息取决于management.endpoint.health.show-details属性,可以使用以下值之一配置:
1、never:默认,不显示细节
2、when-authorized:详细信息只显示给授权用户,可以使用management.endpoint.health.roles配置授权角色(当用户处于端点的一个或多个角色中时,就被认为是经过授权的,如果端点没有配置角色(默认),则认为所有经过身份验证的用户都是经过授权的)
3、always:详细信息显示给所有用户
健康信息是从ApplicationContext中定义的所有HealthIndicator bean中收集的,Spring Boot包括许多自动配置的HealthIndicators,并且你也可以自己写。默认情况下,最终的系统状态由HealthAggregator派生,它根据有序的状态列表从每个HealthIndicator排序状态。排序列表中的第一个状态被用作总体健康状态,如果没有HealthAggregator所知道的HealthIndicator状态返回,则使用UNKNOWN状态
比如Spring Boot提供了一些自动配置的HealthIndicators:
1、CassandraHealthIndicator:检查Cassandra数据库是否已启动
2、DiskSpaceHealthIndicator:检查低磁盘空间
3、DataSourceHealthIndicator:检查能否获得到DataSource的连接
4、RedisHealthIndicator:检查Redis服务是否已启动
等等
自定义HealthIndicators
要提供自定义的健康信息,可以注册实现HealthIndicator接口的Spring bean,并提供health()方法的实现并返回Health响应
给定HealthIndicator的标识符是没有HealthIndicator后缀的bean的名称,例如MyHealthIndicator的健康信息可以在my条目中获得
对于多个HealthIndicator的status,spring boot默认对其进行aggregrate自动聚合,然后计算最顶层的status字段。对于status是DOWN或者是OUT_OF_SERVICE的,返回的http的状态码是503,这样应用监控系统一来就无需去解析返回结果,直接根据http的状态码就可以判断了,非常方便
除了Spring Boot的预定义Status类型之外,Health还可以返回表示新系统状态的自定义Status,在这种情况下,还需要提供HealthAggregator接口的自定义实现,或者,默认实现是使用management.health.status.order配置属性:
// 一个带有代码FATAL的新Status
management.health.status.order=FATAL, DOWN, OUT_OF_SERVICE, UNKNOWN, UP
// 通过HTTP访问健康端点,可能还想注册自定义状态映射
management.health.status.http-mapping.FATAL=503
已有的默认状态:
1、DOWN:SERVICE_UNAVAILABLE (503)
1、OUT_OF_SERVICE:SERVICE_UNAVAILABLE (503)
1、UP:默认情况下没有映射,所以http状态是200
1、UNKNOWN:默认情况下没有映射,所以http状态是200
第一种方式,直接实现HealthIndicator接口
@Component("my_health_indicator")
public class MyHealthIndicator implements HealthIndicator {

    @Override
    public Health health() {
		// 简单打印
        return Health.up().withDetail("code", "0000").withDetail("msg","SUCCESS").up().build();
    }
}
可以通过http://127.0.0.1:8080/actuator/health或直接http://127.0.0.1:8080/actuator/health/my_health_indicator查看
另一种方式,继承AbstractHealthIndicator抽象类,这是通常的做法,只需要实现doHealthCheck方法,比如我们实现一个通用的dubbo依赖的健康检查,利用EchoService判断
public class DubboHealthIndicator extends AbstractHealthIndicator {

    private final ReferenceBean bean;

    public DubboHealthIndicator(ReferenceBean bean) {
        this.bean = bean;
    }

    @Override
    protected void doHealthCheck(Health.Builder builder) throws Exception {
        builder.withDetail("interface", bean.getObjectType());
        final EchoService service = (EchoService) bean.getObject();
        service.$echo("ok");
        builder.up();
    }
}
实现了HealthIndicator后,就需要注册在IOC中了,我们可以为所有dubbo服务的ReferenceBean都注册了,这样就不必为每个服务单独注册了,还可以做成starter自动配置(写入META-INF/spring.factories),这样就自动对当前应用引用的所有dubbo服务进行健康检查了
@Configuration
@ConditionalOnClass(name = { "com.alibaba.dubbo.rpc.Exporter" })
public class DubboHealthIndicatorConfiguration {

    @Autowired
    StatusAggregator healthAggregator;

    @Autowired(required = false)
    Map<String, ReferenceBean> references;

    @Bean
    public CompositeHealthContributor dubboHealthIndicator() {
        Map<String, HealthIndicator> indicators = new HashMap<>();
        for (String key : references.keySet()) {
            final ReferenceBean bean = references.get(key);
            indicators.put(key.startsWith("&") ? key.replaceFirst("&", "")
                    : key, new DubboHealthIndicator(bean));
        }
        return CompositeHealthContributor.fromMap(indicators);
    }

}
其中对于references,Spring框架支持依赖注入Key的类型为String的Map,遇到这种类型的Map声明,Spring将扫描容器中所有类型为T(这里为ReferenceBean)的bean,然后以该bean的name作为Map的Key,以bean实例作为对应的Value,从而构建一个Map并注入到依赖处
如前面说的,通过health下的/dubbo即可以访问,反应项目中所有dubbo服务的整体健康状况
ReactiveHealthIndicator
对于reactive应用,比如Spring WebFlux,ReactiveHealthContributor提供了非阻塞协议来获取应用程序的运行状况。与HealthContributor类似,健康信息是从ReactiveHealthContributorRegistry的内容中收集的(默认情况下,所有ApplicationContext中定义的HealthContributor实例和ReactiveHealthContributor实例),且ReactiveHealthContributorRegistry可用于在运行时注册和注销健康指标
- Reactive以后研究
metrics数据指标
metrics就是一个度量指标的执行器,可以进行类似仪表盘的展示
自定义metrics
@Bean
MeterRegistryCustomizer<MeterRegistry> metricsCommonTags() {
	return registry -> registry.config().commonTags("region", "cn/east8");
}
第一种方式,注册到MeterRegistry
@Component
public class SampleBean {

    private final Counter counter;

    public SampleBean(MeterRegistry registry) {
        this.counter = registry.counter("received.messages");
		// registry.gauge("other", counter, c -> {counter.increment();return c.count();} );
    }

    public void handleMessage(String message) {
        this.counter.increment();
        // handle message implementation
    }
}
通过http://localhost:8080/actuator/metrics/received.messages访问,但该类的handleMessage被调用后,counter自增
第二种方式,实现MeterBinder
@Component
public class MyMetrics implements MeterBinder {

    AtomicInteger count = new AtomicInteger(0);

    @Override
    public void bindTo(MeterRegistry registry) {
		// count指标
        Gauge.builder("count", count, c -> c.incrementAndGet())
                .tags("pv", "Page View")
                .description("test of custom meter binder")
                .register(registry);
    }
}
通过http://localhost:8080/actuator/metrics/count访问,这个指标会随着每次访问递增
endpoint执行器端点
执行器端点(endpoints)可用于监控应用及与应用进行交互, 端点暴露的方式取决于你采用的技术类型,大部分应用选择HTTP监控(Web),端点的ID映射到一个URL,也可以使用JMX
端点上的操作通过它们的参数接收输入,当通过web公开时,这些参数的值取自URL的查询参数和JSON请求体,当通过JMX公开时,参数被映射到MBean操作的参数。默认情况下不需要参数,可以使用@org.springframework.lang.Nullable对它们进行注解,从而使它们成为可选的
如果需要,传递给端点操作方法的参数将自动转换为所需的类型,在调用操作方法之前,使用ApplicationConversionService实例将通过JMX或HTTP请求接收的输入转换为所需的类型
Web端点
在web公开的端点上,每个操作都会自动生成一个请求谓词,谓词的路径由端点的ID和web公开端点的基本路径决定,比如/actuator + /info。再通过使用@Selector注解操作方法的一个或多个参数,可以进一步定制路径,这样的参数作为路径变量添加到路径谓词,当调用端点操作时,将变量的值传递给操作方法
谓词的HTTP方法由操作类型决定,如下所示:
@ReadOperation     => GET
@WriteOperation    => POST
@DeleteOperation   => DELETE
谓词的生产子句可以由@DeleteOperation、@ReadOperation和@WriteOperation注解的produces属性确定,属性是可选的,如果不使用,则自动确定”生成”子句。如果操作方法produces返回void,则生成子句为空,如果操作方法返回一个org.springframework.core.io.Resource,生成子句是application/octet-stream。对于所有其他操作,生成子句是application/vnd.spring-boot.actuator.v2+json, application/json
对于使用请求体的@WriteOperation(HTTP POST),谓词的消费子句是application/vnd.spring-boot.actuator.v2+json, application/json,对于所有其他操作,消费子句为空
自定义endpoint
@Component
@Endpoint(id = "hello")
public class MyEndpoint {

    @ReadOperation
    public String hello(@Selector String name) {
		// 简单实现
        return "hello " + name;
    }

}
这样我们可以直接通过http://127.0.0.1:8080/actuator/hello/{name}来访问这个web公开端点
JMX端点
对于JMX公开端点,SpringBoot会用JmxEndpointExporter将所有Endpoint实例以JMX MBean的形式暴露,默认情况下这些Endpoint对应的JMX MBean会放在org.springframework.boot命名空间下面,不过可以通过endpoints.jmx.domain配置项进行更改,比如 endpoints.jmx.domain=com.test.management
JMX和HTTP是endpoints对外开放访问最常用的方式,鉴于Java的序列化漏洞以及JMX的远程访问防火墙问题,因此建议用HTTP并配合安全防护将SpringBoot应用的endpoints开放给外部监控者使用
MBean的名称通常是从端点的id生成的。 例如,health端点暴露为 org.springframework.boot/Endpoint/healthEndpoint。
如果应用程序包含多个Spring ApplicationContext,可能会发现名称发生冲突。 要解决此问题,可以将endpoints.jmx.unique-names属性设置为true,以便MBean名称始终是唯一的
在尝试访问的时候遇到一个坑,因为我用的Spring Boot 2.2.2版本,在jconsole中并没有找到endpoint,在JmxEndpointDiscoverer中debug也没有进来,然后看到JmxEndpointAutoConfiguration上的注解ConditionalOnProperty发现原来需要打开JMX,默认是false的
// 打开JMX
spring.jmx.enabled=true
然后在jconsole中就能看到endpoint节点,并能查看端点信息和操作了
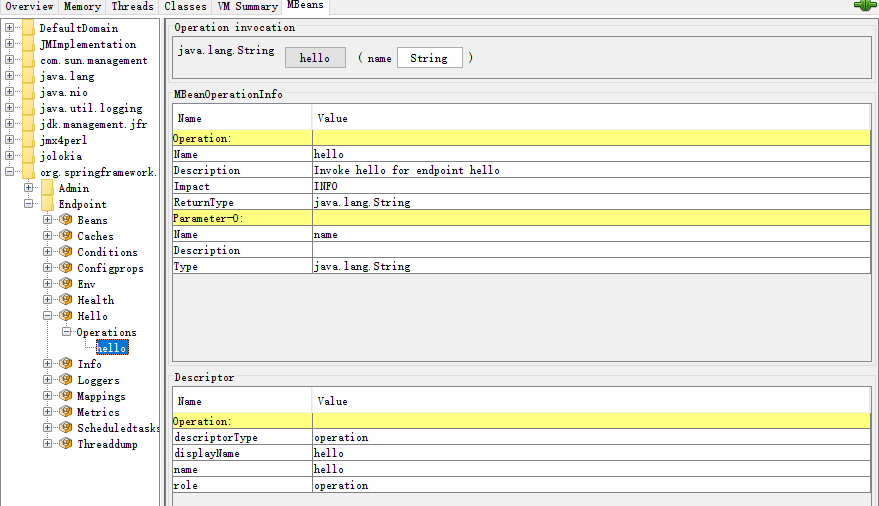 在此之外,配上
jolokia,完全兼容并支撑JMX组件,它可以当做JMX-HTTP的桥梁可以让我们通过HTTP访问JMX
<dependency>
	<groupId>org.jolokia</groupId>
	<artifactId>jolokia-core</artifactId>
	<version>1.6.2</version>
</dependency>
于是就能通过http://127.0.0.1:8080/actuator/jolokia/read/org.springframework.boot:name=Hello,type=Endpoint访问了,也可以通过http://127.0.0.1:8080/actuator/jolokia/list查看列表
Servlet端点
Servlet可以通过实现一个带有@ServletEndpoint注解的类来作为端点公开,这个类也实现了Supplier<EndpointServlet>。Servlet端点提供了与Servlet容器更深层次的集成,但暴露了可移植性,它们用于将现有的Servlet公开为端点。对于新的端点,应该尽可能使用@Endpoint和@WebEndpoint注解
Controller端点
可以使用@ControllerEndpoint和@RestControllerEndpoint实现仅由Spring MVC或Spring WebFlux公开的端点,方法使用Spring MVC和Spring WebFlux(如@RequestMapping和@GetMapping)的标准注解进行映射,使用端点的ID作为路径的前缀。Controller端点提供了与Spring web框架的更深入的集成,但却牺牲了可移植性,尽可能使用@Endpoint和@WebEndpoint注解
info信息
应用信息会暴露所有InfoContributor beans收集的各种信息,Spring Boot包含很多自动配置的InfoContributors。例如EnvironmentInfoContributor、GitInfoContributor、BuildInfoContributor
我们可以在application.properties中配置Spring属性info.*,比如info.msg=good morning,也可以不硬编码[email protected]@
同样也可以自定义
@Component
public class MyInfoContributor implements InfoContributor {

    @Override
    public void contribute(Info.Builder builder) {
        builder.withDetail("myInfo",
                Collections.singletonMap("myKey", "myValue"));
    }
}
通过http://localhost:8080/actuator/info访问结果
autoconfigure包
首先打开spring-boot-actuator-autoconfigure包,查看它的spring.factories,可以看到配置了许多配置类,都是其org.springframework.boot.actuate.autoconfigure路径下的文件
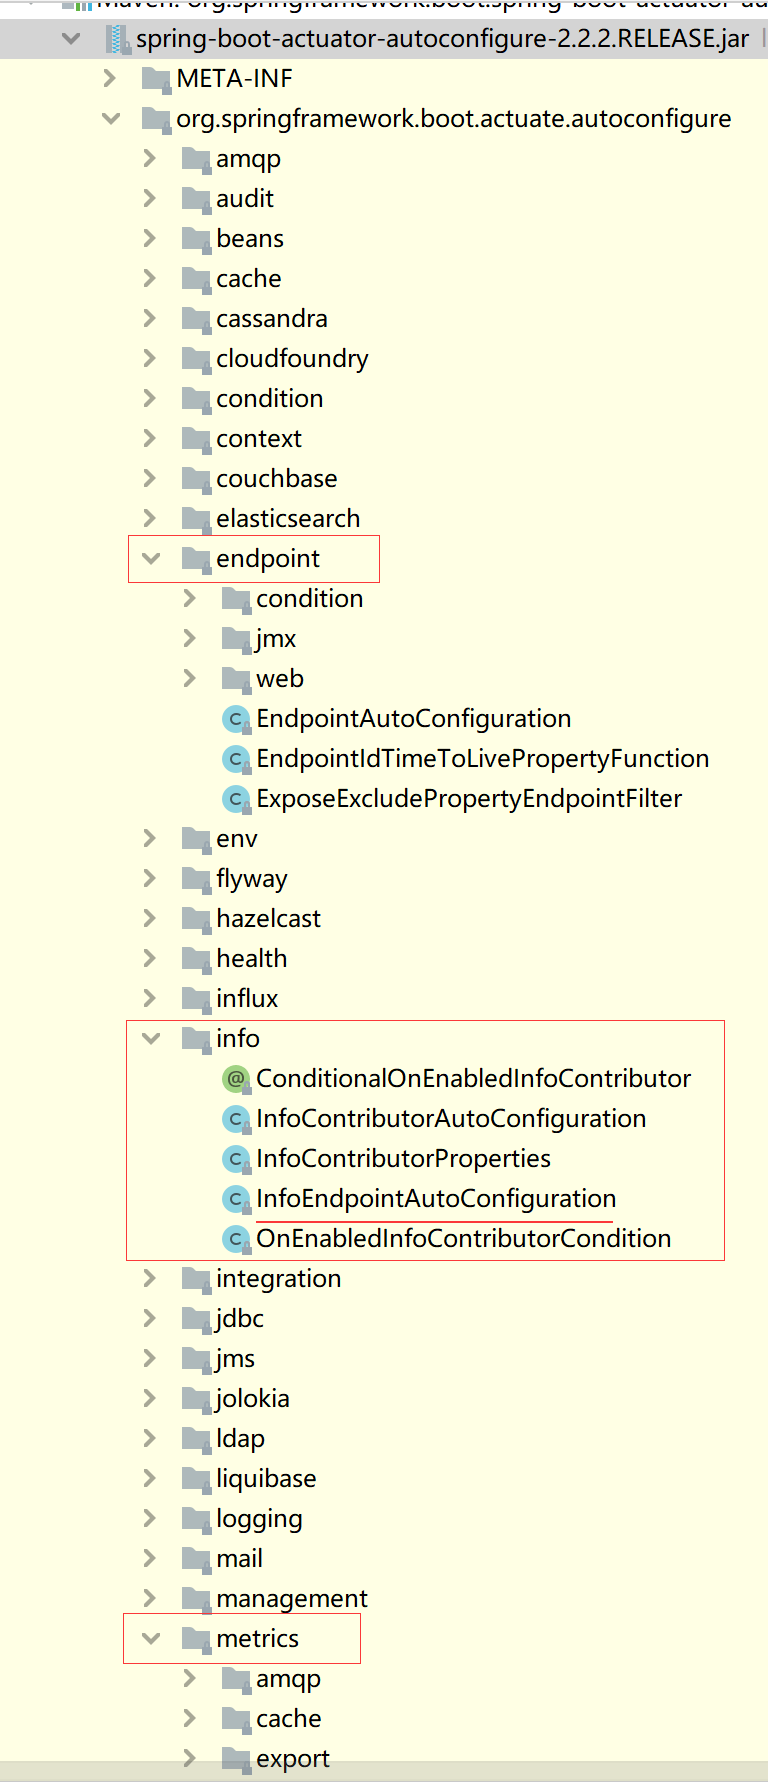
总体而言,autoconfigure下可以分为3类:
1、自动配置XX端点(例如info)
2、endpoint包
3、metrics包
1.自动配置
自动配置的一种方式是,定义了各种XXXEndpointAutoConfiguration,比如rabbitmq、cache、bean等。其中会根据某些类(依赖)是否存在来自动创建XXXEndpoint,这些类使用@Endpoint注解类,@ReadOperation、@WriteOperation或@DeleteOperation注解方法(自动地通过JMX公开,在web应用程序中会通过HTTP公开)。也可以使用@JmxEndpoint或@WebEndpoint来编写特定于技术的端点,这些端点仅限于各自的技术,分别通过JMX公开和HTTP公开。此外,可以使用@EndpointWebExtension和@EndpointJmxExtension编写特定于技术的扩展,这些注解允许你提供特定于技术的操作,以增强现有的端点。最后,如果需要访问特定于web框架的功能,可以实现Servlet或Spring的@Controller和@RestController端点,代价是它们在JMX上不可用,或者在使用不同的web框架时不可用
@Configuration(proxyBeanMethods = false)
@ConditionalOnAvailableEndpoint(endpoint = InfoEndpoint.class)
@AutoConfigureAfter(InfoContributorAutoConfiguration.class)
public class InfoEndpointAutoConfiguration {

	@Bean
	@ConditionalOnMissingBean
	public InfoEndpoint infoEndpoint(ObjectProvider<InfoContributor> infoContributors) {
		return new InfoEndpoint(infoContributors.orderedStream().collect(Collectors.toList()));
	}
}
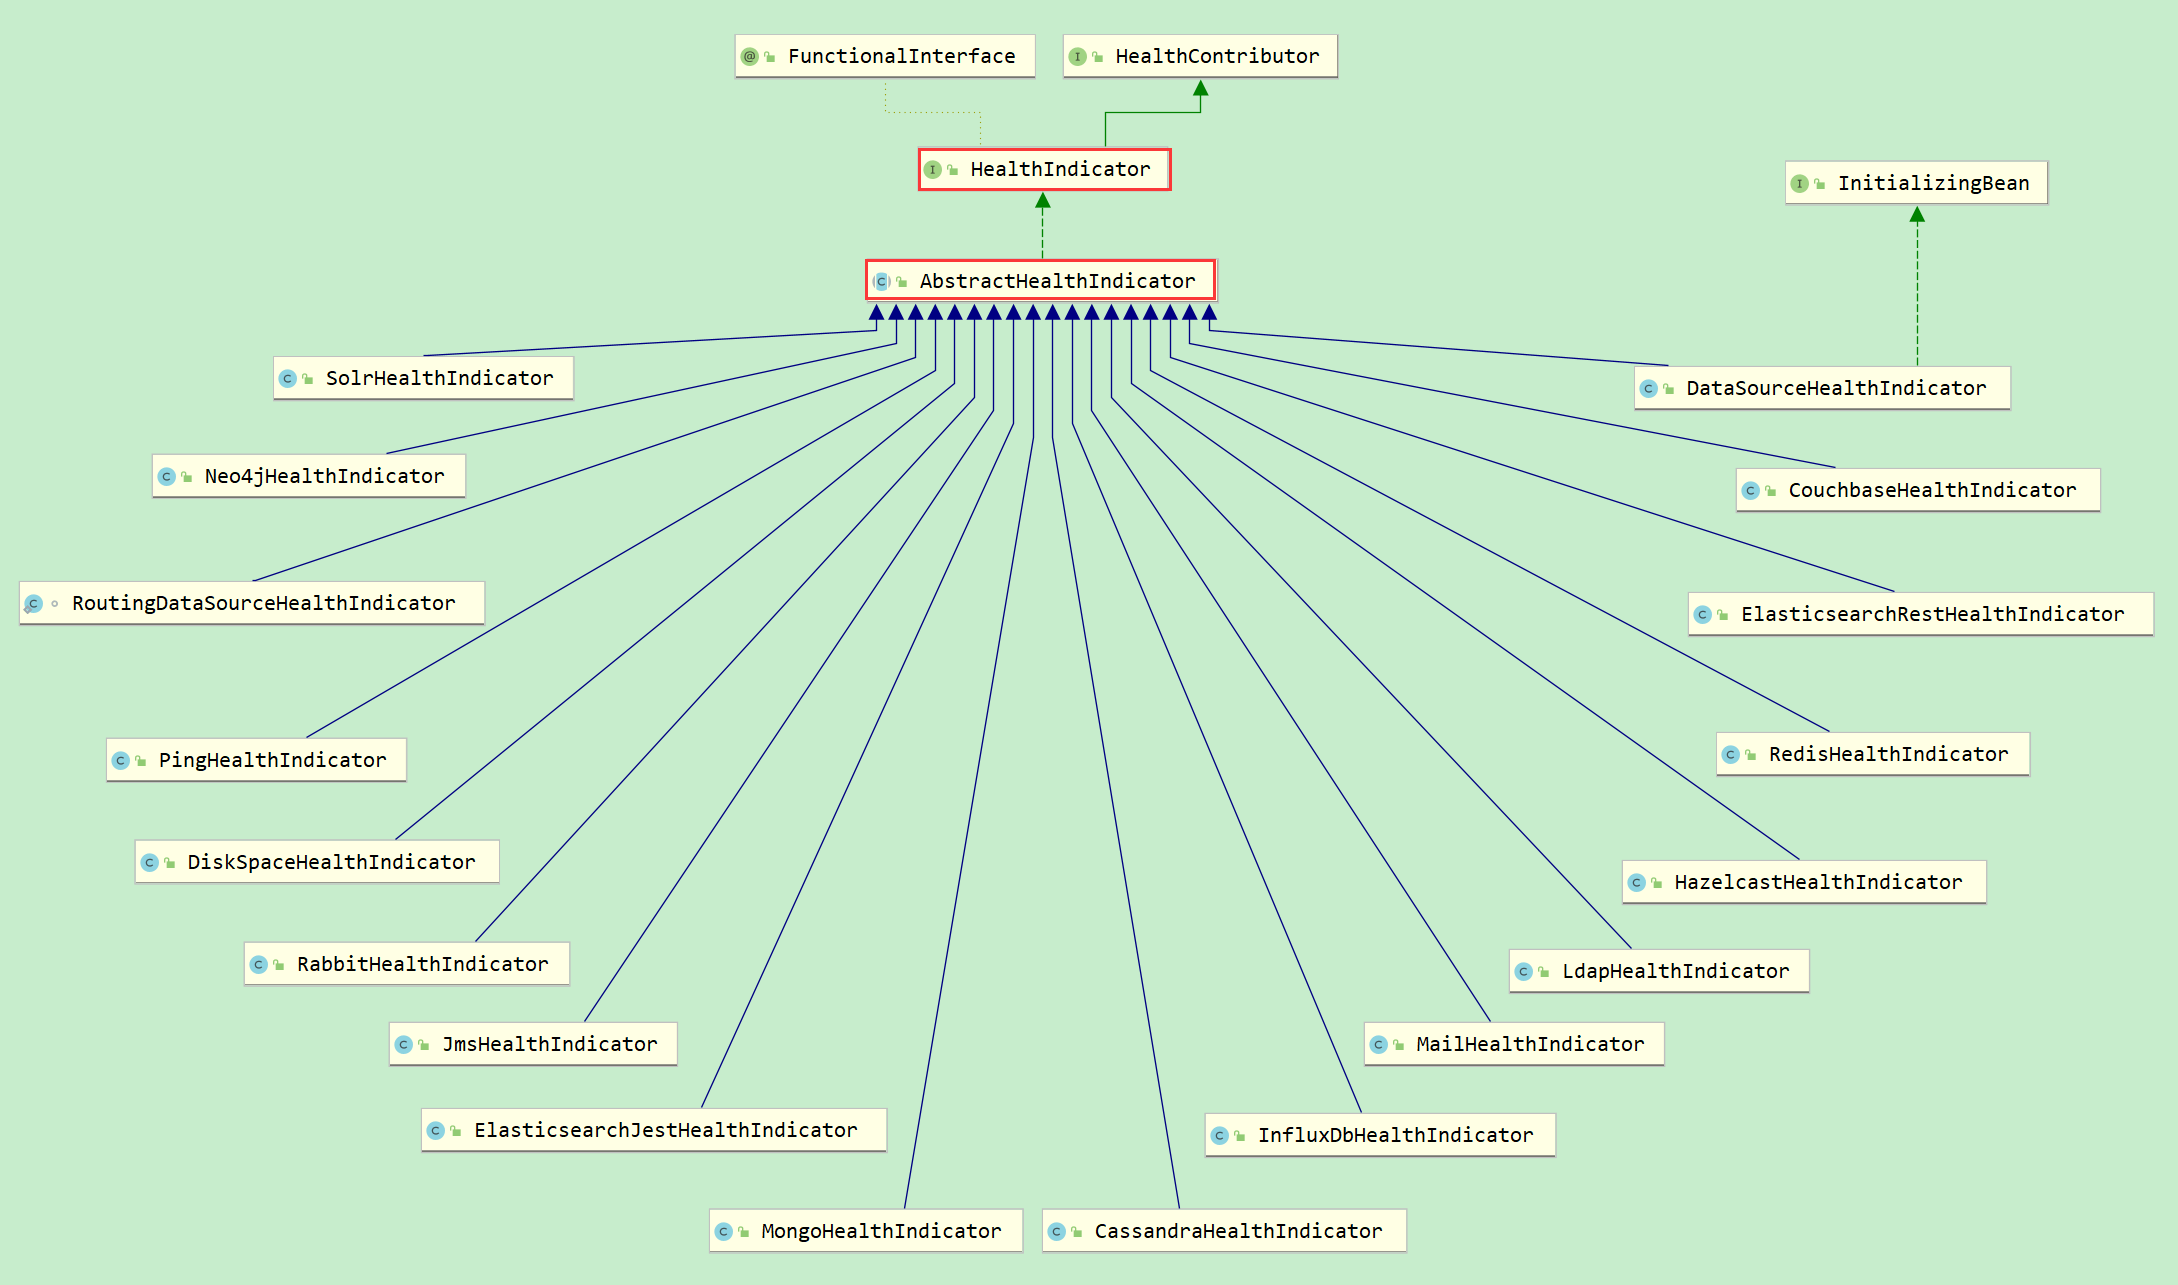
另一种是创建XXXHealthIndicator,这些类继承了AbstractHealthIndicator抽象类,实现了doHealthCheck方法,扩展了health端点。比如solr、redis、dataSource等
此外与spring.factories同级下还有spring-autoconfigure-metadata.properties和spring-configuration-metadata.json配置文件,这2个只是格式不同,都是通过XXXProperties为部分XXXEndpointAutoConfiguration提供参数的
2.endpoint包
主要有3部分组成:
1、Condition:判断是否启用Endpoint
2、JMX导出:创建bean(JmxEndpointDiscoverer、JmxEndpointExporter、ExposeExcludePropertyEndpointFilter)
3、WEB导出:按依赖分别创建Jersey、Reactive、Spring MVC3种定义的XXXEndpointHandlerMapping。由WebEndpointAutoConfiguration创建PathMapper、WebEndpointDiscoverer、ControllerEndpointDiscoverer、PathMappedEndpoints和ExposeExcludePropertyEndpointFilter
即如果你添加一个带@Endpoint注解的@Bean,那么任何带@ReadOperation、@WriteOperation或@DeleteOperation的方法都会自动地通过JMX公开,在web应用程序中,也会通过HTTP公开,可以使用Jersey、Spring MVC或Spring WebFlux通过HTTP公开端点
首先回过来看一下之前application.properties配置endpoints启用是怎么生效的:
// OnAvailableEndpointCondition
public ConditionOutcome getMatchOutcome(ConditionContext context, AnnotatedTypeMetadata metadata) {
	// 1. 判断是否启用,enabled配置,
	ConditionOutcome enablementOutcome = getEnablementOutcome(context, metadata,
			ConditionalOnAvailableEndpoint.class);
	if (!enablementOutcome.isMatch()) {
		return enablementOutcome;
	}
	ConditionMessage message = enablementOutcome.getConditionMessage();
	Environment environment = context.getEnvironment();
	if (CloudPlatform.CLOUD_FOUNDRY.isActive(environment)) {
		return new ConditionOutcome(true, message.andCondition(ConditionalOnAvailableEndpoint.class)
				.because("application is running on Cloud Foundry"));
	}
	AnnotationAttributes attributes = getEndpointAttributes(ConditionalOnAvailableEndpoint.class, context,
			metadata);
	EndpointId id = EndpointId.of(environment, attributes.getString("id"));
	Set<ExposureInformation> exposureInformations = getExposureInformation(environment);
	for (ExposureInformation exposureInformation : exposureInformations) {
		// 2. 判断是否导出,expose配置
		if (exposureInformation.isExposed(id)) {
			return new ConditionOutcome(true,
					message.andCondition(ConditionalOnAvailableEndpoint.class)
							.because("marked as exposed by a 'management.endpoints."
									+ exposureInformation.getPrefix() + ".exposure' property"));
		}
	}
	return new ConditionOutcome(false, message.andCondition(ConditionalOnAvailableEndpoint.class)
			.because("no 'management.endpoints' property marked it as exposed"));
}


// 1. AbstractEndpointCondition
// enabled配置,判断指定配置是否启用,因为我们没有配置就用默认
protected ConditionOutcome getEnablementOutcome(ConditionContext context, AnnotatedTypeMetadata metadata,
			Class<? extends Annotation> annotationClass) {
	Environment environment = context.getEnvironment();
	AnnotationAttributes attributes = getEndpointAttributes(annotationClass, context, metadata);
	EndpointId id = EndpointId.of(environment, attributes.getString("id"));
	String key = "management.endpoint." + id.toLowerCaseString() + ".enabled";
	Boolean userDefinedEnabled = environment.getProperty(key, Boolean.class);
	if (userDefinedEnabled != null) {
		return new ConditionOutcome(userDefinedEnabled, ConditionMessage.forCondition(annotationClass)
				.because("found property " + key + " with value " + userDefinedEnabled));
	}
	Boolean userDefinedDefault = isEnabledByDefault(environment);
	if (userDefinedDefault != null) {
		return new ConditionOutcome(userDefinedDefault, ConditionMessage.forCondition(annotationClass).because(
				"no property " + key + " found so using user defined default from " + ENABLED_BY_DEFAULT_KEY));
	}
	boolean endpointDefault = attributes.getBoolean("enableByDefault");
	return new ConditionOutcome(endpointDefault, ConditionMessage.forCondition(annotationClass)
			.because("no property " + key + " found so using endpoint default"));
}

// 2. 查看expose配置,判断是否导出,
boolean isExposed(EndpointId endpointId) {
	String id = endpointId.toLowerCaseString();
	// 这里有我们之前配的env,所以env在这里会返回false
	if (!this.exclude.isEmpty()) {
		if (this.exclude.contains("*") || this.exclude.contains(id)) {
			return false;
		}
	}
	// 这里有我们配置的*,因此跳过
	if (this.include.isEmpty()) {
		if (this.exposeDefaults.contains("*") || this.exposeDefaults.contains(id)) {
			return true;
		}
	}
	// 由于是*,返回true
	return this.include.contains("*") || this.include.contains(id);
}
然后在ConfigurationClassParser类中会根据返回结果判断conditionEvaluator.shouldSkip是否要跳出,如果不跳出,最后会执行doProcessConfigurationClass方法,就会将该endpoint控制器注册到IOC中得以使用
3.metrics包
主要是做绑定数据到MeterRegistry的事情
首先创建MeterRegistryPostProcessor
@Configuration(proxyBeanMethods = false)
@ConditionalOnClass(Timed.class)
@EnableConfigurationProperties(MetricsProperties.class)
@AutoConfigureBefore(CompositeMeterRegistryAutoConfiguration.class)
public class MetricsAutoConfiguration {
	//...
	@Bean
	public static MeterRegistryPostProcessor meterRegistryPostProcessor(ObjectProvider<MeterBinder> meterBinders,
			ObjectProvider<MeterFilter> meterFilters,
			ObjectProvider<MeterRegistryCustomizer<?>> meterRegistryCustomizers,
			ObjectProvider<MetricsProperties> metricsProperties, ApplicationContext applicationContext) {
		return new MeterRegistryPostProcessor(meterBinders, meterFilters, meterRegistryCustomizers, metricsProperties,
				applicationContext);
	}
}
MeterRegistryPostProcessor实现了BeanPostProcessor接口,配置MeterRegistry
@Override
public Object postProcessAfterInitialization(Object bean, String beanName) throws BeansException {
	if (bean instanceof MeterRegistry) {
		getConfigurer().configure((MeterRegistry) bean);
	}
	return bean;
}

private MeterRegistryConfigurer getConfigurer() {
	if (this.configurer == null) {
		boolean hasCompositeMeterRegistry = this.applicationContext
				.getBeanNamesForType(CompositeMeterRegistry.class, false, false).length != 0;
		this.configurer = new MeterRegistryConfigurer(this.meterRegistryCustomizers, this.meterFilters,
				this.meterBinders, this.metricsProperties.getObject().isUseGlobalRegistry(),
				hasCompositeMeterRegistry);
	}
	return this.configurer;
}
配置MeterRegistry,将各个MeterBinder注册到MeterRegistry
// MeterRegistryConfigurer
void configure(MeterRegistry registry) {
	// Customizers must be applied before binders, as they may add custom
	// tags or alter timer or summary configuration.
	// 上面写的全局tag就是在这方法里调用的
	customize(registry);
	addFilters(registry);
	if (!this.hasCompositeMeterRegistry || registry instanceof CompositeMeterRegistry) {
		// 注册
		addBinders(registry);
	}
	if (this.addToGlobalRegistry && registry != Metrics.globalRegistry) {
		Metrics.addRegistry(registry);
	}
}

// 执行各自定义MeterBinder的bindTo方法
private void addBinders(MeterRegistry registry) {
	this.binders.orderedStream().forEach((binder) -> binder.bindTo(registry));
}
然后在MeterRegistryPostProcessor类中传进来的MeterRegistry是SimpleMeterRegistry,其在SimpleMetricsExportAutoConfiguration(spring.factories配置)中被创建
参考:
Spring Boot 参考指南(端点)
production-ready-endpoints
Recommend
About Joyk
Aggregate valuable and interesting links.
Joyk means Joy of geeK