

RebelLabs Developer Productivity Report 2017: Why do you use the Java tools you...
source link: https://zeroturnaround.com/rebellabs/developer-productivity-report-2017-why-do-you-use-java-tools-you-use/
Go to the source link to view the article. You can view the picture content, updated content and better typesetting reading experience. If the link is broken, please click the button below to view the snapshot at that time.
Developer Productivity Report 2017: Java Tools Usage
Welcome to the RebelLabs Developer Productivity Report 2017! This is an analytical report based on an online survey of the Java community about Java tools usage by teams and developers, popularity and reasons for using these tools, architecture choices and so on. For this year's report, we focused on why Java developers use the tools they use and how satisfied they are with their choices in Java developer tools, architecture, and so on.
Looking for more up to date information? See the results of the 2021 Java Developer Productivity Report.
Previous Developer Productivity Reports
If you wish, you can skim through the reports for previous years:
However, to be honest, reading all these reports is not a requirement to enjoy the analysis of the current trends and data. So strap in, and let us learn why Java developers use the tools they use and how satisfied they are doing it.
Java Development Tools and Technologies 2017
At RebelLabs, we have been creating the reports based on community surveys for 6 years. One of the main reasons for doing this is to understand how the community of Java developers evolves, which tools they use and what are the current trends, provided we can trace any. Since it's Java we're talking about, nothing moves quite at the light speed, and not a lot changes in tool choices over a year. That's why we try to do a landscape report every two years. In the years between them, we try to ask questions about something more specific. For example performance problems and how you solve them, productivity and team communication tools. This year we decided to dig deeper and ask about the reasoning behind choosing what Java developer tools you work with.
In order to get the data, we run a public RebelLabs survey every year, asking everyone we know to fill it, share it with their network and encourage everybody to complete it. The reason is very simple: the more data we get, the more comprehensive the results become. And yes, we know, it's not the most scientific method to sample the community.
Indeed, it reaches ZeroTurnaround customers and the developers who are close to us on the social networks first. But this is probably the best we can do. We do not claim the results represent the whole community. There certainly are developers, teams, and projects, which are different from a typical survey respondent. However, we tend to believe, and the results year after year suggest that the data we get is significant, representing the Java community and typical Java developers quite a bit.
The Data
The data for this report comes from the results of a public RebelLabs survey that we ran in May–July 2017. We received about 2060 responses. This year, the report focuses on the reasons why developers use their tools. The central questions in the survey follow the structure below. We surveyed the usage of IDEs, main programming languages, main application stack choices, the architecture of the apps, and database choices.
In every category, we asked the following questions:
- What is your main X? Here X marks either an IDE, programming language, etc.
- What is the main reason you use X?
- How satisfied are you with your choice of X? Rate it on a scale of 1 to 10, with one being the lowest and 10 being the highest
- If the satisfaction was 5 or less, what is the main reason preventing you from moving to a different choice for X?
The survey was powered by Typeform and the data was pulled into a relational database for querying. This year we've made the data available publicly. If you are interested in any findings not covered in this report, just clone a repository, fiddle with the SQL queries a bit and publish any interesting nuggets of information you find interesting. To make the report easier to digest, the graphs in this article are created without considering the outliers. For brevity, we decided any answer less popular than 1% to be an outlier. That is, all the queries were configured to ignore responses with counts less than 20. This removes some unnecessary diversity of the tech choices (sorry, emacs users), but it does not change the big picture.
Respondents
Let's first see what a typical survey respondent looks like. We've asked a bunch of questions about their geography, project type, company and team sizes, and so on. If by the end of this chapter you think that the profile it paints doesn't represent Java developers you know, well, you can save some time by not reading the findings any further.
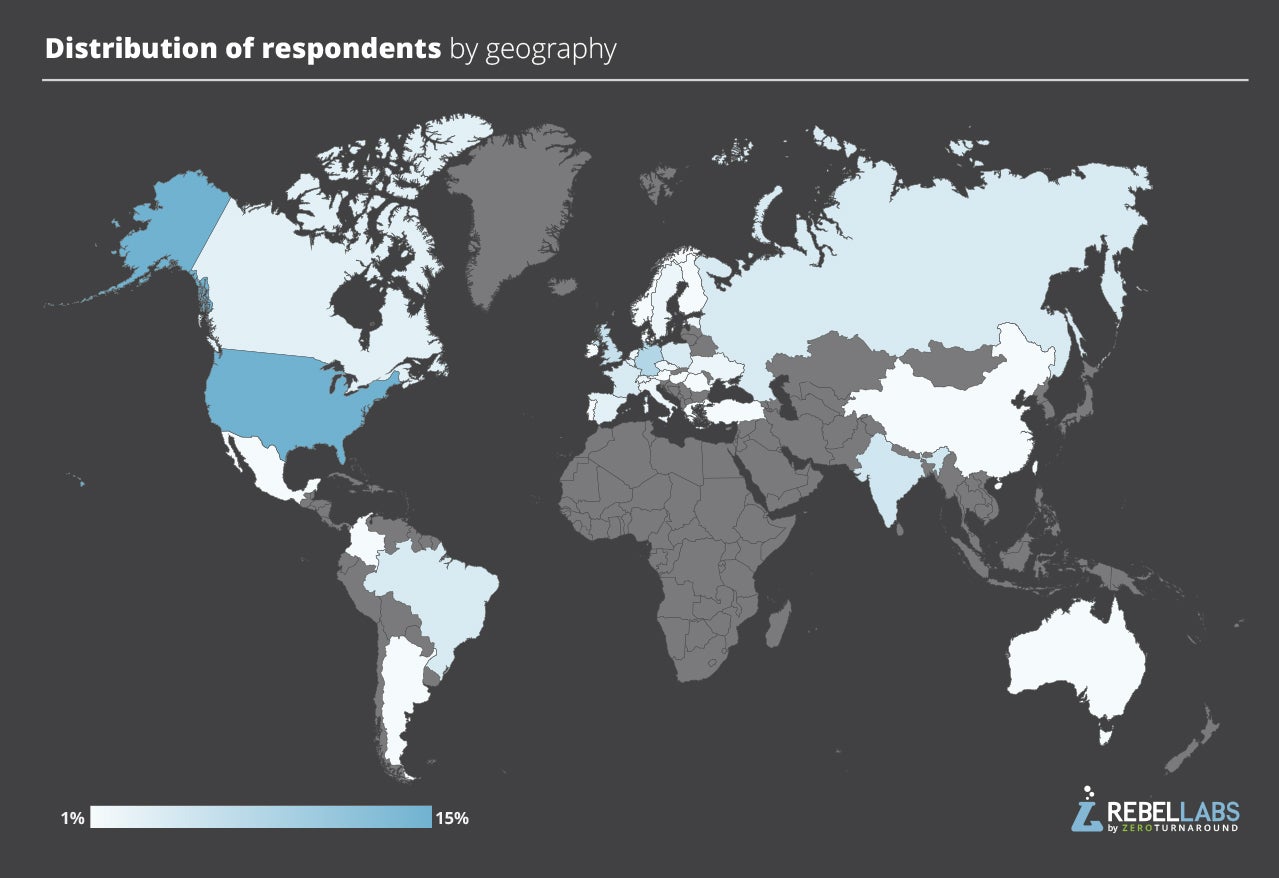
In this year's report, for the first time, we asked what country our respondents are working from. This was an optional question. Anyone feeling like they didn't have a good answer, for example, working from Europe for a US company, or respondents who didn't feel like sharing their location didn't have to drop filling the survey altogether. The most popular countries in the survey were: the USA at around 15%, Germany at 8%, the United Kingdom at 6%, and India and Brazil at 5% each. In total, we got responses from 103 countries all over the world.
Next, let's look at the distribution of the respondents by job titles. We offered a choice of positions where all software engineers and Java developers were bundled into a software developer option. And the developers make up the bulk of the responses at 54%. Architects and team leads make up 18% and 17% of the responses respectively, with a minor presence of consultants (4%), management (2%), higher management (2%), and developer advocates (3%).
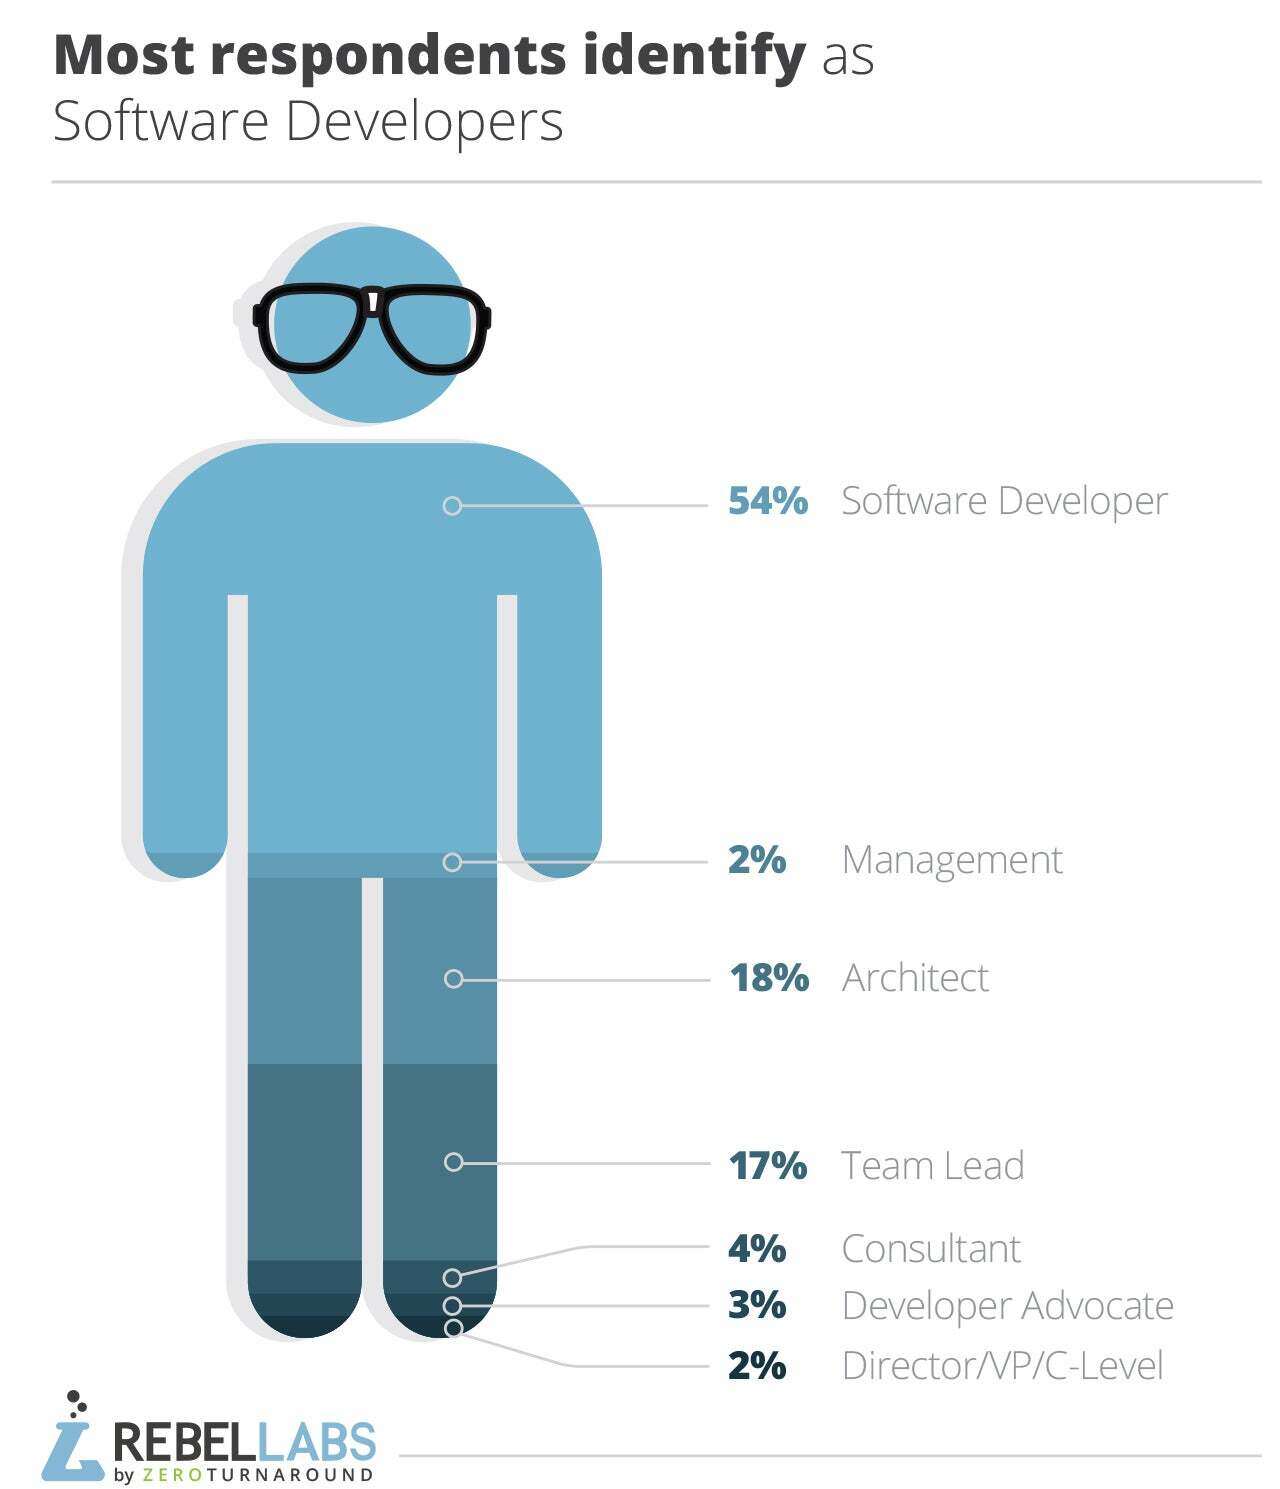
It was quite surprising to see that many people from the developer relations teams, but we guess it's their job to participate in all kinds of community efforts. All in all, technical positions make up the absolute majority of the respondents. This way we know that we're getting data from the people who live and breathe code every day.
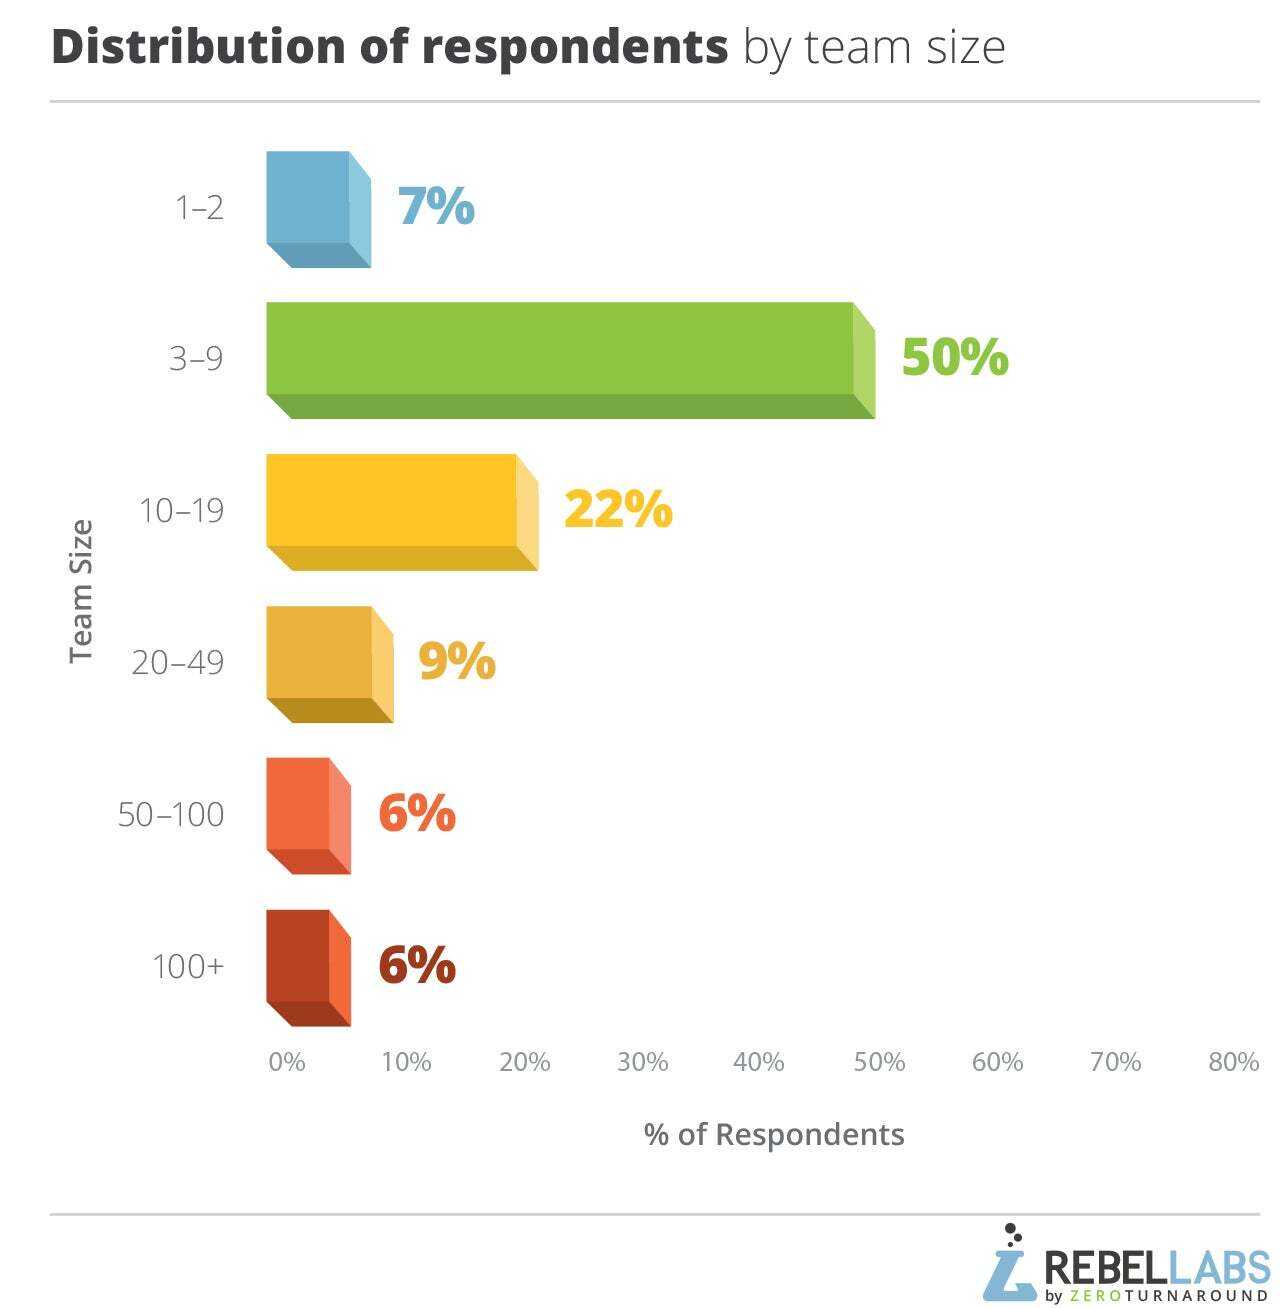
Next, let's take a look at the team sizes that the developers work in. It would make sense that the bigger the team, the more time communication, meetings, and other managerial overheads consume. The team size certainly influences the tool choices you make. It's one thing to be a lone hacker editing class files directly in hex mode in vim—the team of a few dozen developers requires a different approach to the development process. Roughly following the advice of the two pizza teams, the most popular team size was 3 to 9 people, for almost half of all responses. A slightly larger team size, 10 to 19, stands strong at 22% with the rest of the options being slightly under 10% each.
Another respondent profiling question we asked was about the experience in the field. As you can see, more than half of the respondents have 6 to 15 years of experience. There was a surprisingly small amount of less experienced developers. Less than 2 years stands at 5%, and 5-10 years at 14%. Meaning only 1 in 5 respondents has less than 6 years of experience. Bear in mind that this is a self-qualifying question, where anyone could pick the result with a step of 1 year.
We've bundled the results into the groups afterward. People tend to select round numbers when being asked about the timelines, so 10 years received 12% of the responses, 20 years 8%. The numbers around them were less popular: 9 and 11 at 3% each, 19 and 21 at around 1%.
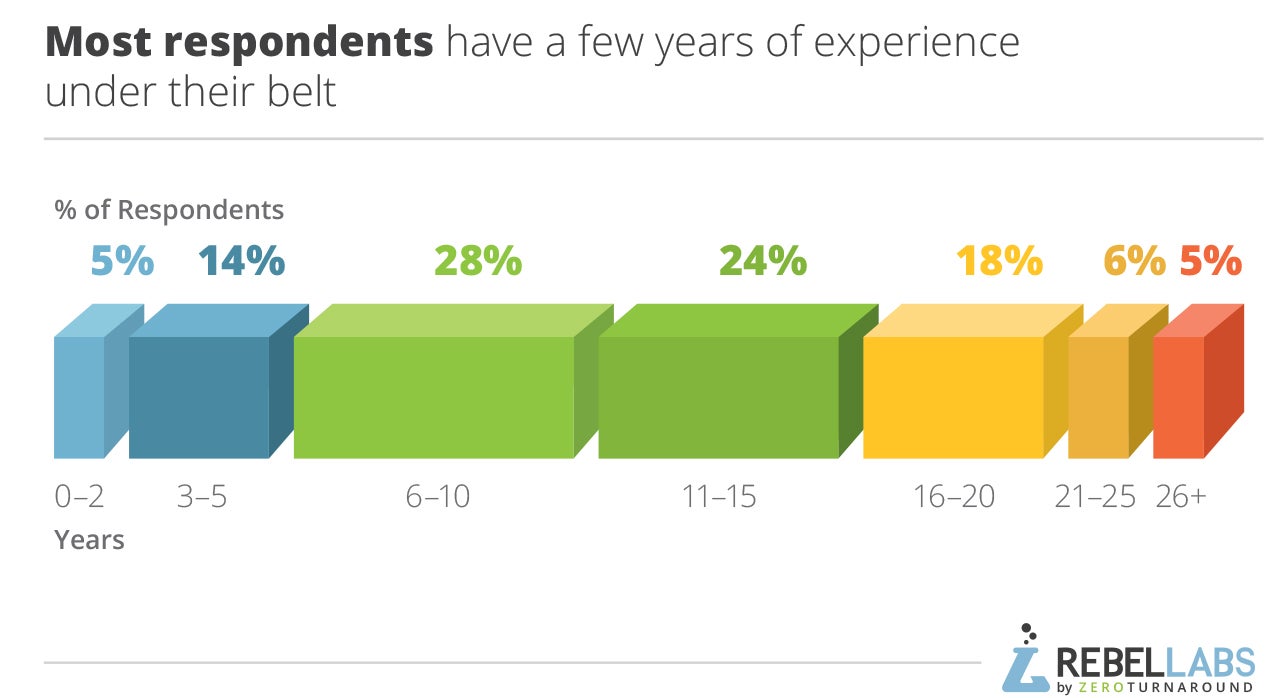
However, when looking at the distribution, it feels believable. Java is 20 years old, if someone did get into development in the early 2000s, they would have approximately 13 years of experience. They would quite possibly develop in Java or for the JVM.
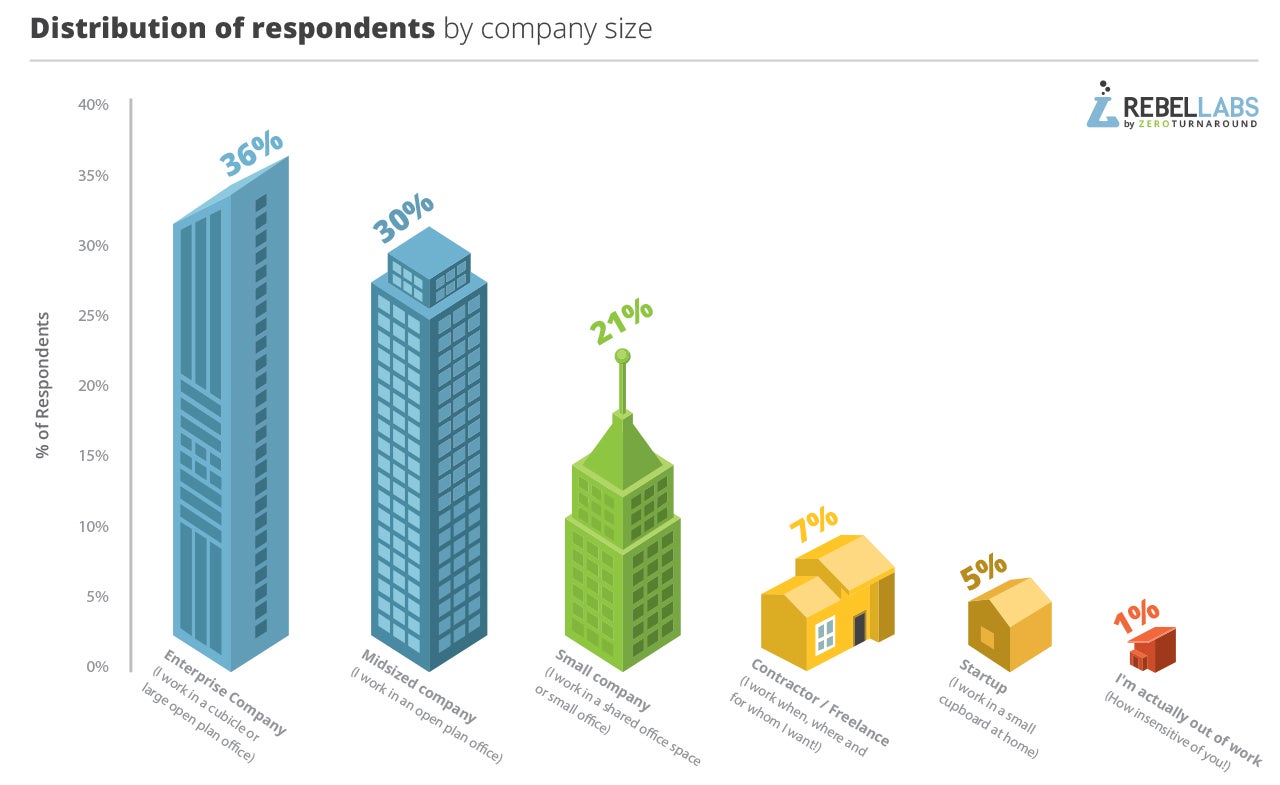
We're almost done with the soft questions. For a better understanding of the background of the developers responding about their tooling choices, we need to understand the companies they're coming from. Hacking an MVP in a friend’s garage allows more freedoms than working with government contracts at a Fortune 500 company (where the bosses allegedly never get fired for buying IBM).
In past reports about the Java ecosystem landscape, we also included the question about what type of application the respondents develop: web apps, libraries, and so on. However, this year it was replaced by one of the main questions about what application stack their main project uses. It is highly likely that if they use Spring Framework or Java EE, the project is most probably a web app. Other choices, like libraries or desktop apps, also imply project types. We simply did not need to include that question twice.
Java Tools & Technology Questions
Whoa! You made it to the main part of the report! Let's be honest, the most interesting part of any RebelLabs report is about the tools that teams use all over the world. We all like comparing ourselves to others seek validation for our choices, or if we are not happy with what we currently use, seek to learn what has a better reputation.
What Java Tools Do You Use?
Let's start with the bread and butter of any developer. The thing they look at all day, their most precious and personal tool they hone through the years and which they love to love the most: the IDE. By the way, the opposite would be the build tools, which are at the pinnacle of hatred. No one likes them.
There are three leading Java IDEs. All three are relatively well represented in the report data. IntelliJ IDEA is the IDE of choice for the Java developers we reached, looming over the other two at 54%. One in three developers uses Eclipse IDE (33%), and 13% said they use NetBeans.
Since this is not the first report where we ask about the IDE you use, and the previous editions of this question received a similar number of responses, we graphed the progression of the IDE market share over the last several years.
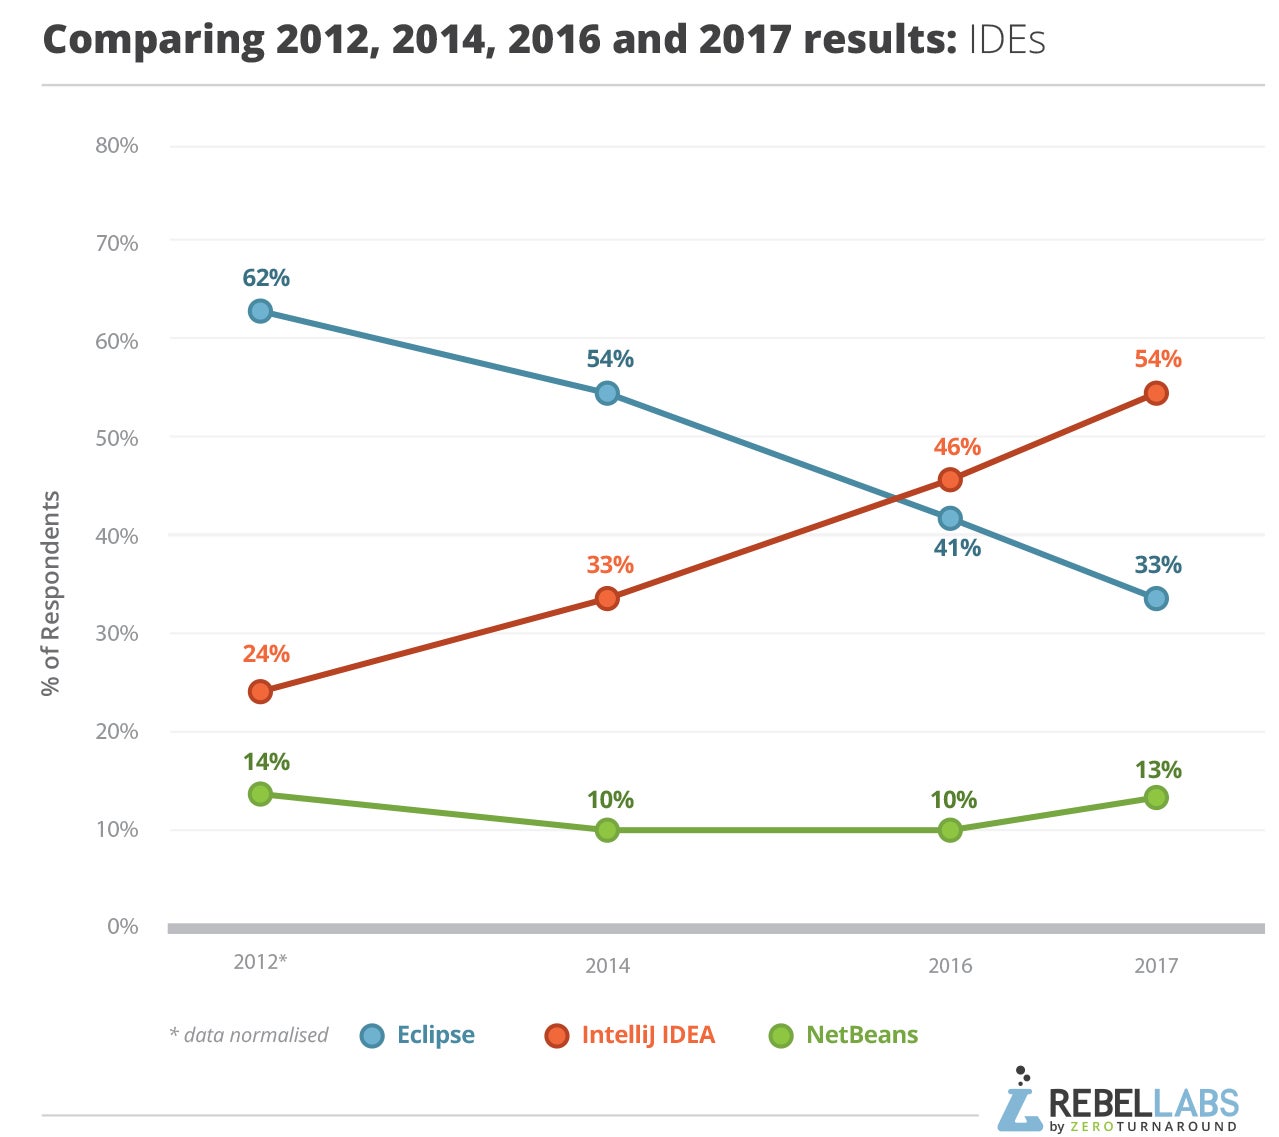
As you can see, IntelliJ IDEA continues gaining Java IDE market share, enjoying more than half of the respondents' votes now. It's going to be interesting to see whether it'll continue to gain popularity in the years to come.
Let's now look at the programming language popularity. Similarly to the previous reports, we posed the question about the main programming language of your main project. This way, even if you use multiple languages in several projects, you had to pick one that is the most important to you.
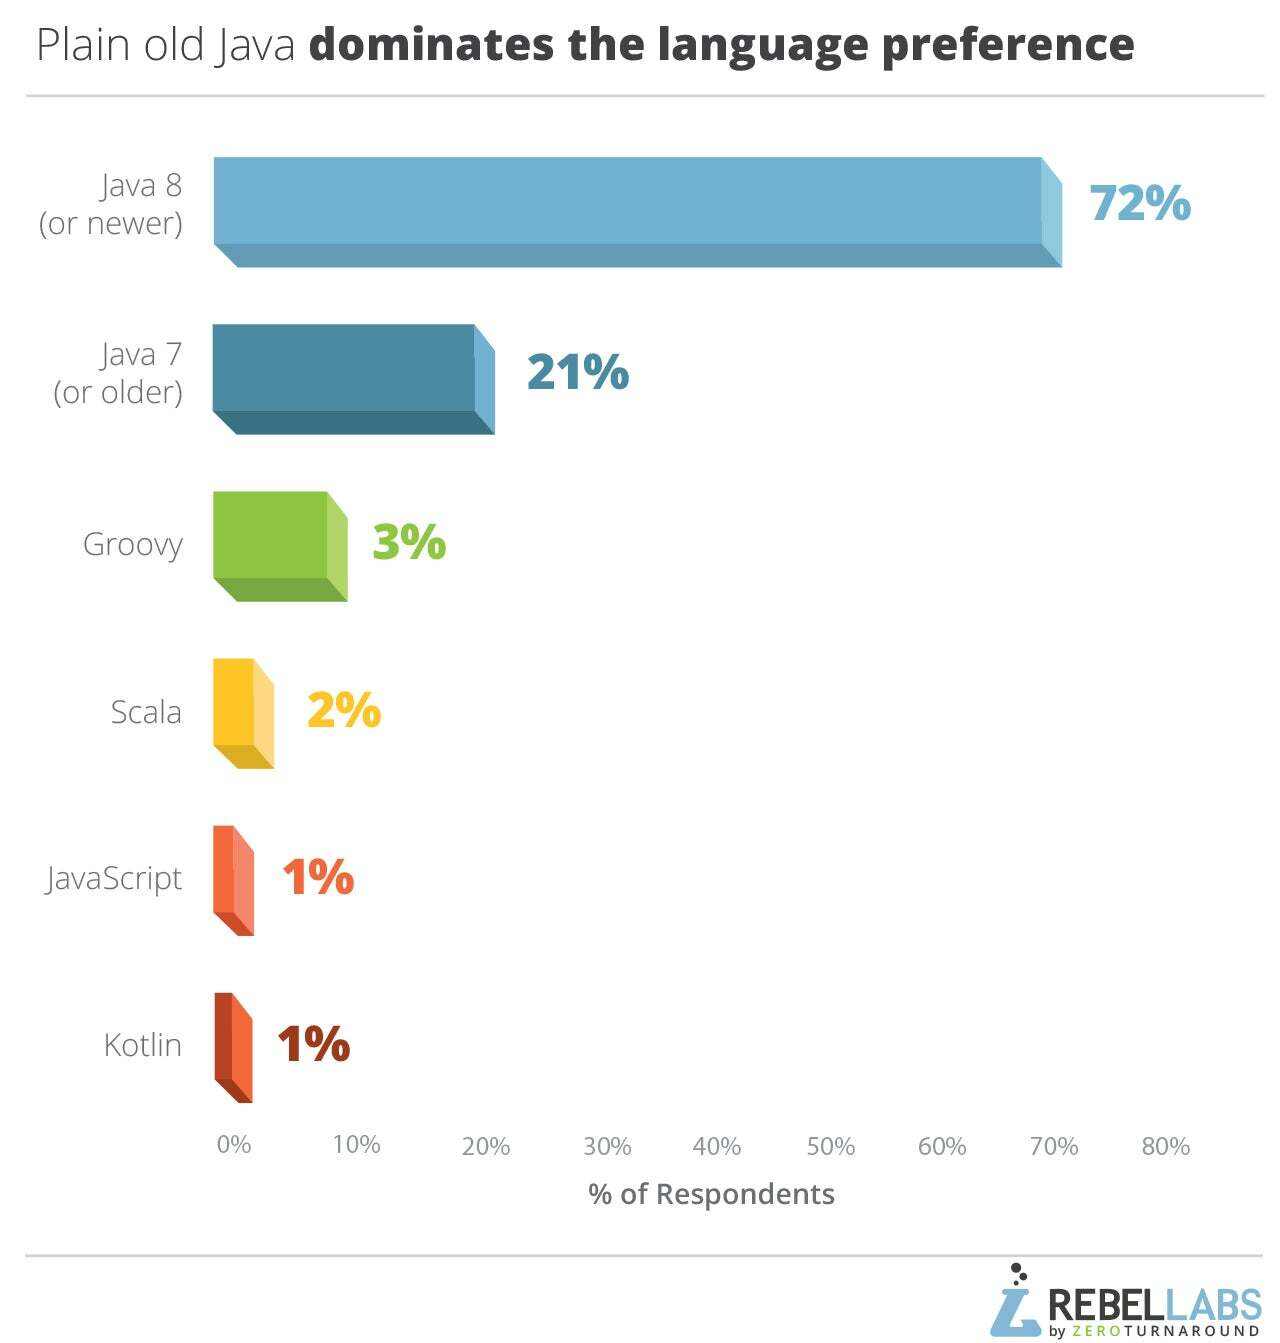
Not surprisingly, Java 8 is the leader of this language race, standing at 72% of all answers. Java 7 and older is the next most popular answer, which is also not surprising since many main projects would be older than the green eld projects. What is surprising: the end of public updates for Java 7 was back in July 2015! What can we say? It would seem that It's time to consider an upgrade. Maybe even trying out the upcoming Java 9, which has been cooking for over 7 years. That one has got to be good, right? The alternative JVM languages are present as usual, but their total share falls lower than 10%. A newcomer to our report, Kotlin, the latest addition to the publicly acceptable JVM languages family, makes its debut at 1%.
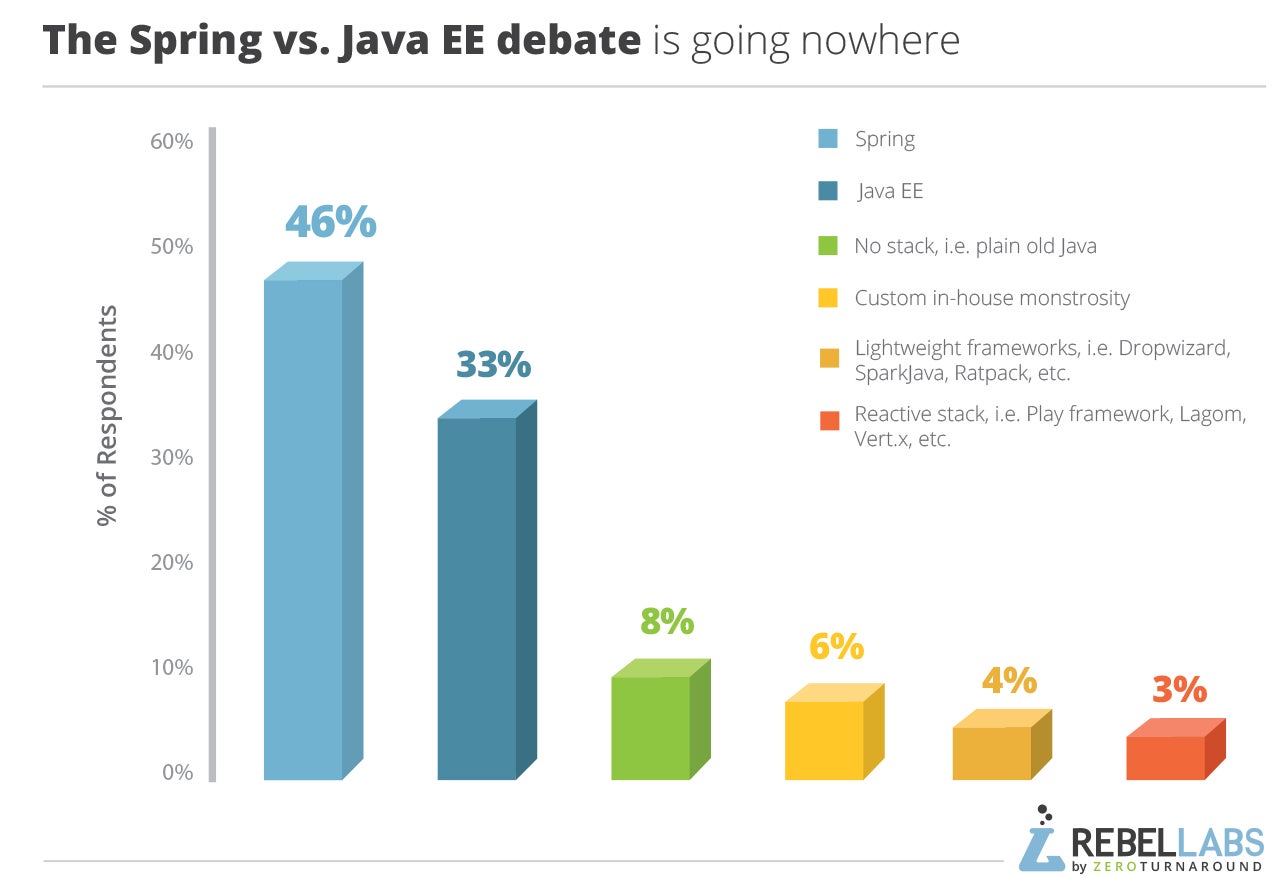
Next, we asked about the application stack for your main projects. This question somewhat replaced the one about what type of applications you develop. It's an interesting question to consider. It doesn't talk about web frameworks, but rather what's the most important component of your application stack, powering the whole system. However, the Spring stack (most famous for the Spring Framework, which is a web framework) is the top choice at 46%. That's right, almost 1 in 2 developers base their code on Spring. About one in three voted for Java EE (33%). About 8% work without any named stacks. Note that despite some hype about the microservices and how lightweight frameworks can help you with building them, they do not rate very high in real usage. Neither do the reactive approaches to creating applications, with just 3% of the respondents saying that their main projects are reactive.
However, it is an interesting question. Spring 5, with its milestone releases available, comes with a reactive web framework baked in. Next year we might see a wider adoption of the reactive stacks, provided those 47% of Spring projects would start leveraging this new opportunity.
The next question was about the architecture choices of their main project. Its answers can be interpreted to find out what types of applications our respondents develop. The choices we offered included the monolithic app, microservices, or a split architecture where the frontend is not served completely by the backend but contains the business logic itself.
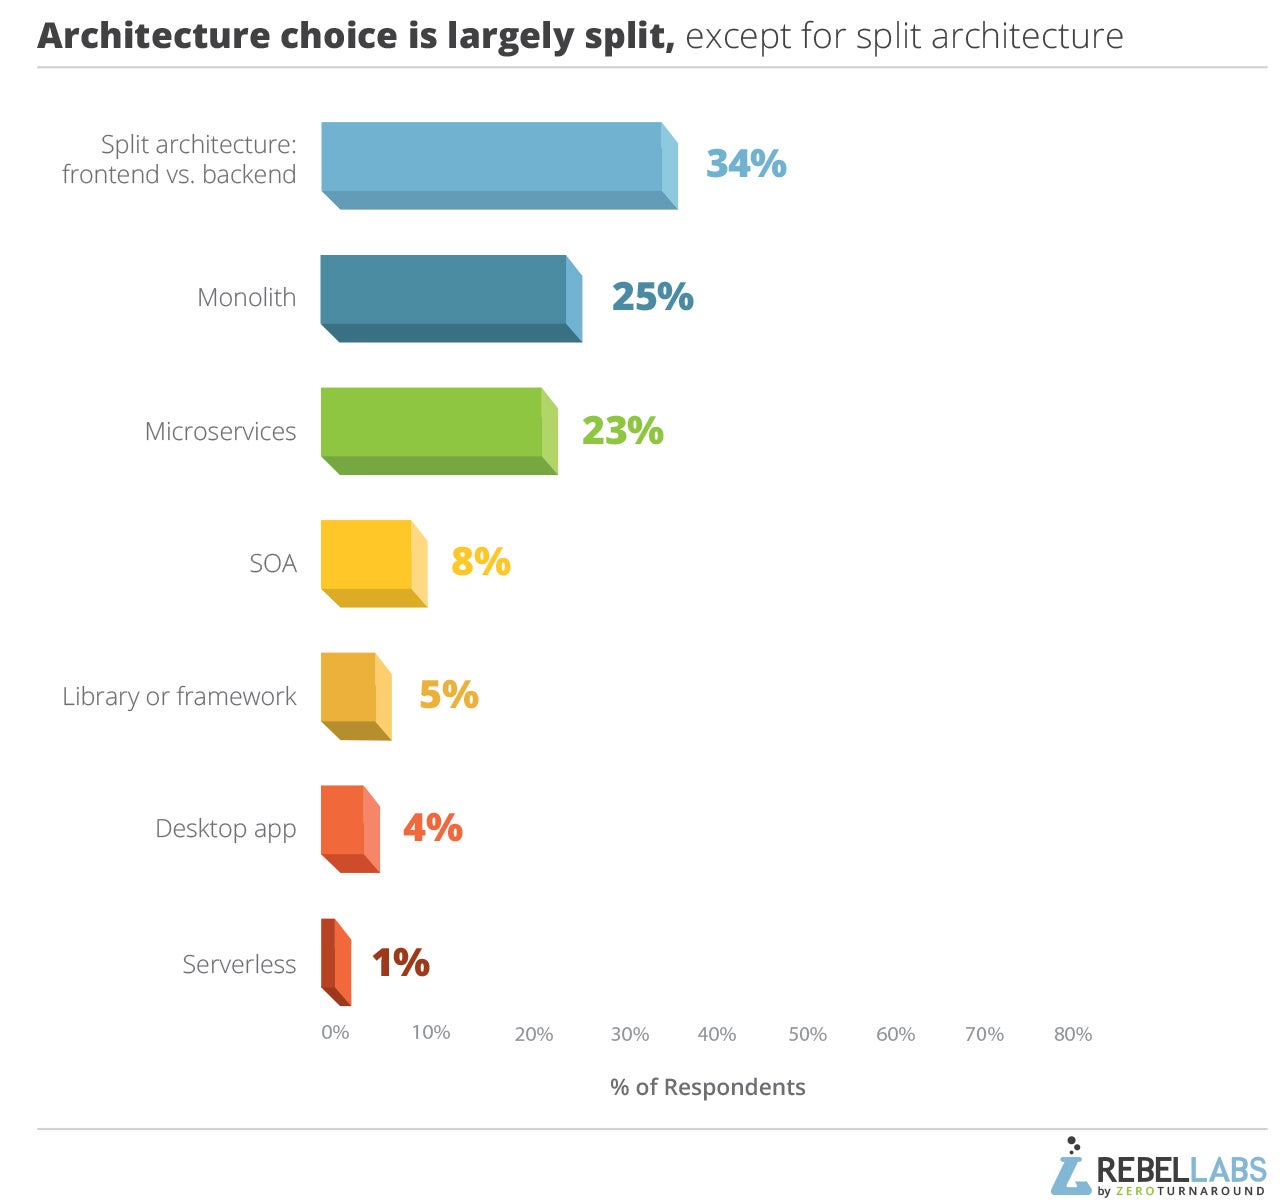
Somewhat not surprisingly, the split architecture option takes the top spot in this list with 34%. This architecture choice was popular with all kinds of Single Page Apps and the vast ecosystem of JavaScript frameworks. Another result of note here is that the microservices architecture has almost caught up with the popularity of the monolithic approach, with 23% and 25% percent respectively. What is unexpected, is the appearance of the Serverless architecture in the data, albeit with a minimal popularity of 1%.
The last piece of technology we asked about were the databases. Almost no application can live without it, and some say the data is more important and outlives the code that collected and crunched that data.
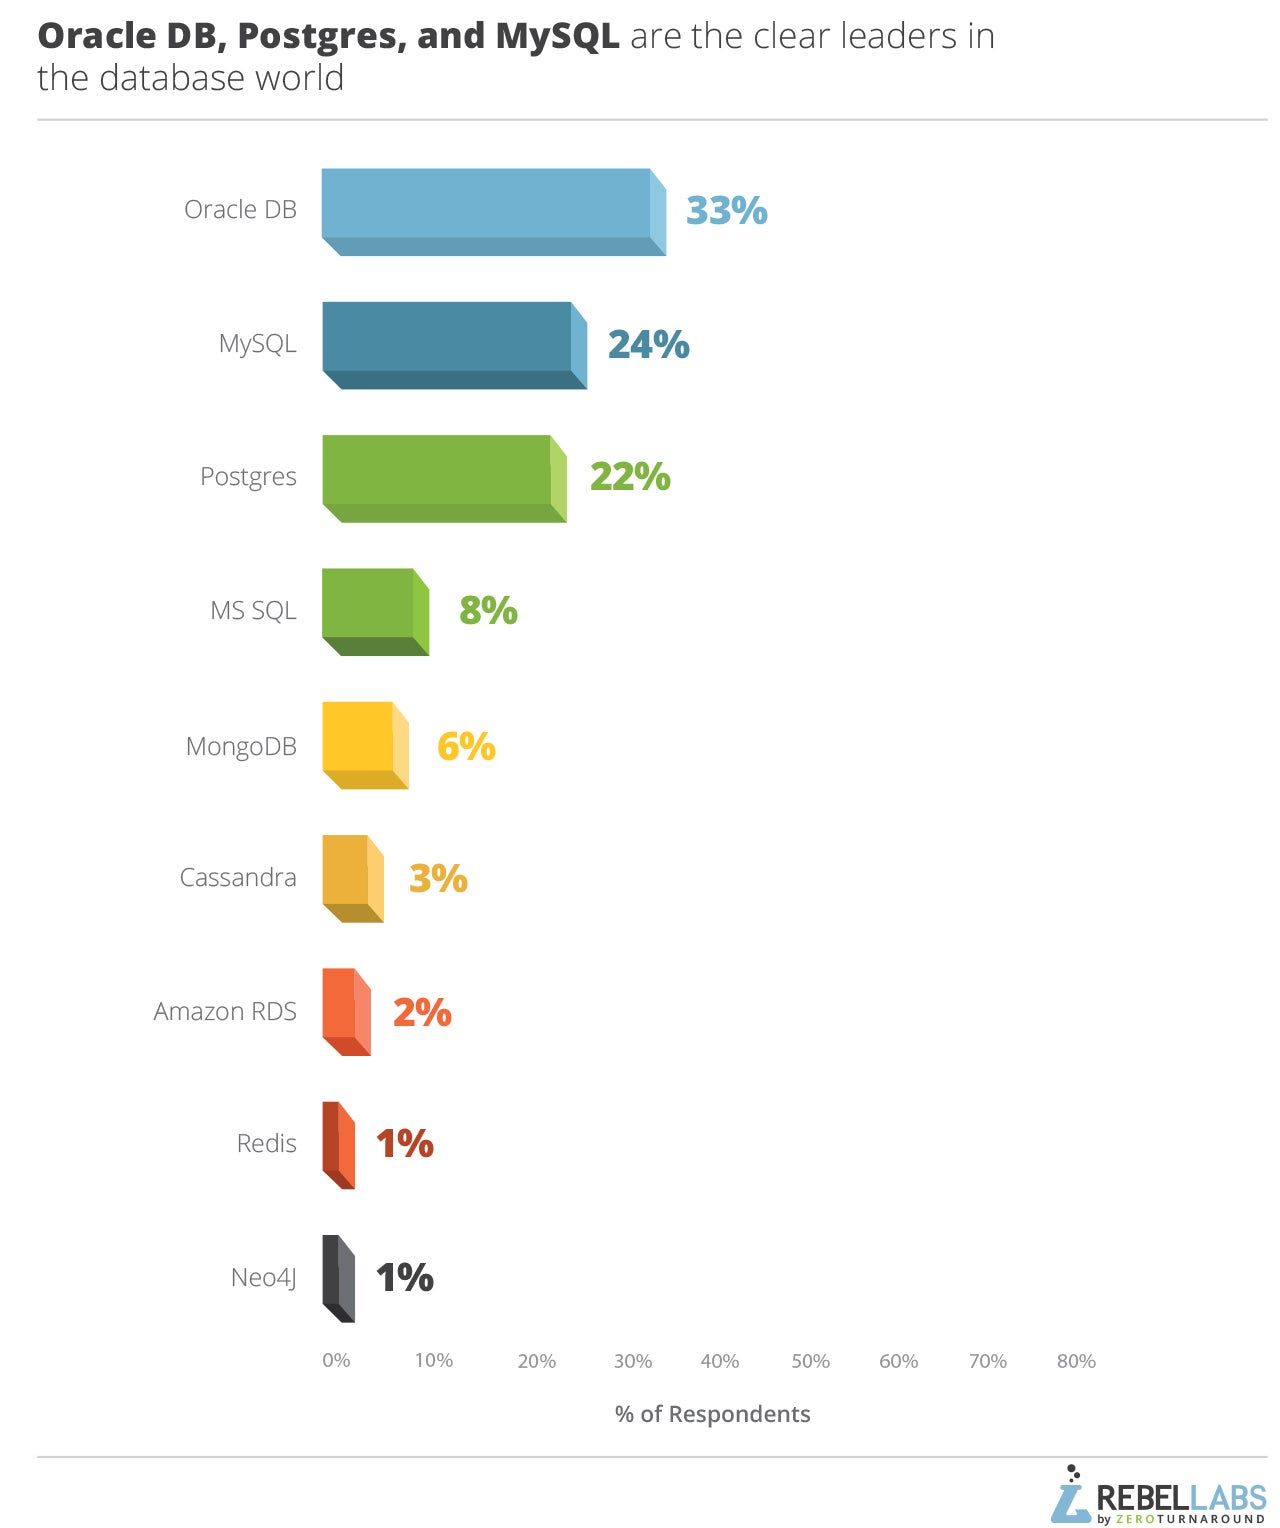
Oracle DB is the leader of the databases race, with almost 1 in 3 respondents saying they use it. MySQL and Postgres are sharing the podium with 24% and 22% each. MongoDB is the most popular NoSQL solution with 6%. Our favorite entry here is Neo4J (1%), the most prominent graph database. Given that graphs are quite a niche way of modeling the data in typical enterprises, it is still worth paying attention to.
Last year when we were asking about the databases teams use, Oracle DB was also a leader, but in a much tighter race, MySQL was just 1% behind it. However, then it was a multiple choice question where the respondents said which databases they use. The difference between the results of the last year and now might be an artifact of the sample, or showing that when it comes to production and the most important database projects have, Oracle DB has a slightly larger lead.
Do You Like the Java Tooling Choices You Have Made?
All right, we're through with the popularity of usage. Let's dig into whether the choices are similarly loved or hated. In the survey, we asked to rank how satisfied are the respondents with the tools they chose previously on a scale from 1 to 10. Let's look at the results of these questions in the same order as we looked at the usage of tools. It should be no surprise that all IDEs are loved. The average ratings for the IDEs hover around 8 (out of 10). After all, the IDE is very often a personal choice. If you're not satisfied with your current one, say NetBeans IDE, you can always look at the others: Eclipse IDE or IntelliJ IDEA. 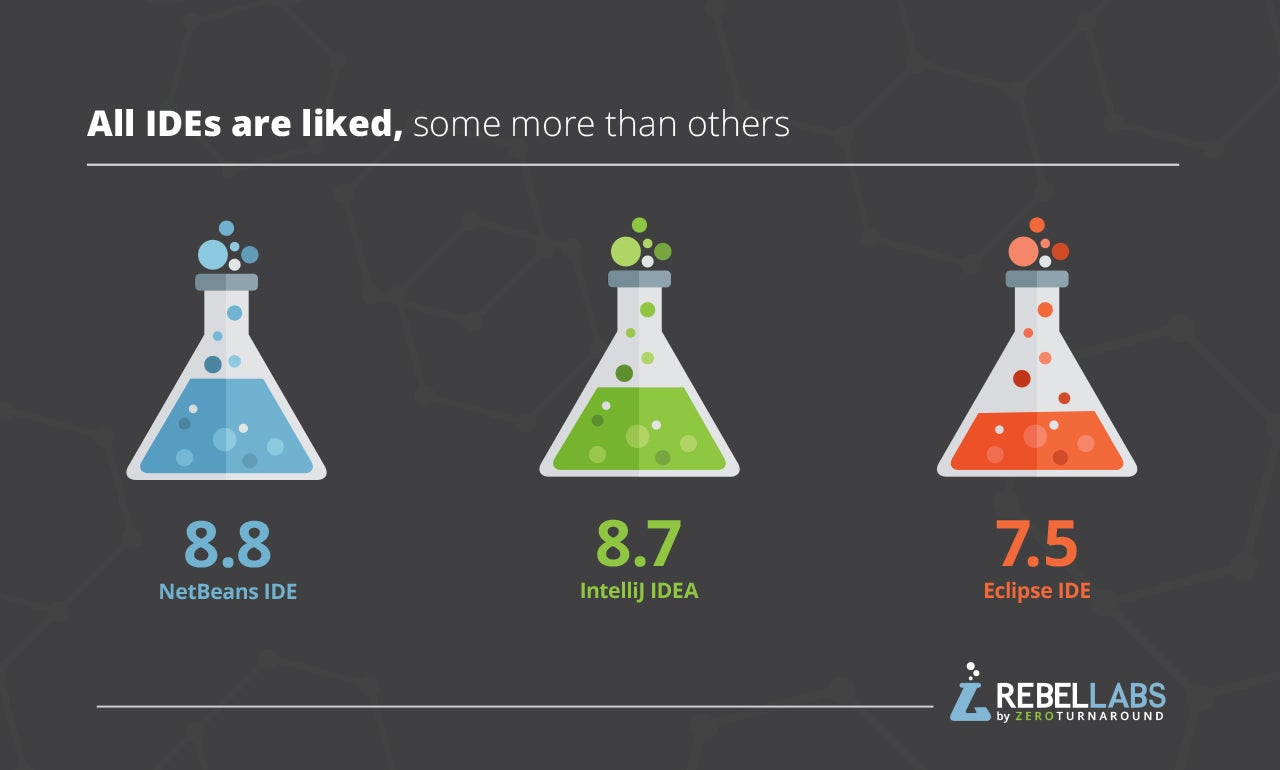
All in all, it's hard to argue with the data, so here it is: NetBeans IDE has the highest satisfaction rating out of three main Java IDEs, with a satisfaction score of 8.8. IntelliJ IDEA, which has a larger market share in this survey, is very close to it with 8.7. Eclipse IDE is not liked as much and stands behind with 7.5. We know it's hard to compare rankings like that with just a single number, so here are the standard deviation numbers for all three IDEs: NetBeans IDE—1.27, IntelliJ IDEA—1.1, and Eclipse IDE—1.42. One thing these show us is that Eclipse IDE satisfaction is the most volatile of three.
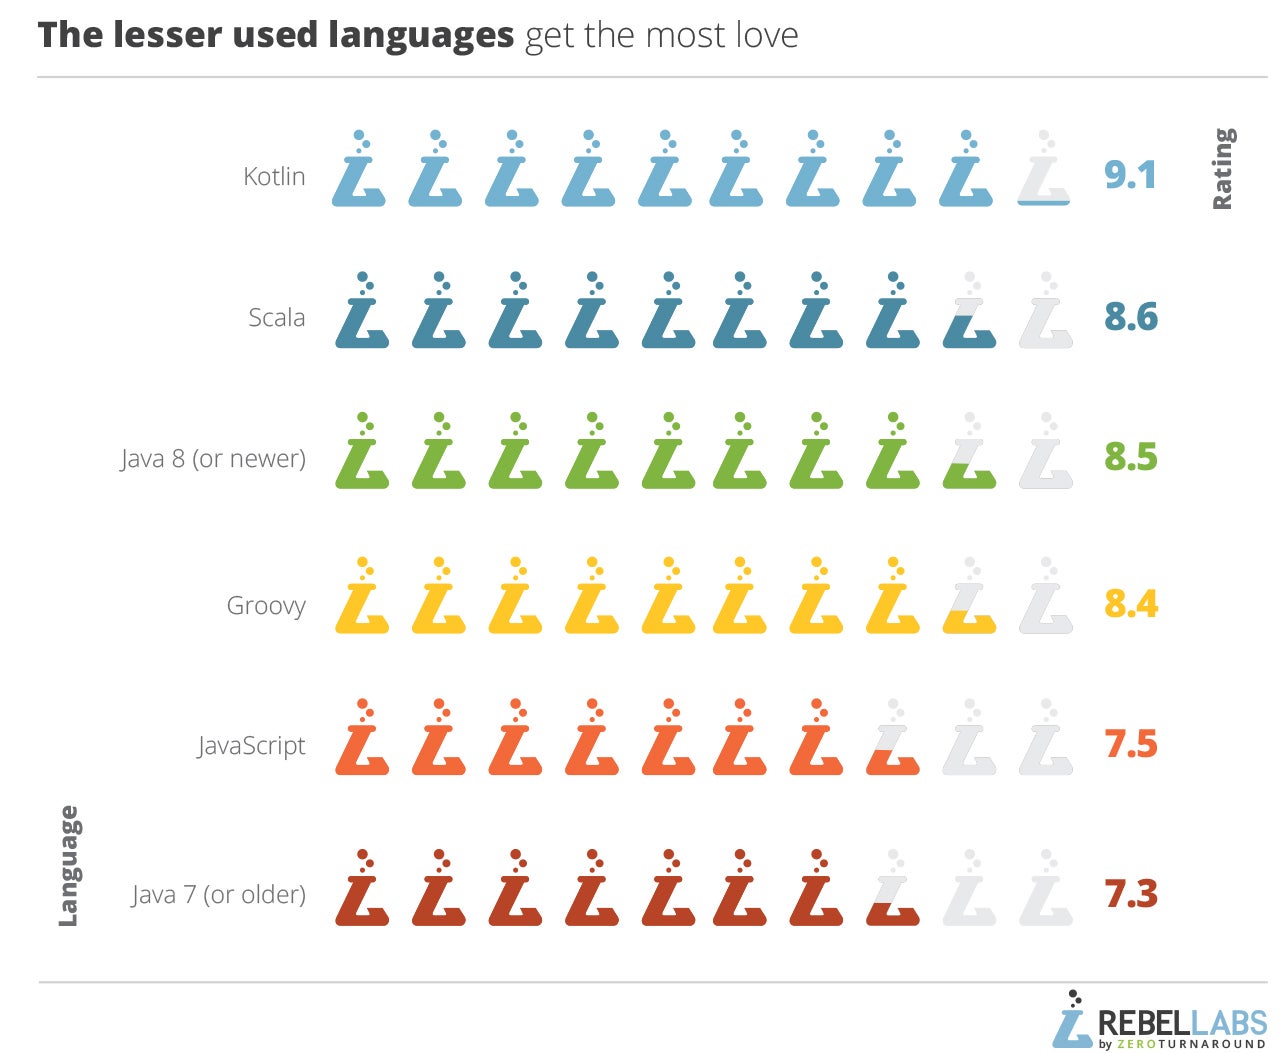
When we turn to the programming languages, we see a very similar picture. At the bottom of the picture is the undead Java 7 and older, with a pretty good score of 7.3 (out of 10). What's surprising, JavaScript ranks better than that, with a satisfaction score of 7.5. It ends up avoiding the last place, which is a shock given the amount of public outcry about its terribleness. Perhaps, people who use the language aren't as volatile as those who tried it just once.
Congratulations to Kotlin on taking the first place with the highest satisfaction score of 9.1 (highest across the whole report, not just the programming languages question)! Allegedly, Kotlin is the language you want your Java to be like, and it seems that developers who use Kotlin are really happy about the design choices made by the Kotlin team. Well done, JetBrains!
The application stack is something quite internal to the system you're building. It supports your code and runs it, in an unfortunate manner not unlike the system administration people: when everything's great, they're invisible, but once something catches fire, you get furious at why stuff isn't working. Enough with the sentimental tangents. Spring stack has the highest satisfaction score of 8.2 (out of 10) and tops the rating list.
The reactive stack, where we joined Play Framework, Lagom by Lightbend, and Vert.x since the principle of being reactive is more important than the implementation, follows as a close second with the average satisfaction score of 8.1. Surprisingly (yeah, we all live in a Twitter bubble sometimes), Java EE is very close at 8, and in general, almost any approach has a decent score except for the in-house tools.
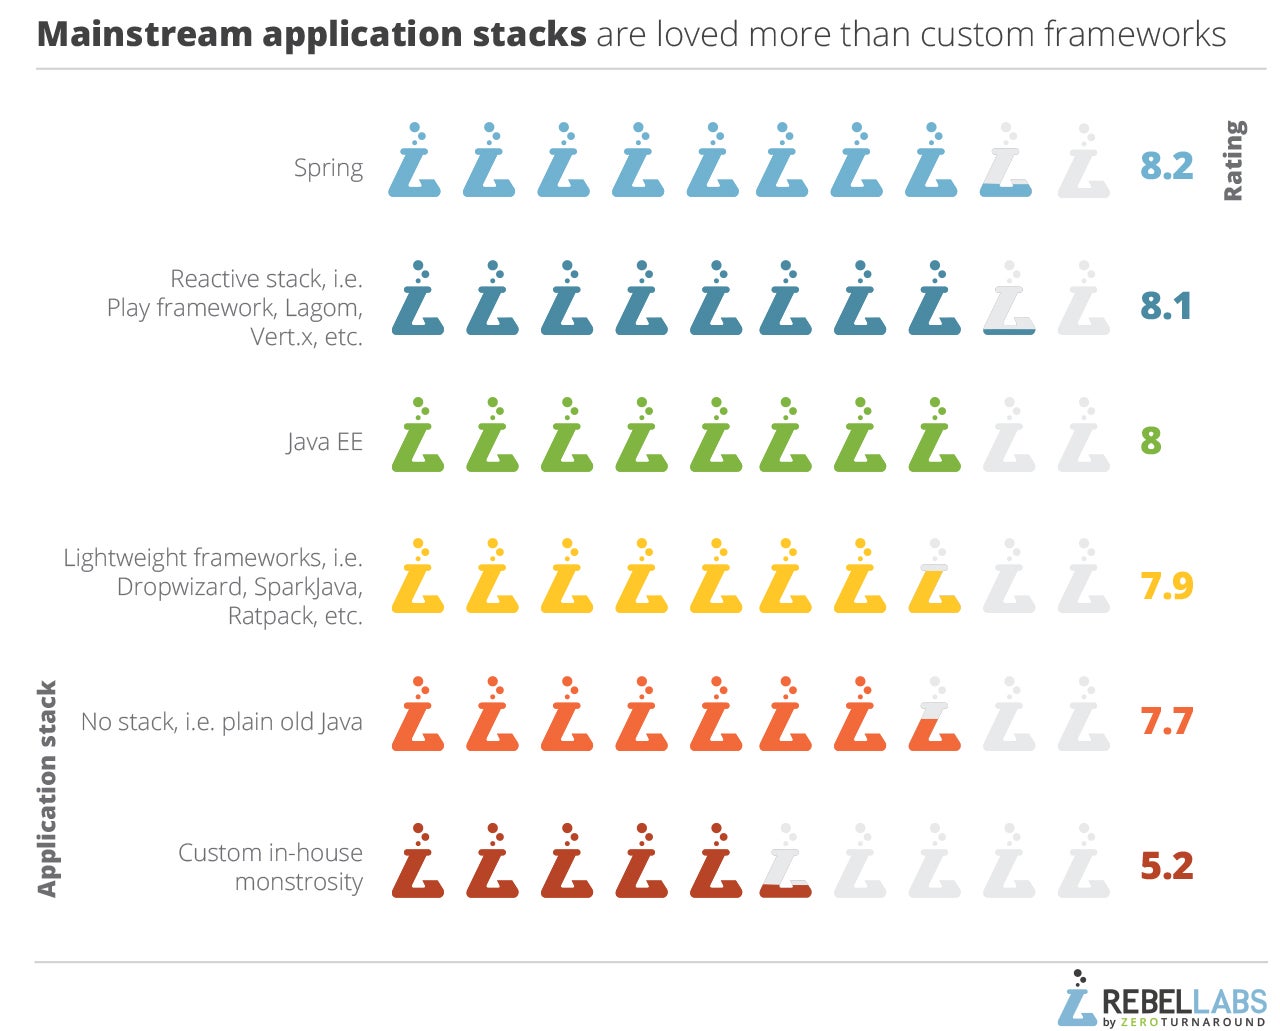
To be honest, there can be a good reason for that. Besides the fact that writing good frameworks is hard, and open source ones are typically better at being reasonable than in-house developments. We phrased the answer unfortunately: "Custom in-house monstrosity," and we're sorry to admit that this attitude might have contributed to it getting the lowest score of 5.2.
How satisfied are you with the architecture choices in your main project paints an interesting picture: the less you need to worry about your architecture, the more you like it.
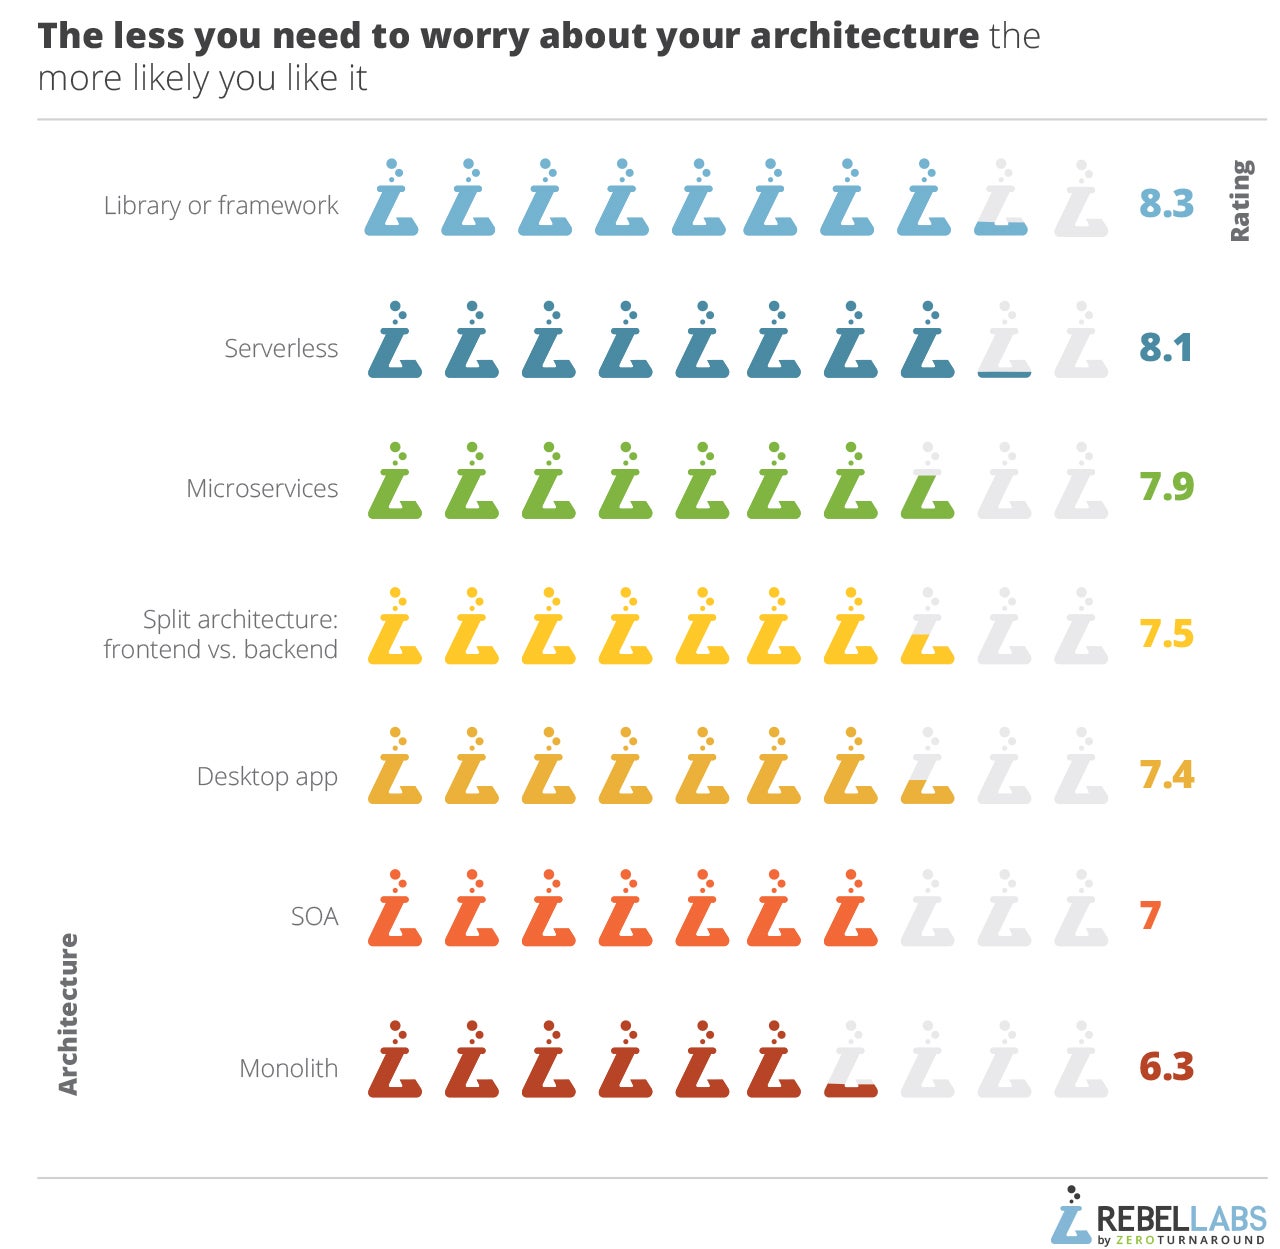
The top spot is occupied with the libraries and frameworks with a solid 8.3. Indeed, shipping a JAR file is straightforwardly "web-scale" and the internal architecture is much easier than in a full-blown app with analytics, monitoring, custom aspect advice, and so on. Next, we got serverless and microservices architecture with 8.1 and 7.9 respectively. At the bottom of the satisfaction table, we find the monoliths with 6.3. Still better than terrible.
Databases are perhaps the most unfortunate to be unhappy with. It's probably the most expensive to switch, rarely an easy task, and the gains can be dubious. Remember Uber moving to and from MySQL in the span of a few years? When you're not satisfied with your database—too bad, it's probably going to stay that way.
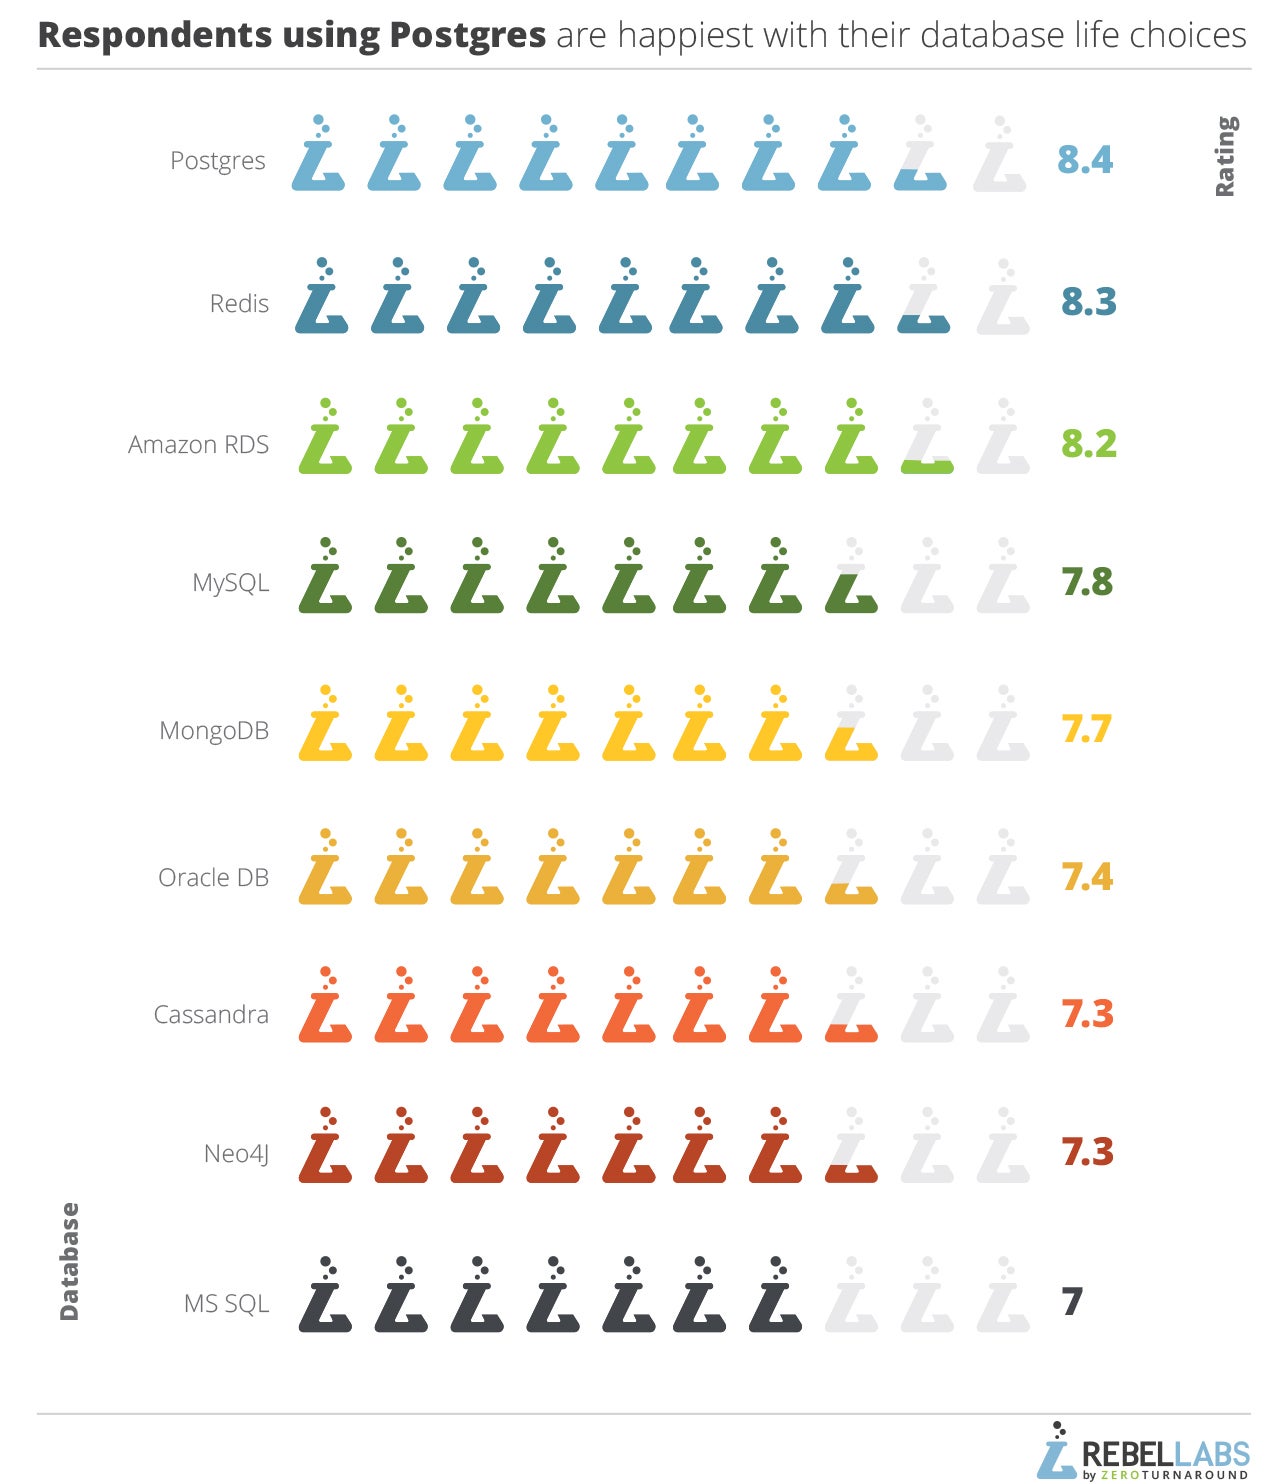
Postgres takes the top spot with a satisfaction score of 8.4 (out of 10). Redis is a close second with 8.3. What’s surprising: niche solutions like Neo4J, or Cassandra in some sense, received lower scores than very popular solutions. I would have guessed that when picking up a niche tool, you do it because it's the best and you'd be happy with it. Apparently, every technology has their caveats.
Why Do You Use the Java Tools You Use?
Now, we're through with the popularity and the usage statistics. Let's turn our attention to the second big question of the report: why do you use the tools you use?
Let's start with the IDEs. From there we will continue in the familiar order. The reasons that were provided as potential answers for the IDEs: functional superiority, existing knowledge, budget, and company or project requirements.
One readily apparent result is that 91% of people using IntelliJ IDEA do it because they consider it functionally superior to everything else! On the one hand, it's probably a fair statement. After all, before buying software, you'd evaluate the competition. On the other hand, we tip our hats to JetBrains, which made an excellent product and convinced their user base that it is better than everything else functionally. Educating users is a notoriously hard task, especially when the alternative doesn't require a credit card!
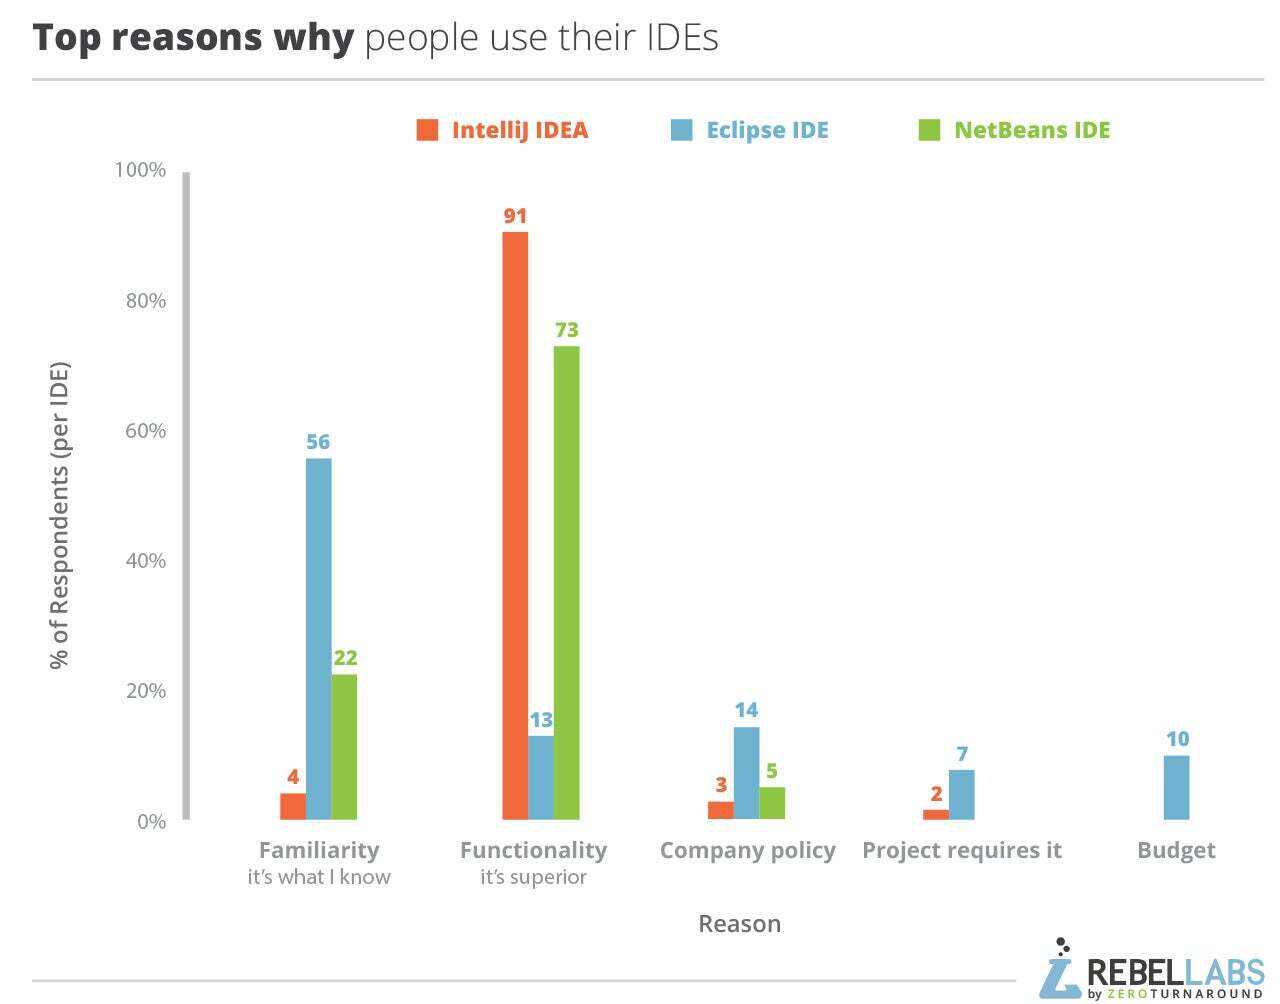
The main reason why Eclipse IDE developers prefer their IDE (56%) is the familiarity. It is better to know your tools well rather than having a sophisticated tool that you cannot properly apply to solve problems. Allegedly, it can be a bad place to be in, as it's people's inertia which is keeping them using Eclipse IDE rather than because they think it's the best. Perhaps this is the reason why the downward slide exists. Notably, 73% of the NetBeans IDE users also use it because of the functional superiority. It might be confusing since both IDEs cannot be functionally superior at the same thing at the same time. However, we believe that either both parties compare their favorite IDE to Eclipse IDE, or just work on different problem domains.
Developers love to hate programming languages they don't use frequently. They sometimes even hate the ones they use all the time. One thing is clear: most developers use the languages they consider functionally superior.
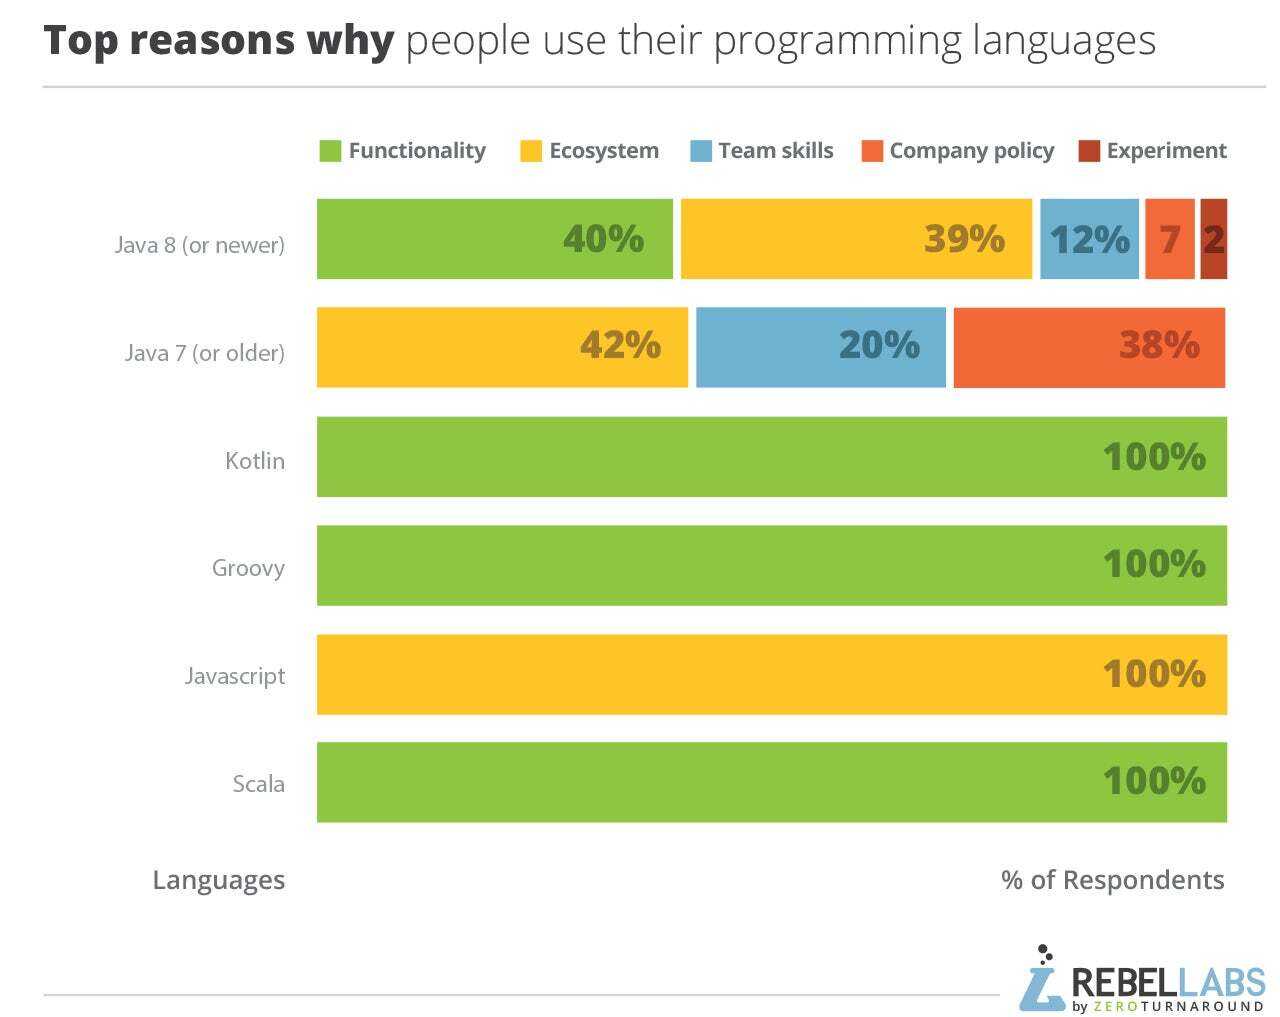
When we talk about building a team of people who can create and maintain a project, Java is the top choice: 1 in 5 developers working on Java 7 and older does it because the team knows those best. Company policies and frozen project requirements often slow down the progress, 38% of people using Java 7 (or older) do it because it is required by the project or the company.
The alternative JVM languages are used because people clearly love them, everyone who chose Kotlin, Groovy, or Scala as their main programming language, said that it's because they are superior to everything else. JavaScript paints a different picture, no one declared it to be functionally superior, but everyone loves the community and how vast the JavaScript ecosystem is.
When we look at the reasons why developers chose to use a particular application stack, a different pattern emerges. Apparently, very many projects require a specific application stack. Project requirements top the reasons to use lightweight frameworks (51%), it is high for the Reactive stack (31%), dominates the reasons not to use any stack (64%), and is high for custom in-house implementations of the application stack (42%). The latter only has two reasons to be used, the more frequent of which is company policy.
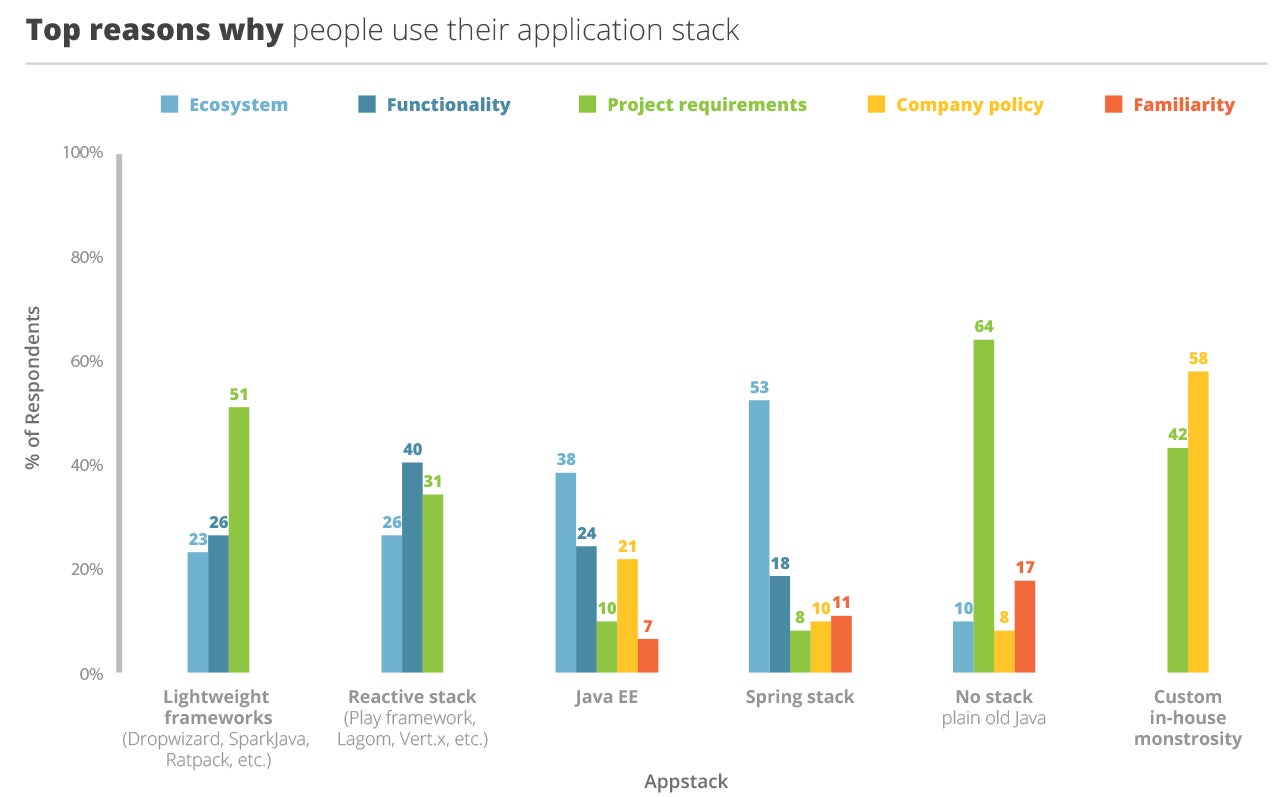
The most frequently used stacks are Spring and Java EE. Both have respondents voting for all kinds of reasons, but ecosystem trumps everything else in both cases. However, 38% of Java EE users and 53% of those using the Spring stack know that the requirement will change— they have the integrations, libraries, and existing components to help them.
Talking about choosing something as important as the architecture of your projects is never easy. It seems that there is the right answer to the question "Why did you do it this way?" and it comes with the famous answer "It was reasonable at the time." Now, if after some time the choice still kind of makes sense, the answer becomes "The architecture was suitable for the problem." If it doesn't, it's legacy code. Considering the above, the results about architecture reasons aren't especially revolutionary. Most architectures are chosen because they solve the problem well. You can notice a couple of interesting bits though. 14% of projects running on microservices architecture chose this because of the hype. Perhaps it was an experiment to see how it would go.
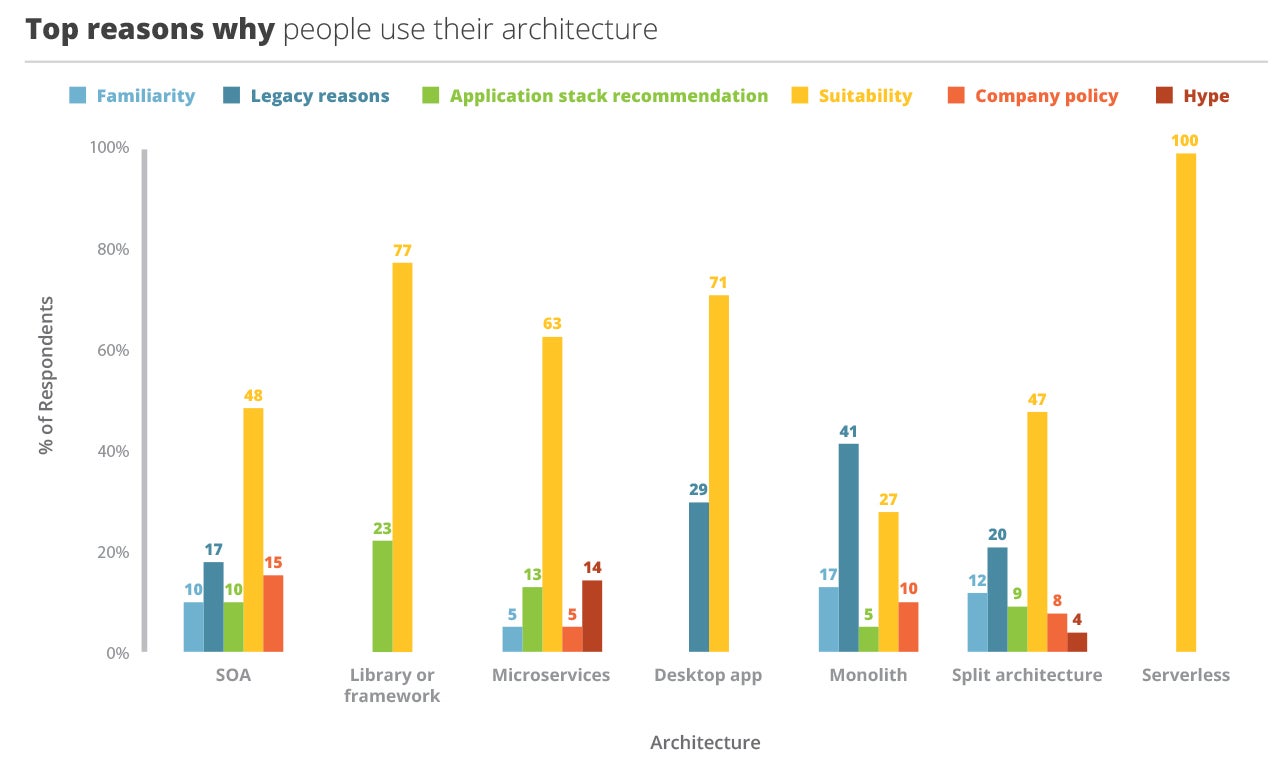
Still, the hype is certainly a somewhat lacking argument for choosing software architecture. Another good find is that the desktop apps and monoliths don't seem to be suitable for the projects that much. 29 %and 41% of their respective votes state legacy reasons as the main driver behind the architecture choices. Split architecture (frontend/backend) is also quite high with legacy (20%).
Is Change Simple?
We've gathered more information than we can explore in this report, so we're publishing only the most important or telling results.
When building the survey, we thought that it is reasonable to ask people who are not satisfied with the tools they use (less or equal to 5 on a 1-10 scale), why don't they move to something else. For some tools, this didn't make much sense: for example databases. No one changes a database on a whim. It's either a fixed requirement or would cost a fortune to replace. However, we'd like to look at the IDE choice and the application stack. Both are closer to the development team than the whole organization, and perhaps one could change this with a reasonable time and price scope.
Why don't you change the IDE when you're not happy with the current one? 19% of developers say there's not enough money in the budget. This most likely means the desire to move to the Ultimate Edition of IntelliJ IDEA, the only one of the big three that requires you to purchase a license. 18% (almost 1 in five) prefer racing on square wheels, they know it would be better, but for some reason, they cannot find time to finalize the move. There can be valid reasons for that, a large team that would need to move simultaneously, constant firefighting with production issues like in a classic devops nightmare.
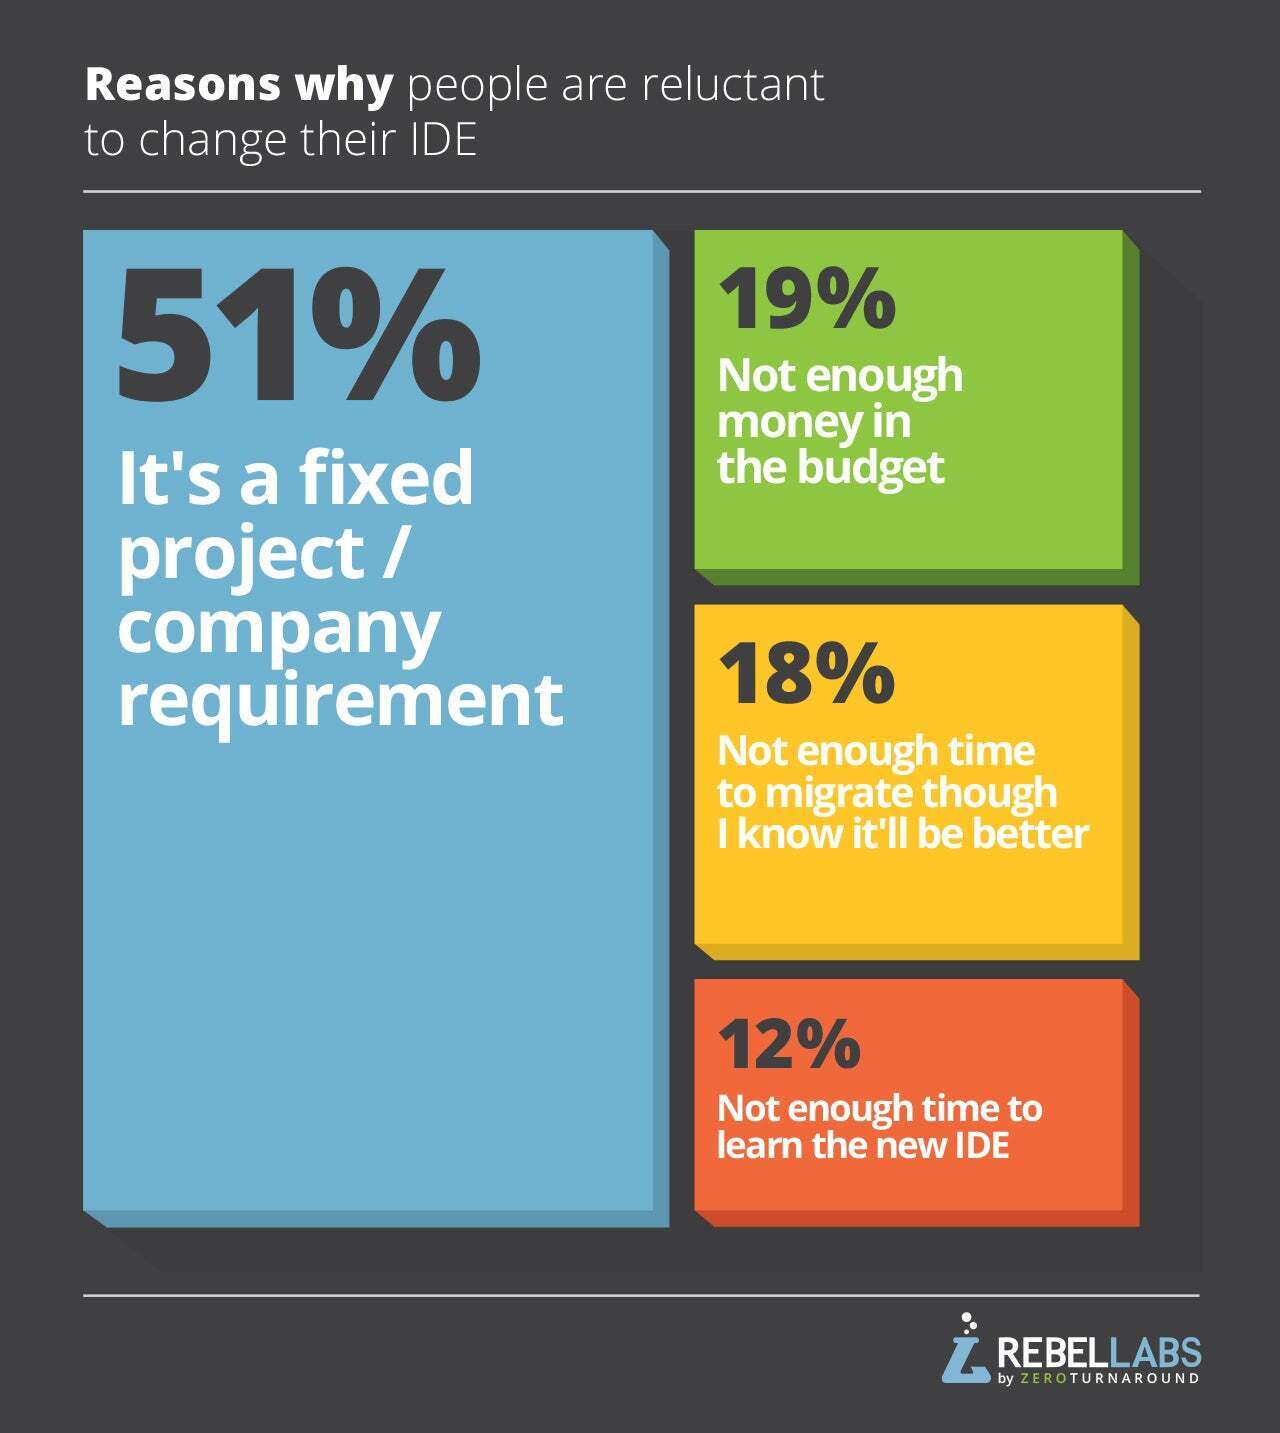
Another 12% don't have time to learn using another IDE altogether. Together this makes 30% of the developers who're struggling with their current IDE choice, but don't have time to change it. If you recognize yourself here, perhaps you should check out JRebel, shameless plug. They say it saves you time while you develop your applications and maybe you'll reinvest that into learning a better IDE. If you do, please write to me, I'd be over the moon to hear your story. More than half of the developers unsatisfied with their IDE, 51% to be exact, are stuck in it due to their company requirement.
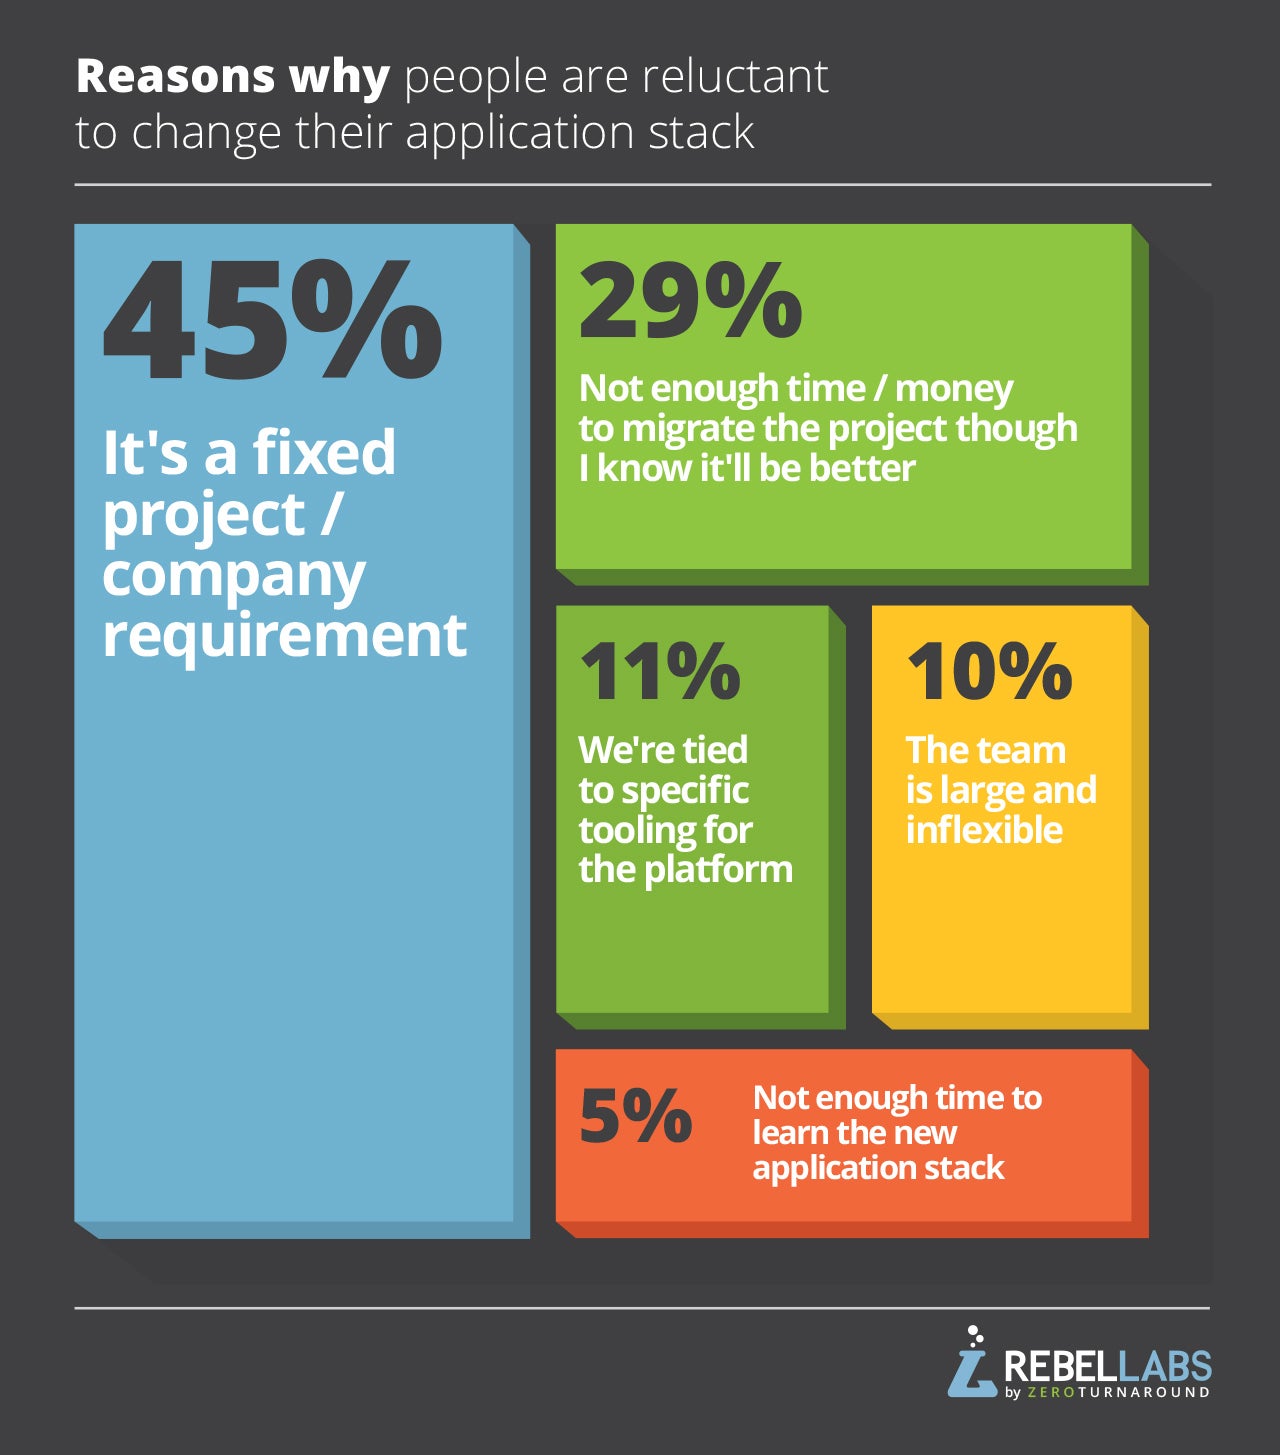
The picture with the application stack is quite similar. Almost one-half (45%) of the unhappy users say that it's a requirement and they cannot change it at will. 29% recognize that it's a trade-off and state that there's no time or money to change the stack they use. The good thing here is that only 5% of the respondents say there's no time to actually learn the new stack.
Are DevOps and Performance Just Words?
On top of the structured questions about the tools Java developers use and why they use them, we included a couple of questions about the ever important, but confusing areas of software development: performance work and DevOps.
First, we asked the developers to assess how they do DevOps. We gave them a choice of answers which form a scale: from not being good at communication between the development and the operations teams to thinking about implementing DevOps, to saying that they have the DevOps culture in place.
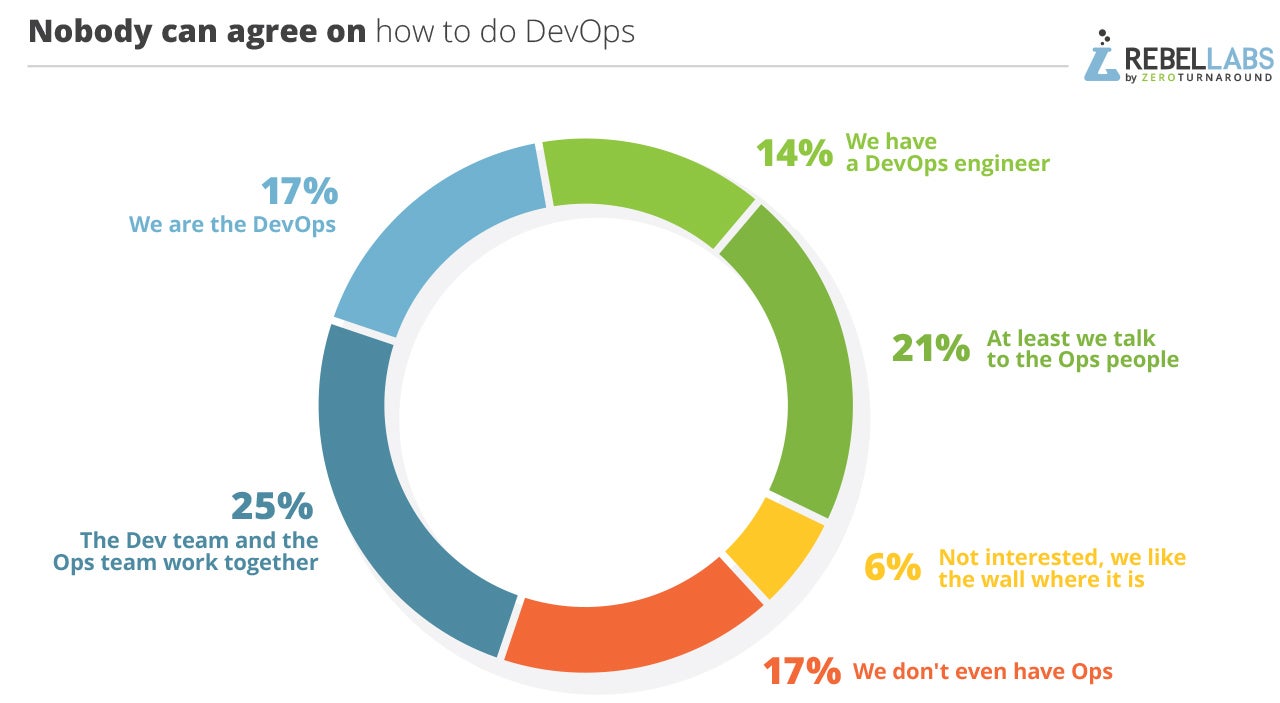
One thing that you can notice is that 14% have a DevOps engineer. Highly confusing for everyone because DevOps is a cultural setting where the Dev team and the Ops team share responsibilities and help each other. It's left rather unclear how a single person could engineer it. A quarter of the respondents say that the teams work together, and 17% proudly say that they are DevOps.
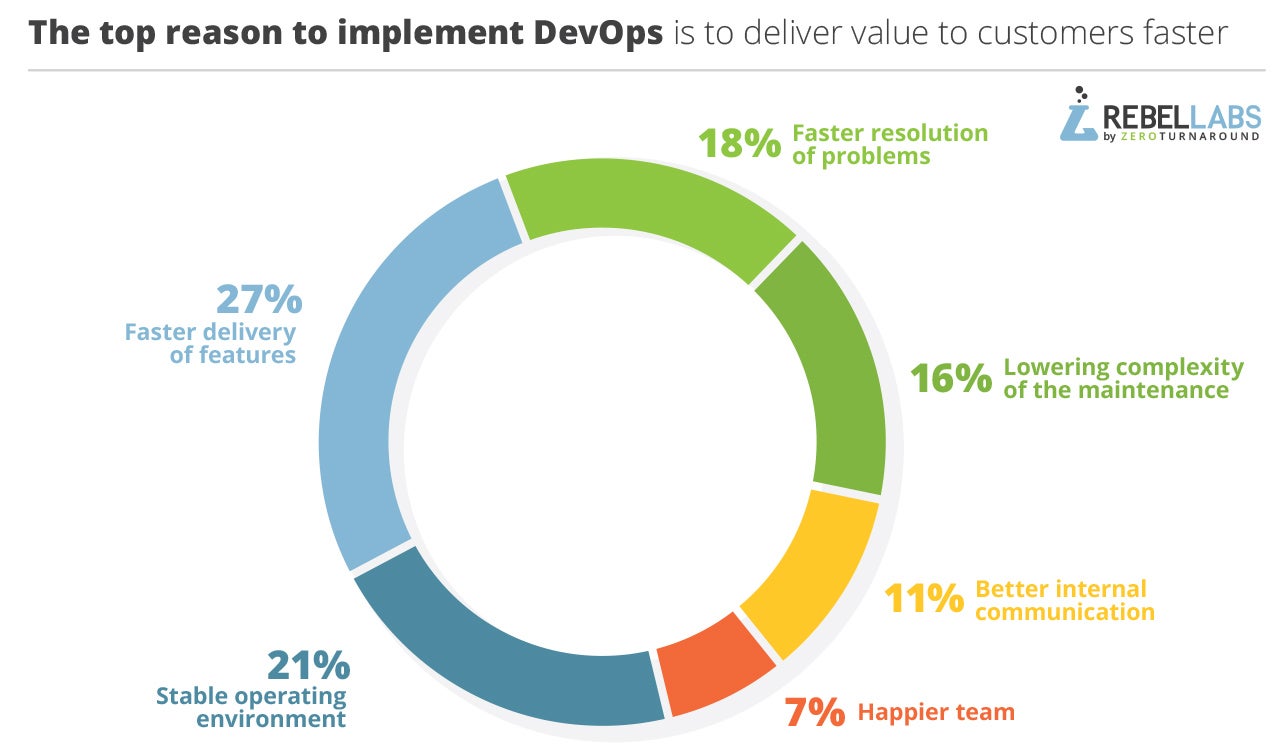
Next, we asked what was the main reason to implement (or why they would want to implement) DevOps. The top 3 reasons are: to deliver new features to the users faster (27%), having a stable operating environment (21%), and third, a faster resolution of production problems (18%).
One could argue that at least some of these goals can be achieved by properly setting up monitoring and continuous delivery pipelines through development, CI, staging, to production environments. And thus the teams don't need to get into the full metal DevOps mindset. But perhaps, going DevOps is the way to agree on how to implement the pipelines that tie together development and production environments.
The next mystical element of software development that we know is hard is caring about the performance of your code. It is interesting enough to warrant us dedicating the whole Developer Productivity Report 2015 to it, to figure out how teams do performance work, what tools are used to monitor the production, what profilers they prefer, and so on. Now, two years later, we asked what's your attitude toward performance work. The answers also represented a scale, and we asked to pick the most specific suitable answer.
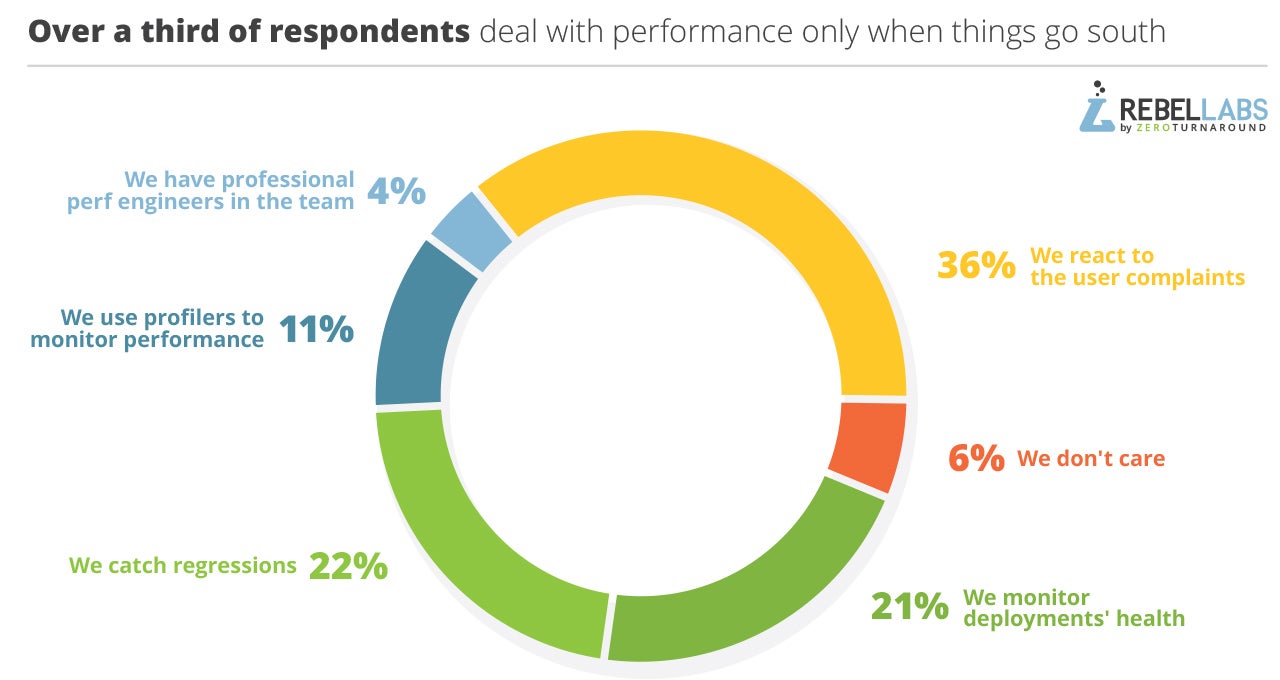
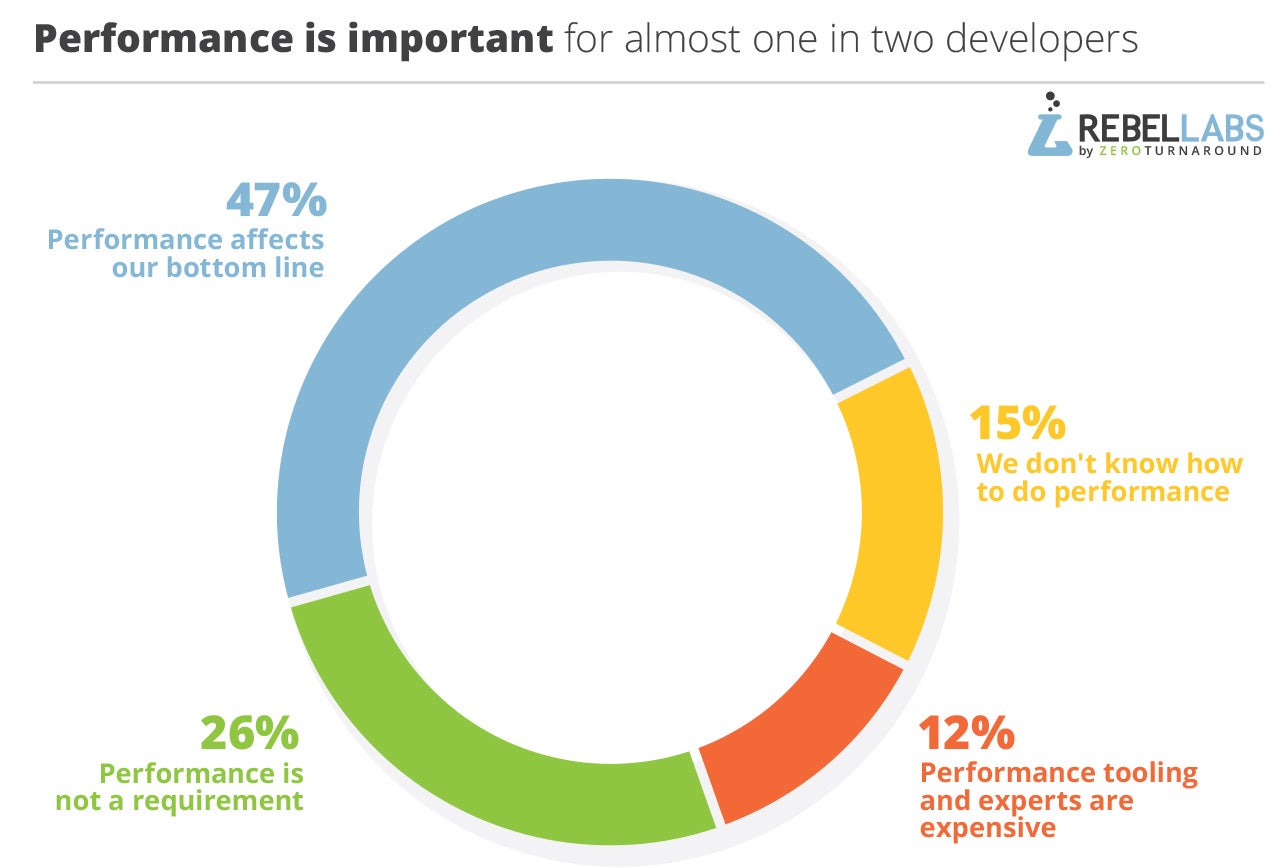
Sadly, 36% of the respondents said they only react when the users are complaining. 21% use some monitoring tools to find out when the application gets slower in production. 22% have some load tests to test the changes before they take down the production sites. The picture painted by this result is quite sad. When answering why they treat performance this way, almost half (47%) say that performance directly affects their bottom line project or company. These are the caring engineers. 26% do not care about performance because it's never a requirement. Perhaps when everything is painstakingly slow, it's time to react, but otherwise—why bother.
What is surprising, when asked why do they do performance work that way, 12% say tooling and experts are too expensive to properly care about the performance. 15% say they don't know how to approach the problem.
If you share this opinion, perhaps you could take a look at XRebel — the real-time performance analytic tool for development and testing. It’s a decent starting point!
Do We Stand a Chance?
All in all, we see that across the board, developers are satisfied (around seven point something out of 10) with their tooling choices. What about when we ask them directly?
Do they feel they are productive, does the technology support them well, and is the path forward clear?
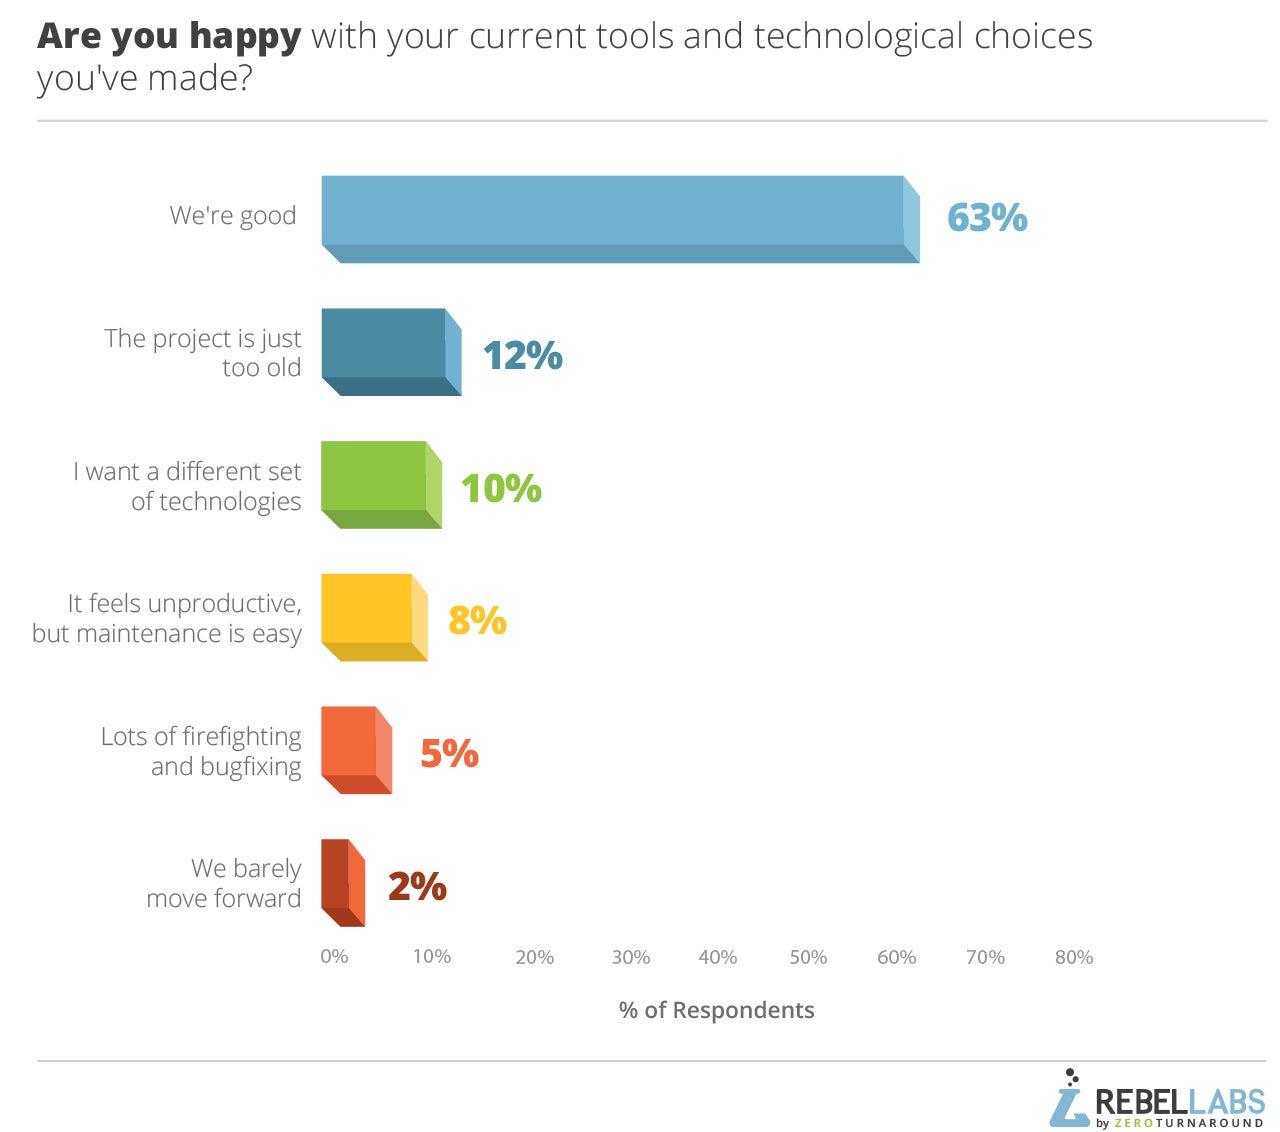
Indeed, most of our respondents said that they are good (63%). Some (12%) see the root of their problems in the inevitable age of the project they work with. Only 1 in 10 recognize that they need to change the tools they are working with. Approximately the same amount of people (8%) made a conscious choice to make maintenance easier.
When we look at the factors that seem to hold the teams back the most, the bottlenecks, the picture is a bit different. We know developers love to say that their IDE makes them super productive. Thus, everyone who uses other IDEs must be way less productive, right? We asked what is the biggest bottleneck preventing the improvement which would lead to the largest boost in productivity.
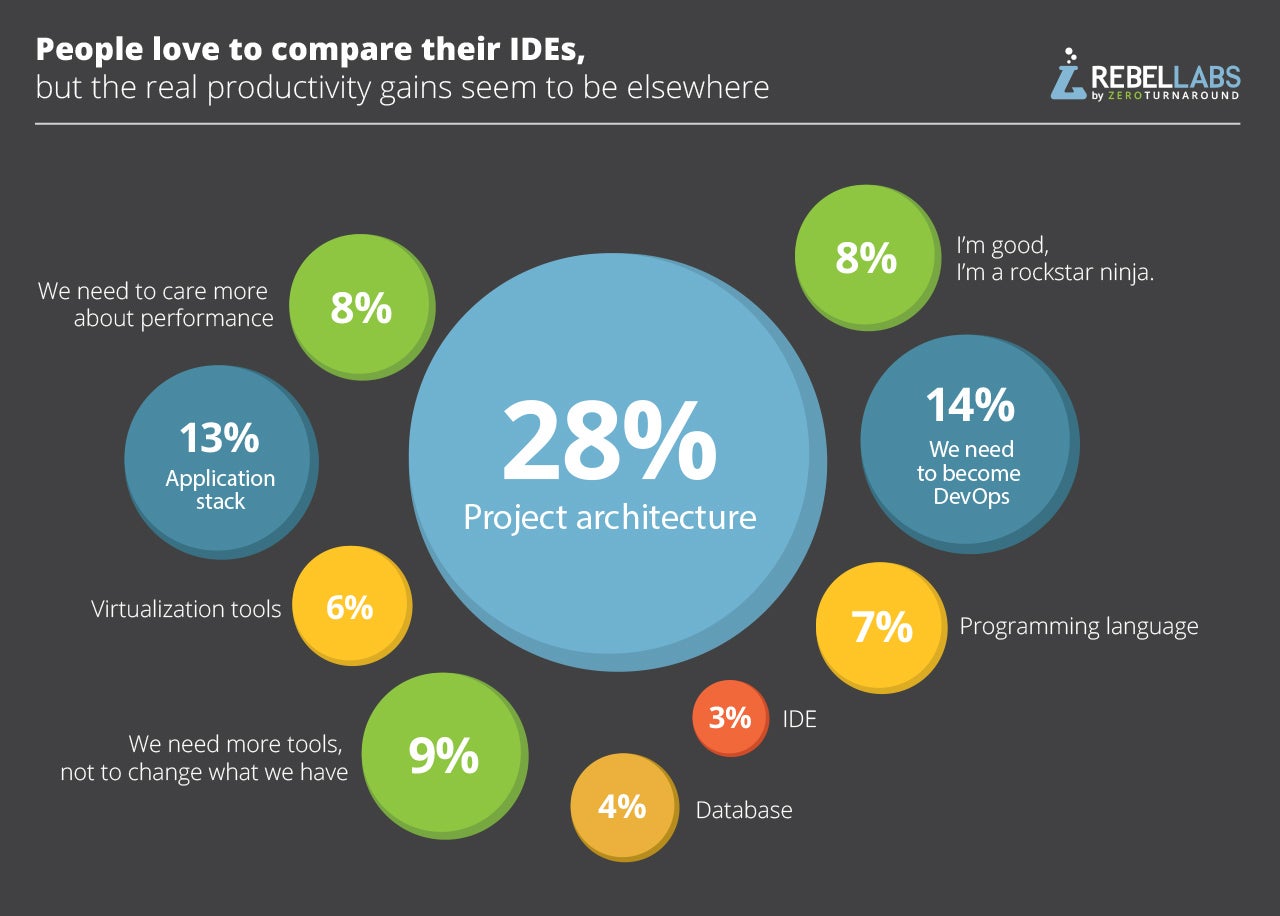
Not surprisingly, large things that are harder to change come first. 28% think the architecture of their project requires a revamp. What is surprising is how actively developers consider the lack of DevOps is holding them back. 14% said becoming DevOps would give them the largest boost. If you remember the reasons to implement DevOps, we can speculate that they want a fully functioning continuous delivery pipeline to faster ship features and bug fixes. 9% have chosen their tools well, and just need to find time or budget to add other tools. Only 3% of respondents think changing their IDE of choice would give them a major productivity boost. That's fewer than who think the database holds them back.
Fun Java Tools Trivia
There are plenty of ways to pivot the data and see how the choice of architecture changes what can give you the largest productivity boost—or why people hesitate to change the architecture when team size is too large. However, a comprehensive overview of the questions like that would take up too much text for a somewhat predictable outcome. No one is changing the architecture because it's expensive and requires a revamp of the project. The same goes for the databases. We've made the data gathered from the survey public this year. If you're interested in more specific questions, for example: what other choices people who use NetBeans make, take a look at the data. In the meantime, here are a couple more interesting observations from the data.
In which countries are the developers happiest with their tooling choices? To answer this question, we averaged the averages for IDEs, programming language, application stack, project architecture, and databases by the countries the respondents indicated.
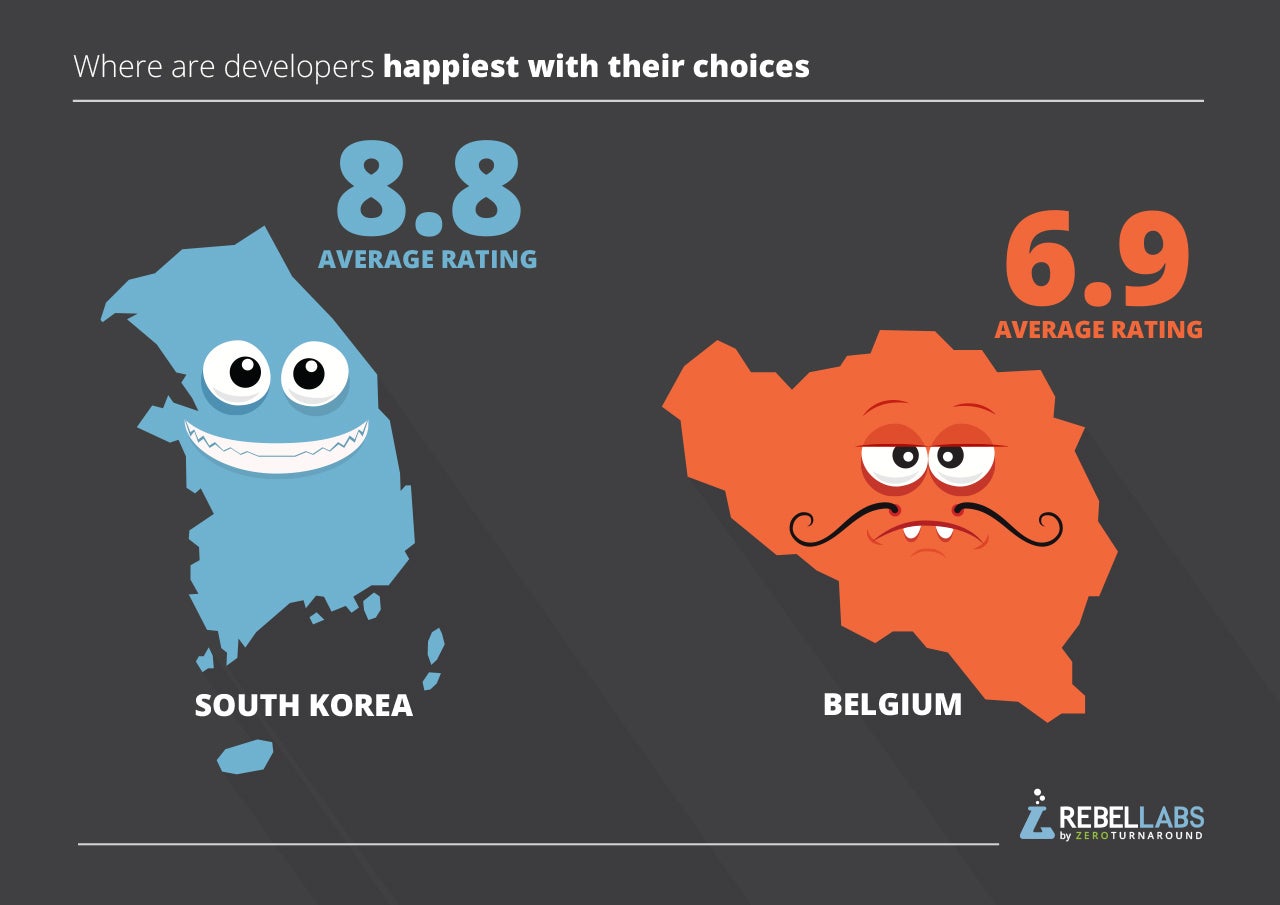
The highest average of averages of the rankings, at 8.8 out of 10, belonged to South Korea! The lowest—Belgium. There's absolutely no information to explain why this is the case*. But it’s fun to speculate, so here goes! Belgium is a home of Devoxx, one of the most prominent and largest Java conferences ever.
The excellence of the content at Devoxx sessions can only compete with the mediocrity of their lunch sandwiches. Perhaps being exposed to people showing their amazing tools and explaining how to develop things properly made the respondents from Belgium to feel less satisfied with their current tools of choice.
Another piece of analysis we found interesting — if slightly predictable — is about how happy developers are in teams of different sizes. So, similarly to the example above, we averaged the averages of the ranking for tools by team size. Here's what we got: things don't get that much worse as team size increases.
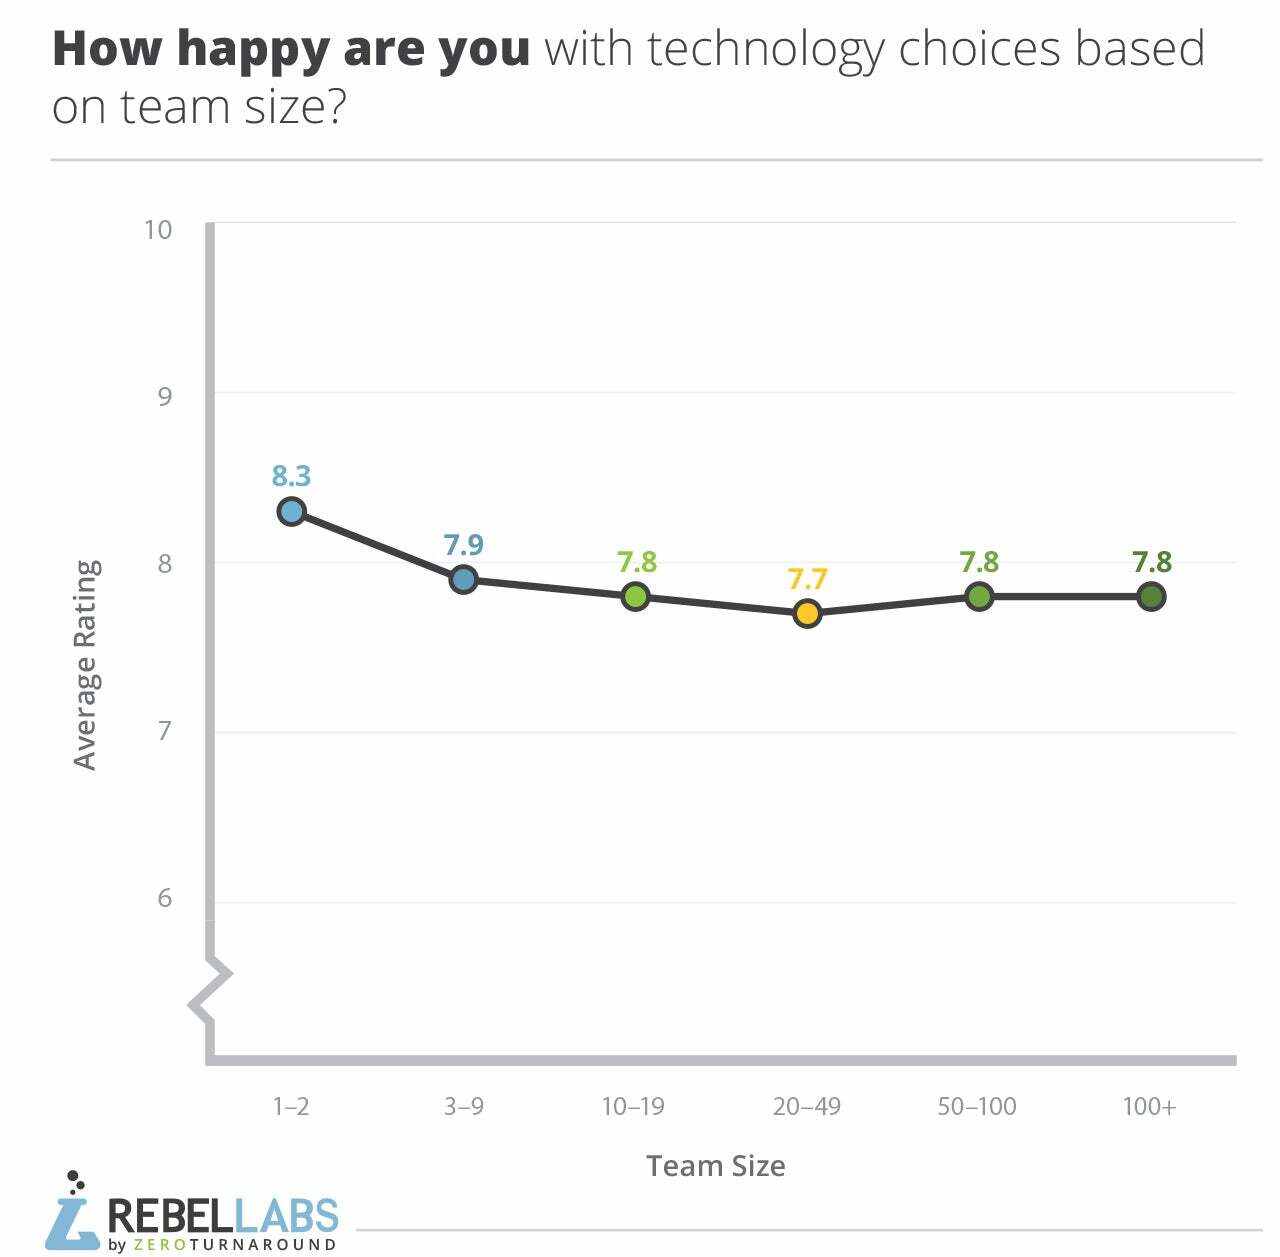
The takeaway here is: in a smaller team it's easier to make smart choices about the tools 7.9 that will keep everyone happier. But if you go with something mainstream, even in a very large team, you won't get riots.
And now, to sum up, let's consider what technologies are thought of as exciting by developers.
We asked in the survey: what tool, technology or library are you super excited or proud about having used or planning to use in 2017? It was an open text question where anyone could write about the greatest, most fascinating technology they're working with.
We processed this data thusly:
- Split the entry by "," and ";"
- Lowercase all text
- Replace all synonyms with the most generic term, say "Java EE 8" with "Java EE," or different versions of Spring Boot were merged into just "Spring Boot."
Then, we counted the frequencies of the mentioned technologies and got our semi-scientific list of results. Since we already had the data from last year, we could see what technologies emerged as exciting just recently, as well as the trends. 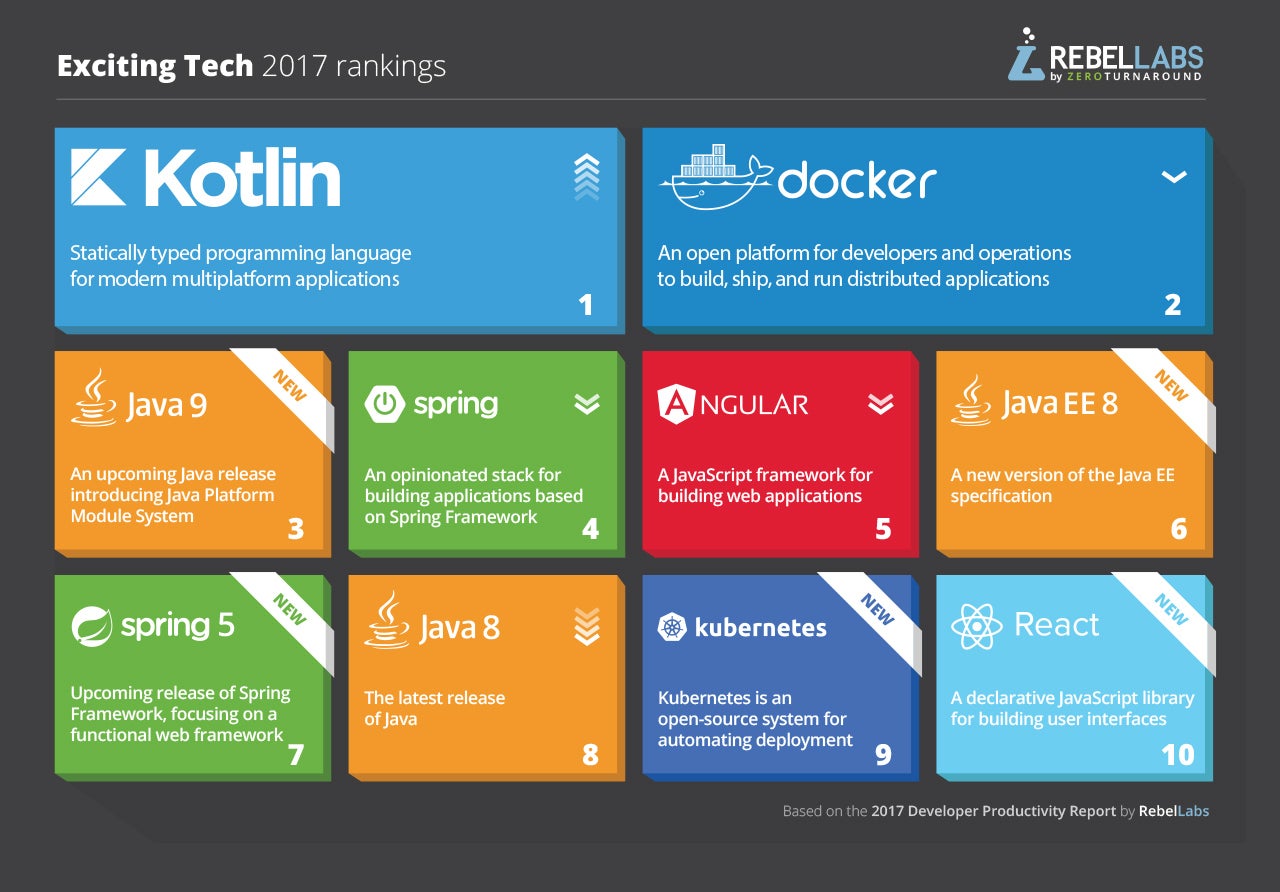 Congratulations to JetBrains and Kotlin teams! You've done a great job! Kotlin is currently indeed one of the most exciting pieces of technology, both on JVM and Android. Let’s hope it has a bright future for many, many users!
Key Findings
Yeah, you've done it! Or maybe just scrolled to the bottom to see if there's a summary that doesn't take 30 pages of text. Anyway, congrats on making it here. In this short section, we summarized the most important results of the report.
- IntelliJ IDEA is the most popular Java IDE at 54% with the respondents.
- NetBeans IDE users are the most satisfied by it, giving it a ranking of 8.8 (on a scale from 1 to 10).
- Java 8 adoption continues to grow, almost 72% of the developers said their main programming language is Java 8.
- 47% use Spring as the application stack.
- 33% use Java EE.
- Split architecture with separate frontend and backend is the most popular at 34%.
- Microservices architecture almost caught up with the monoliths — 23% and 25% respectively.
- The most popular databases are: OracleDB with 33%, MySQL with 24% and Postgres with 22%.
- The most popular noSQL data store is MongoDB at 6%.
- Kotlin is the most loved programming language with a satisfaction average of 9.1 (out of 10).
- Spring is a good application stack with an average satisfaction ranking of 8.2.
- The satisfaction with custom in-house application stacks do not rank very high (5.2 out of 10).
- Respondents using Postgres are the happiest with their database choice: 8.4 (out of 10).
- The main reason to use IntelliJ IDEA and NetBeans IDE is said to be "functional superiority". 91% of IntelliJ IDEA users and 73% of NetBeans IDE users say so.
- 56% of developers using Eclipse IDE say it's because they are familiar with it and know its tricks.
- Only 19% of unhappy developers don't change their IDE because of the financial cost. 18% want to migrate and know it'll be better, but don't have time.
- The most popular approach to DevOps is "the Dev team and the Ops team work together" at 25%. 17% claim to be the DevOps, while 14% say they have a DevOps engineer.
- The main reason to implement DevOps is to deliver features to the customer faster, at 27%.
- 36% of developers react to user complaints rather than testing performance upfront.
- 47% of respondents say performance directly influences the bottom line of their project.
- 15% don't know how to properly take care of application performance. 26% don't even have performance as a requirement.
- 63% of respondents are happy with the technical choices they made.
- Project architecture is the most common bottleneck in development productivity. 28% said changing it would give the biggest boost, more than changing anything else.
- Only 3% of respondents see changing IDE being a key to their productivity problems.
- Kotlin is the most frequently named technology people are excited about and happy to work with.
In this report, we tried to investigate what tools Java Developers use and why they chose them. The data for this analysis was gathered in a public RebelLabs survey. We received about 2060 responses. The report is focused on 5 categories of tools: IDE, programming languages, application stacks, databases, and project architectures. We were also curious about why people want or avoid implementing DevOps culture in their teams and how do they approach questions about application performance.
All in all, the survey showed that developers are happy with the tool choices they've made. While there are differences, they are not always as pronounced as one would hope to make an easy and clear-cut choice of the best technology to use. Here's an xkcd comic to make you ponder whether you should switch some of the tools you're using for the better ones.
And be sure to grab the pdf version of the report. It’s beautiful, it’s easier to read, we’ve put quite an effort into it! Check it out:
Recommend
About Joyk
Aggregate valuable and interesting links.
Joyk means Joy of geeK