

理解高斯混合模型中期望最大化的M-Step
source link: https://my.oschina.net/u/4611803/blog/4871010
Go to the source link to view the article. You can view the picture content, updated content and better typesetting reading experience. If the link is broken, please click the button below to view the snapshot at that time.

在本篇文章中将解释高斯混合模型(GMM)的关键部分背后的数学原理,即期望最大化(EM),以及如何将这些概念转换为Python。这个故事的重点是EM或M-Step。
注意:这不是有关端到端GMM算法的全面说明。要进行更深入的研究,请参阅我们以前翻译的文章。
期望最大化
GMM中有一系列步骤,通常称为“期望最大化”,简称“ EM”。要解释如何理解EM数学,请首先考虑您可能要处理的模型。
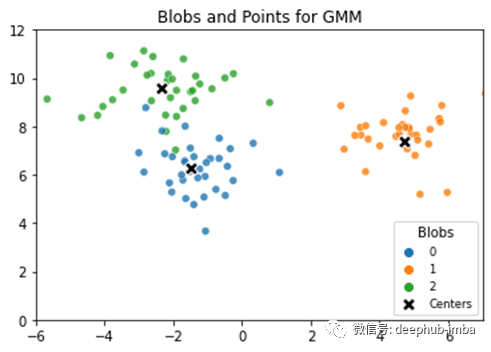
样本由图形上的点表示。这些点形成一些不同的斑点。每个斑点都有一个中心,每个点都与每个斑点的中心相距一定距离。给定GMM模型数据,目标通常是根据最接近的中心按其样本点标记其他样本。有些点距离一个或多个中心几乎相等,因此,我们希望基于某种概率来标记点。
EM用到的符号
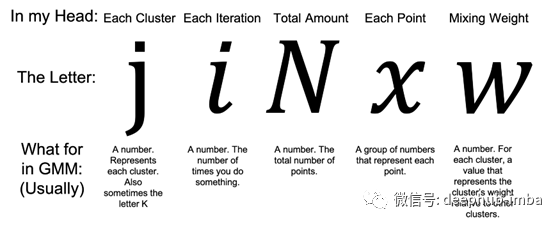
要学习如何学习机器学习算法,您一生中需要一些希腊语。因为算法中符号基本上都是以希腊文表示的。尽管可能会想掩盖基础知识,但是对单个希腊字母的简单掌握可以帮助您理解算法中的重要概念。
算法可能会令人生畏且令人困惑。例如,乍看之下,高度集中的希腊符号有时足以使人窒息。但是不要浪费时间,我们在这里只要考虑现在要使用的符号即可
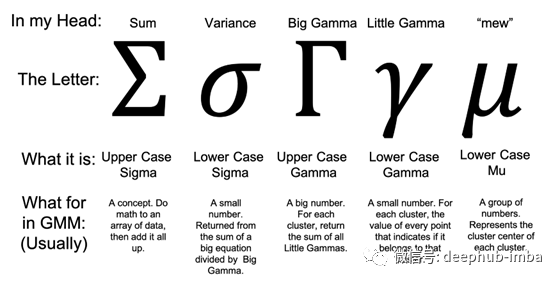
除此以外,我们也有一些英文字母在EM中代表GMM的意思。通常,英文字母围绕着希腊字母,就像小领航鱼围着大鲨鱼游动。就像小鱼一样,英文字母有一个重要的作用,它为如何解释算法提供了指导。
M-Step的数学解释
现在我们已经隔离了方程的每个组成部分,让我们通过检查M-Step,将它们组合成一些常用的数学短语,这些短语对于用EM语言进行对话很重要。
簇,高斯,字母J或K,有时还包括C:通常都是同一件事-如果我们有3个簇,那么您可能会听到“每个高斯”,“每个j”,“每个高斯j”或 “对于每个K组件”-这些都是谈论相同3个簇的不同方法。在数据方面,我们可以绘制(x,y)样本/点的数组,并查看它们如何形成簇。
 # a 2D array of samples [features and targets]
 # the last column, targets [0,1,2], represent three clusters
 # the first two columns are the points that make up our features
 # each feature is just a set of points (x,y) in 2D space
 # each row is a sample and cluster label

[[-7.72642091 -8.39495682  2. ]
  [ 5.45339605  0.74230537  1. ]
  [-2.97867201  9.55684617  0. ]
  [ 6.04267315  0.57131862  1. ] ...]
软分类(Soft Assignments),概率,响应度(Responsibility):聚类的一个主要思想是我们希望为每个样本找到一个数字,以告诉我们样本属于哪个聚类。在GMM中,对于我们评估的每个样本,我们可能会返回代表“每个高斯j的响应度”,每个“软分类”或每个“概率”的值。
这些阶段通常都是关于同一件事的,但响应度与概率之间存在关键区别。
 # an array of assignment data about the 2D array of samples
 # each column represents a cluster
 # each row represents data about each sample
 # in each row, we have the probability that a sample belongs to one of three clusters - it adds up to 1 (as it should)
 # but the sum of each column is a big number number (not 1)

print(assignments)
 # sample output: an array of assignment data
 [[1.00000000e+000 2.82033618e-118 1.13001412e-070]
  [9.21706438e-074 1.00000000e+000 3.98146031e-029]
  [4.40884339e-099 5.66602768e-053 1.00000000e+000]...]

print(np.sum(assignments[0])
 # sample output: the sum across each row is 1
 1

print(np.sum(assignments[:, 0])
 # sample output: the sum in each col is a big number that varies
 # Little Gamma: the really small numbers in each column
 # Big Gamma: the sum of each column, or 33.0 in this sample33.0
大写伽玛,小写伽玛,J,N,x和i:EM中的核心任务是为每个群集优化三组参数,或者“对于每个j,优化w(?),mew(? )和方差(?)。” 换句话说,群集的权重(?),群集的中心点(?)和群集的方差(?)是多少?
对于权重(?),我们将“大写伽玛”除以特征总数。从更早的时候开始,我们就知道每个聚类j的大写伽玛只是将给定聚类的每个样本的分配值相加的结果(该数字之和不等于1)。如下图所示
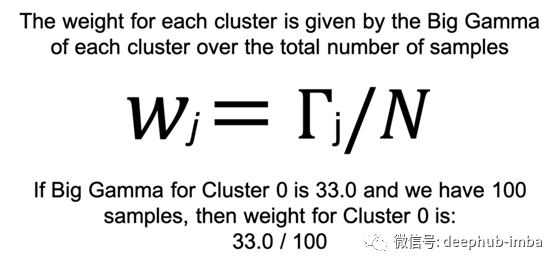
对于EM期间高斯的权重参数,请考虑一些简单的事情,例如添加数字列表,然后将其除以样本总数。
对于mew (?),不是像我们之前那样将所有小写伽玛加到一个小写伽玛中,而是对每个聚类j和每个样本i将小写伽玛与特征x进行矩阵乘法。如下图所示
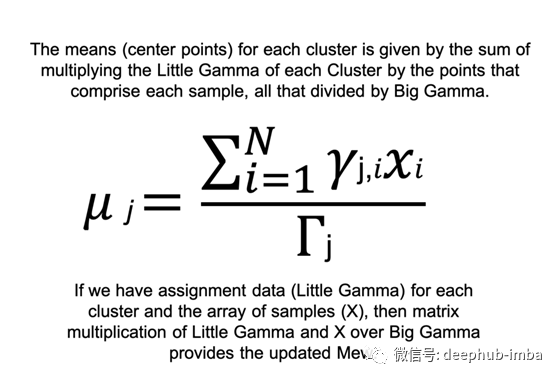
请记住,mew只是每个簇的中心点-如果我们有3个簇,而我们的样本都是x,y坐标,那么mew将是3个x,y坐标的数组,每个簇一个。
# for figure 4 - mew (mu)
# same array of assignment data as before
# each column is a cluster of little gammas
print(assignments)
[[1.00000000e+000 2.82033618e-118 1.13001412e-070]
[9.21706438e-074 1.00000000e+000 3.98146031e-029]
[4.40884339e-099 5.66602768e-053 1.00000000e+000]...]
# the little gammas of cluster 0 is just column 0
[[1.00000000e+000 ]
[9.21706438e-074 ]
[4.40884339e-099 ]...]
# same array of sample data as before
# the first two columns are the x,y coordinates
# the last column is the cluster label of the sample
print(features)
[[-7.72642091 -8.39495682 2. ]
[ 5.45339605 0.74230537 1. ]
[-2.97867201 9.55684617 0. ]
[ 6.04267315 0.57131862 1. ] ...]
# for features, we just need its points
[[-7.72642091 -8.39495682 ]
[ 5.45339605 0.74230537 ]
[-2.97867201 9.55684617 ]
[ 6.04267315 0.57131862 ] ...]
# if using numpy (np) for matrix multiplication
# for cluster 0 ...
big_gamma = np.sum(assignments[:, 0]
mew = np.matmul(assignments[:, 0], features) / big_gamma
# returns an array of mew
[[-2.66780392 8.93576069]
[-6.95170962 -6.67621669]
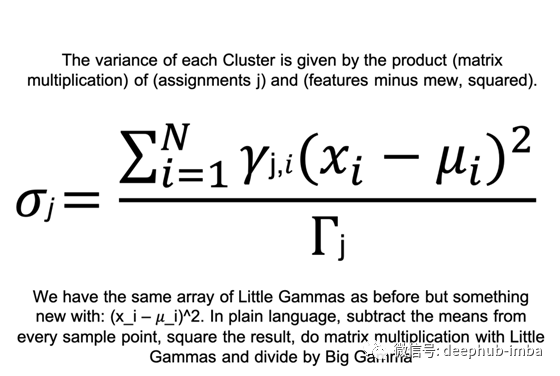
[ 4.49951001 1.93892013]]对于方差(?),请考虑到现在,我们有了点和中心点-随着方差的出现,我们基本上正在评估每个样本的点(每个i的x)到每个群集的中心点(每个i的mew)的距离。用EM语言来说,有些人可能会说“ x_i减去mew_i乘以Big Gamma j。”
 # for figure 5 - variance
 # a sampling of variance for cluster 0 of n clusters
 # given arrays for features and assignments...

x_i = features
 big_gamma = np.sum(assignments[:, 0]
 mew = np.matmul(assignments[:, 0], features) / big_gamma

numerator = np.matmul(assignments[:, 0], (x_i - mew) ** 2)

variance = numerator / big_gamma

# returns an array of variance
 [[0.6422345  1.06006186]
  [0.65254746 0.9274831 ]
  [0.95031461 0.92519751]]
以上步骤都是关于EM中的M-Step或最大化-所有关于权值、mew和方差的都是关于优化的;但是,初始赋值数组呢?我们如何得到每个样本的概率数组这是EM中的E-Step,也就是期望。
在E-Step中,我们尝试用贝叶斯规则猜出每个点的分配-这会产生一组值,这些值指示每个点对高斯的响应度或概率。最初会与猜测值(后验值)相差很远,但是在通过E-Step和M-Step循环之后,这些猜测会变得更好,更接近客观的地面真理。
GMM算法重复M-Step 和 E-Step直到收敛。例如,收敛性可能是迭代的最大次数,或者当每轮猜测之间的差异变得非常小时。希望最终的结果是,数据中的每个样本都有一个软分配的标签。
在这篇文章中,我介绍了M-Step的高斯混合模型算法的期望最大化阶段的导航部分的理解。虽然从表面上看,数学似乎太复杂而无法处理,但我们可以通过理解其各个部分来处理其复杂性。例如,一些关键的理解,如发音的希腊符号和应用它们的操作与NumPy是重要的,以掌握总体概念。
作者:Justin Chae
原文地址:https://towardsdatascience.com/unlock-m-step-from-em-in-gmm-dd9a32a0aa6f
deephub翻译组
本文分享自微信公众号 - DeepHub IMBA(deephub-imba)。
如有侵权,请联系 [email protected] 删除。
本文参与“OSC源创计划”,欢迎正在阅读的你也加入,一起分享。
Recommend
About Joyk
Aggregate valuable and interesting links.
Joyk means Joy of geeK