

Progressive enhancement for a Canvas demo.
source link: https://www.otsukare.info/2015/12/17/icelandic-travel
Go to the source link to view the article. You can view the picture content, updated content and better typesetting reading experience. If the link is broken, please click the button below to view the snapshot at that time.
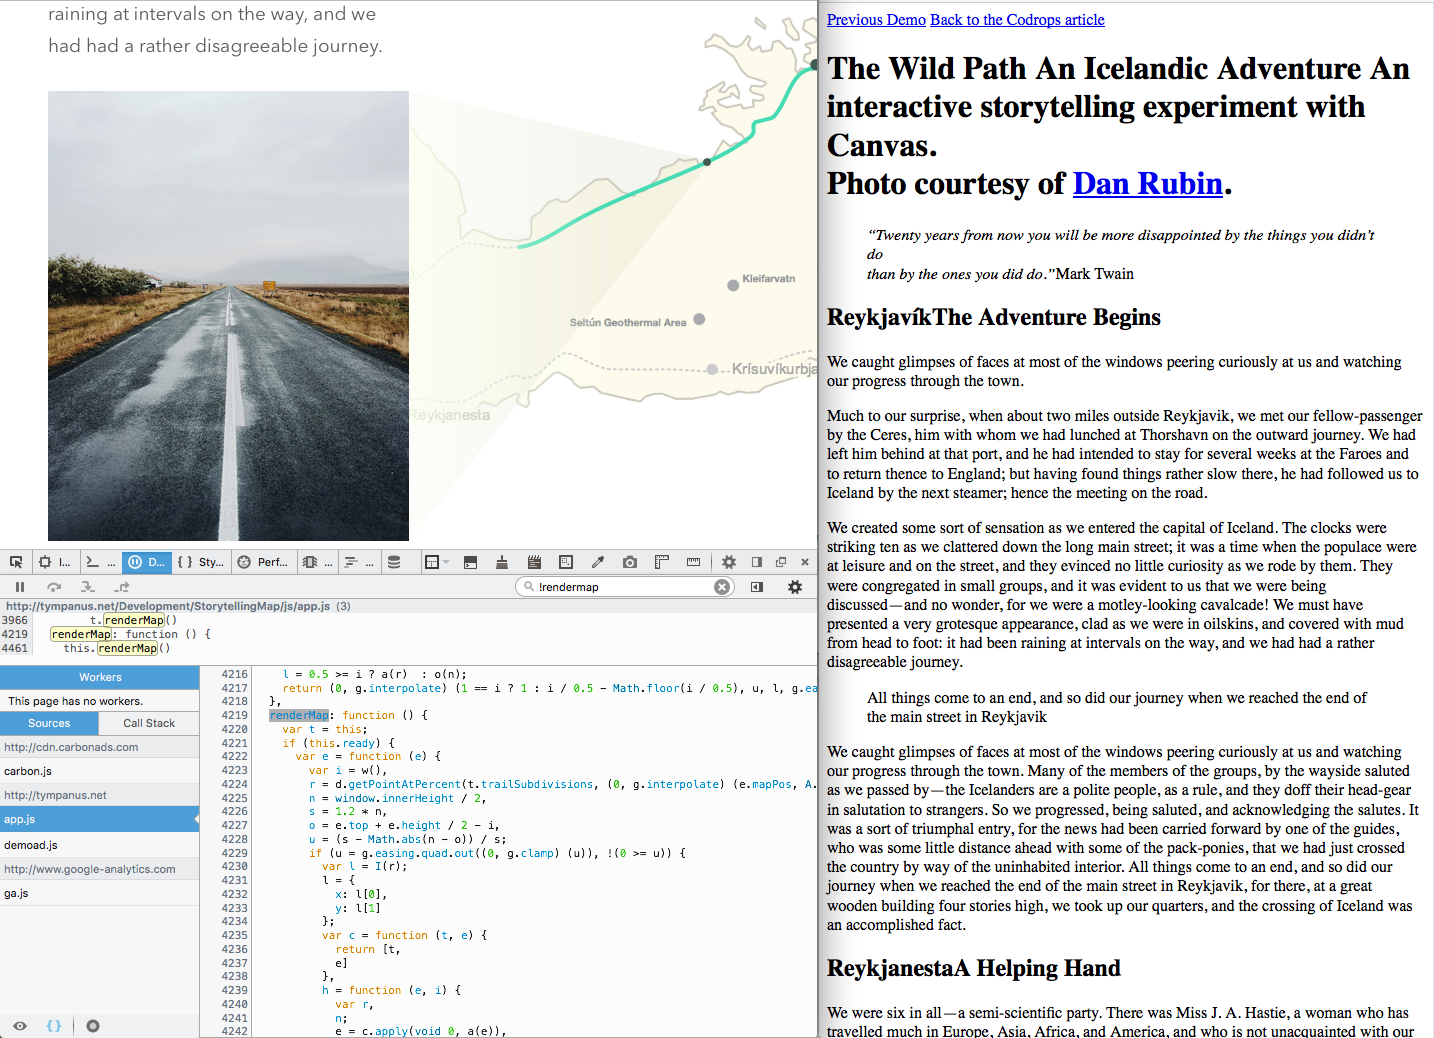
"The Wild Path. An Icelandic Adventure. An interactive storytelling experiment with Canvas." is a beautiful demo. We need more demos like this one.
The map trace is synchronized with the text on the screen. The map is defined as SVG but controlled by canvas.
<div class="container">
    <canvas style="position: absolute; top: 0px; left: 0px;" height="549" width="817"></canvas>
</div>
with:
    this.canvas = (0, h.default) (e, i), this.canvas.style.position = 'absolute', this.canvas.style.top = 0, this.canvas.style.left = 0, this.ctx = this.canvas.getContext('2d', {
      alpha: !1
    }), this.ctx.fillStyle = '#fff', this.ctx.fillRect(0, 0, this.state.width, this.state.height), this.container.appendChild(this.canvas), this.calculateSections(), Array.from(this.props.textContainer.querySelectorAll('img')).forEach(function (e) {
      e.addEventListener('load', function (e) {
        t.calculateSections(),
        t.renderMap()
      })
    })
Images have a load event, triggering these functions.
function(e) {
  t.calculateSections(), t.renderMap()
}
Some sections have an associated zoom given through a data- attribute, aka private to the page. Perfect usage of data-.
<section class="js-section" data-zoom-middle="2">
and also a data-pos
<figure>
    <img class="js-image" data-pos="0.25" src="img/journey/9.jpg">
    <figcaption>All things come to an end, and so did our journey when we reached the end of the main street in Reykjavik</figcaption>
</figure>

[…]

<figure>
    <img class="js-image" data-pos="0.6" src="img/journey/5.jpg">
    <figcaption>I was the geographer, whose mission it was to make a map of a small portion of the country traversed.</figcaption>
</figure>
All of that is simple. The code is a nice read.
But the best part of it comes from just reading without CSS and JS. We still get a readable text. And it's rare enough these days, that it has to be praised on the tone, yes it's possible.
One nitpick: The lack of spaces in between some words.
Otsukare!
Recommend
About Joyk
Aggregate valuable and interesting links.
Joyk means Joy of geeK