

Ilya Kipnis' Defensive Adaptive Asset Allocation - AllocateSmartly
source link: https://allocatesmartly.com/ilya-kipnis-defensive-adaptive-asset-allocation/
Go to the source link to view the article. You can view the picture content, updated content and better typesetting reading experience. If the link is broken, please click the button below to view the snapshot at that time.
Ilya Kipnis’ Defensive Adaptive Asset Allocation
February 26, 2019
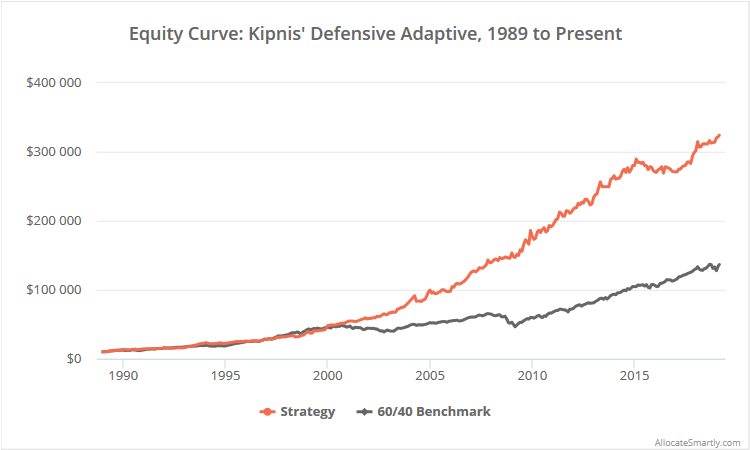
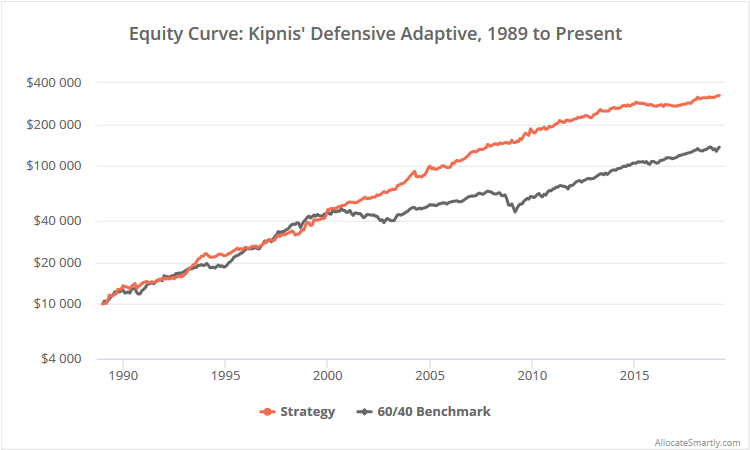
This is a test of Ilya Kipnis’ “Defensive Adaptive Asset Allocation” (KDA). KDA is a “Meta” model of sorts, combining successful elements of multiple other tactical asset allocation strategies that we track.
Results from 1989 to the present, net of transaction costs, follow. Read more about our backtests or let AllocateSmartly help you follow this strategy in near real-time.
A “Meta” strategy:
AllocateSmartly tracks our own Meta Strategy, a real-time combination of 10 of the top performing strategies on our site. That means we’re diversifying across many different approaches to TAA (what Newfound Research would refer to as “diversification of the how“).
KDA takes a different approach to a Meta model, selecting just the most successful elements from other strategies that we track:
- KDA measures momentum across multiple timeframes from 1 to 12-months, with more recent momentum given more weight. This is identical to the approach taken by Keller and Keuning’s “Vigilant Asset Allocation” (link: public | members).
- It considers both absolute and relative momentum, like traditional “dual momentum”. In other words, it requires that an asset exhibits both positive momentum and stronger momentum than other assets.
- It uses minimum variance optimization with a “weighted” covariance matrix like ReSolve’s “Adaptive Asset Allocation” to determine how much of the portfolio to allocate to each asset (link: public | members).
- It uses the “canary universe” concept from Keller and Keuning’s “Defensive Asset Allocation” to know when to “turn off” the strategy and move to defensive assets like US Treasuries or cash (link: members).
Which is the better approach to building a Meta model?
It depends. The more the future resembles the past, the better a model like Ilya’s would be expected to perform, as it’s selecting the best historical elements from other strategies that we track. The more the future differs from the past, the better a model like ours would be expected to perform, as we’re laying bets across multiple different approaches to TAA.
Strategy rules tested:
We’ve deviated slightly from Ilya’s original ruleset in order to fit the standardized approach we take on this site. See calculation notes for more details.
- KDA includes three asset universes: an investment, “canary”, and crash protection universe.
- Investment universe: US equities (represented by SPY), Europe equities (VGK), Japan equities (EWJ), emerging mkt equities (EEM), US REITs (VNQ), intl REITs (RWX), int-term US Treasuries (IEF), long-term US Treasuries (TLT), commodities (DBC) and gold (GLD).
- Canary universe: Emerging market equities (EEM) and US aggregate bonds (AGG).
- Crash protection universe: Intermediate-term US Treasuries (IEF) and cash.
-
For all assets across all three universes, at the close on the last trading day of the month, calculate a “momentum score” as follows:(12 * (p0 / p21 – 1)) + (4 * (p0 / p63 – 1)) + (2 * (p0 / p126 – 1)) + (p0 / p252 – 1)Where p0 = the asset’s price at today’s close, p1 = the asset’s price at the close of the previous trading day and so on. 21, 63, 126 and 252 days correspond to 1, 3, 6 and 12 months.Note how the momentum score weights more recent months over more distant months.
-
Interpreting the canary universe: If both canary assets (EEM and AGG) exhibit positive momentum, allocate the entire portfolio to the investment universe. If only one canary asset exhibits positive momentum, allocate half of the portfolio to the investment universe and half to crash protection. If neither canary asset exhibits positive momentum, allocate the entire portfolio to crash protection.See Keller and Keuning’s paper Breadth Momentum and the Canary Universe for more on this idea of a canary universe.
- Selecting from the investment universe: Select the 5 assets with the highest momentum score (i.e. the “top half” of the universe). Discard those with a negative momentum score.
-
Allocating to the investment universe: Allocate among our 5 (or less) assets according to minimum variance optimization, using a “weighted” covariance matrix. The covariance matrix is calculated using 21-day (1-month) volatility, and correlation weighted as follows:[(21-day correlation * 12) + (63-day correlation * 4) + (126-day correlation * 2) + (252-day correlation)] / 19Note that this is the same 1/3/6/12-month weighting used in measuring momentum.
- Allocating to the crash protection universe: If crash protection is in effect, allocate that portion of the portfolio to intermediate-term US Treasuries (IEF) if IEF is exhibiting positive momentum, otherwise to cash.
- Positions are assumed to be executed at the close. Hold all positions until the last trading day of the following month.
Well that was a mouthful.
In short, we’re allocating to assets exhibiting the highest positive recent momentum, unless our two canary assets (EEM and AGG) are warning of impending weakness in risk assets.
Hyperactive (by TAA standards):
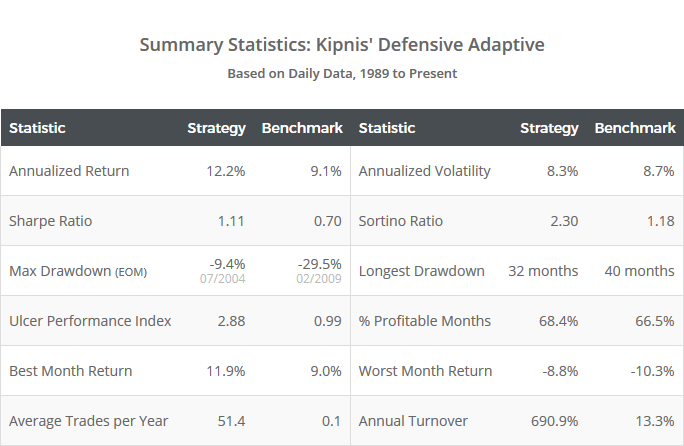
Relative to other tactical asset allocation strategies, KDA trades a lot. It has turned over the entire portfolio nearly 7 times per year (see “annual turnover”), making it the most active TAA strategy that we track.
That may or not be relevant to you. Our results already include an assumption for transaction costs/slippage, so if trading in a tax-deferred account, the pain of that frequent trading has already been baked in. If trading in a taxable account however, it means that KDA is one of the least tax efficient strategies that we track, with three-fourths of profits coming from short-term capital gains. We track every strategy’s historical tax efficiency for members.
We should also note that, because of this hyperactive trading, our inclusion of transaction costs/slippage was the biggest cause of discrepancy between our long-term results and Ilya’s, resulting in about a 1.4%/year drag on returns. You could adjust the results shown here based on how your own execution costs compare to our 0.1%/trade (0.2% round-trip) assumption.
We could write basically the same thing about a number of hyperactive strategies that we track (ex. VAA, ADM, AAA), so we’re definitely not picking on KDA here. It’s just not something we’ve talked about before, and this seemed like an apt time since our site has a new leader for active trading.
Of course, if you’re a swing trader or the like, you laugh at the idea of 7x portfolio turnover being deemed “hyperactive”. It’s all relative.
Our take on KDA:
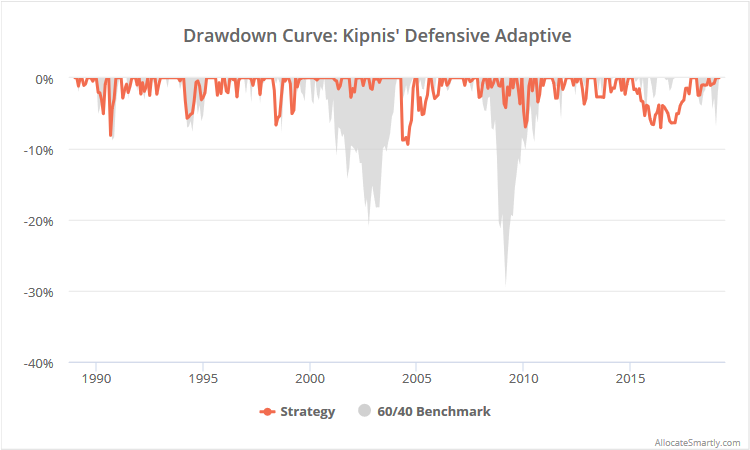
There’s a lot to like about this strategy. KDA combines multiple effective concepts from other strategies that we track. In terms of risk-adjusted return (ex. Sharpe, UPI, etc.) it has been one of the top performing on our site over the last couple of decades.
Possible strategy tweaks (untested, your mileage may vary):
- Due to the nature of the min var optimization, KDA will often be very concentrated in just one or two risk assets. Perhaps setting a hard limit on allocation to any particular asset, or setting a limit on total portfolio volatility each month, makes sense.
- Try to reduce portfolio turnover by reducing the importance of relative (but not absolute) momentum. For example, once the strategy was already in a given asset, make it harder to rotate into a similar risk asset (ex. from one flavor of equities to another) when both are still showing positive momentum. Rotating into assets that are expected to be only marginally better is a major cause of tax inefficiency (read more).
-
An outside the box idea: To really leverage the Meta model idea and reduce “specification risk”, it would be interesting to see something like what Newfound Research did with “Diversified Dual Momentum” (link: public | members).For example, rather than use one momentum score of 1, 3, 6 and 12 months to select assets, build four versions of the portfolio (one based on 1-month momentum, one based on 3-months, etc.) and weight the final result. It would result in more assets held at any one time, but would do a better job sussing out the unique characteristics of short, medium and long-term momentum.
It’s great to see the TAA community building upon each other’s ideas like this. I’d like to think that our role both as a central repository for TAA strategies and an independent arbiter of performance, makes this type of Meta analysis more effective. When you’re able to compare all significant published TAA strategies on a level playing field, it’s easier to identify the good ideas.
Thank you to Ilya Kipnis for the opportunity to put this strategy to the test. We generally don’t add a strategy to our site based on a simple blog post – we usually require something more formal like a book or paper – but we make exceptions for the top thinkers in quantitative analysis. Ilya is just that, and we highly recommend you follow Ilya now.
New here?
We invite you to become a member for about a $1 a day, or take our platform for a test drive with a free limited membership. Put the industry’s best tactical asset allocation strategies to the test, combine them into your own custom portfolio, and then track them in near real-time. Have questions? Learn more about what we do, check out our FAQs or contact us.
Calculation Notes:
- Ilya used actual monthly endpoints to determine the number of days to look back when calculating the momentum score and covariance matrix, while we used a consistent n-days (1-month = 21-days, 3-months = 63-days, etc.) We had to make this change because of the unique way we handle alternative trading days on our site (read more). Both approaches yield similar results, but are not precisely the same.
- Ilya represents the Emerging Mkt/Agg Bond canary universe with VWO/BND, while we use EEM/AGG. This is intentional. Read more about why we conform all strategies to a common set of assets.
- The minimum variance portfolio will sometimes call for an extremely small allocation to a given asset. We’ve ignored any position smaller than 2% of the portfolio, and reallocated that position to other assets (proportionally). This change is necessary because we assume that members are including the strategy as just one component of their custom model portfolio, meaning a position size of less than 2% could become impractically small. This change had a negligible impact on performance.
Recommend
About Joyk
Aggregate valuable and interesting links.
Joyk means Joy of geeK