

Kubernetes Monitoring: Full Overview, Tools & Best Practices - Sematext
source link: https://sematext.com/guides/kubernetes-monitoring/
Go to the source link to view the article. You can view the picture content, updated content and better typesetting reading experience. If the link is broken, please click the button below to view the snapshot at that time.

Monitoring is not easy when working with monolith architecture and it’s even less so since microservices were introduced. Kubernetes solved many challenges that came with distributed environments such as speed, scalability and resilience. However, it also added complexity to logging and monitoring.
In our guide to Kubernetes logging, we’ve already discussed the peculiarities of log management in Kubernetes, how to do it, and what best practices and tools can make your job easier.
Today, we’re going to tackle Kubernetes monitoring – why it’s important, various monitoring approaches, and the tools available to help you ensure end-to-end visibility of your Kubernetes environment.
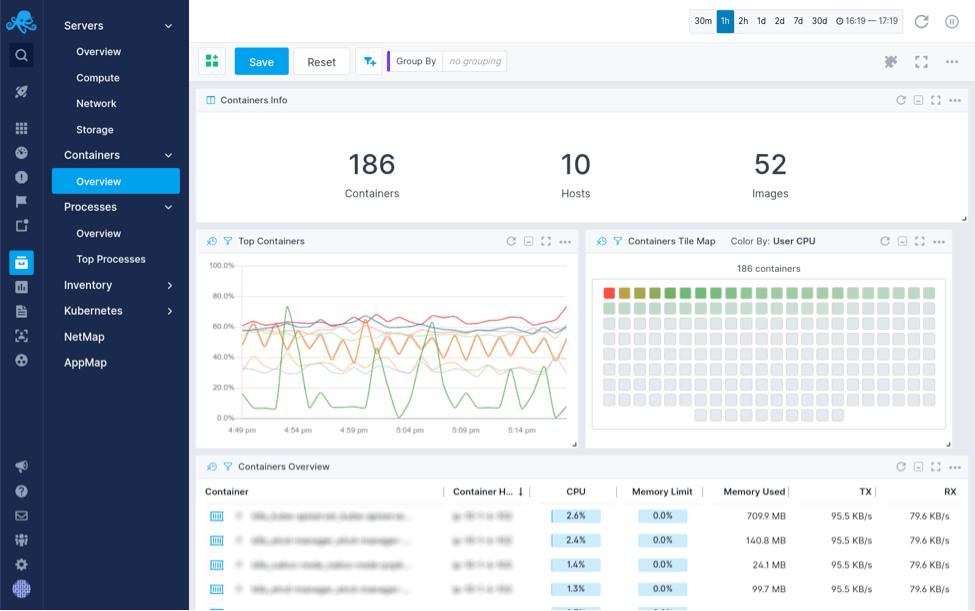
Container Overview
Why Monitor Kubernetes
Kubernetes monitoring gives you insight into your cluster’s current health, including performance metrics, resource counts and a top-level overview of what is happening inside your Kubernetes cluster. Crucially, you need to be alerted when errors occur, so you can quickly act on them and fix any issues that arise.
Sitting between your bare metal or virtual infrastructure – whether it’s Google, Azure, AWS – and the services that empower your applications, Kubernetes adds more complexity to already complex infrastructure. Similar to the move from monolith to a microservice architecture, adopting Kubernetes means that you have to monitor many smaller components. There are hosts, the Kubernetes platform itself, containers, and the containerized apps, all of which ought to be monitored.
Combined with microservices, you now have on your hands a distributed and dynamic environment that requires a dynamic and granular approach to performance monitoring. Therefore, you need a monitoring system that enables you to track each individual component, whether it’s the available resources in a Kubernetes deployment or the health of your deployed apps and containers.
Monitoring Kubernetes also helps with cost control. By giving you a full picture of resource usage and availability, you can make sure that pods, individual containers, and namespaces use underlying resources efficiently.
In fact, monitoring Kubernetes is not that different from monitoring Docker. Similarly, running Kubernetes optimally has some of the same challenges and follows similar best practices as Docker container management.
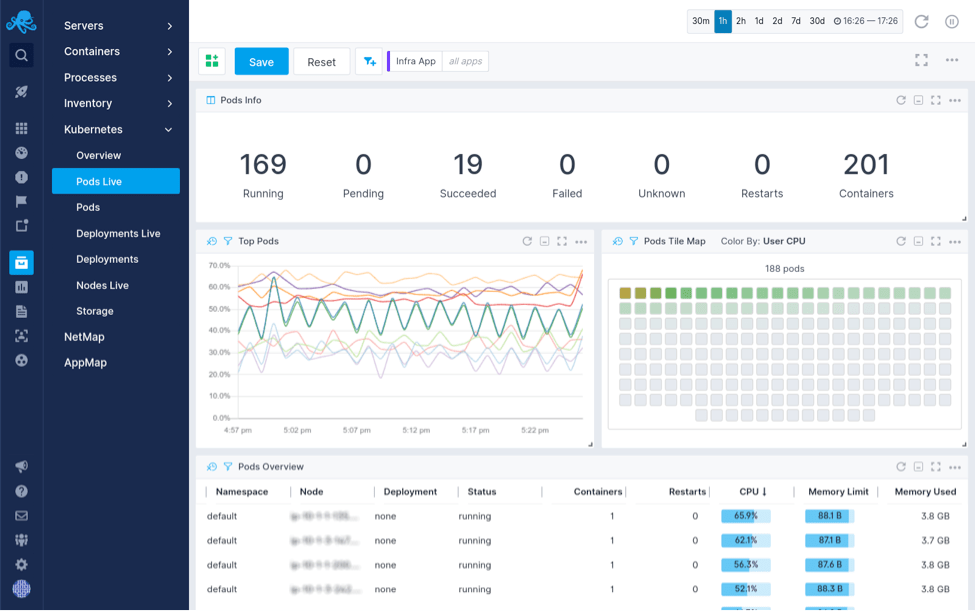
Kubernetes Pod Overview
What Metrics Should You Measure?
Monitoring Kubernetes involves monitoring the cluster, all the nodes, as well as monitoring pods, deployments and services.
Kubernetes Cluster Metrics
You first need to monitor the health of your entire Kubernetes cluster. It will help to know how many resources your entire cluster uses, how many applications are running on each node, and if your nodes are working properly and at what capacity.
Here are some of the most useful metrics for each:
- Node resource usage metrics like disk and memory utilization, CPU, network bandwidth, and many more, enable you to decide if you need to increase or decrease the number and size of each node in the cluster.
- The number of nodes available shows you what a cluster is used for and what you’re paying for if you’re using cloud providers.
- The number of running pods shows you if the number of nodes available is enough and if they could handle the workload in case a node fails.
Kubernetes Pod Metrics
Pod-level monitoring involves looking at three types of metrics: Kubernetes metrics, container metrics, and application metrics.
Kubernetes Metrics
Kubernetes metrics help you ensure all pods in a deployment are running and healthy. They provide information such as how many instances a pod currently has and how many were expected. If the number is too low, your cluster may run out of resources. It’s also important to know how your deployment is progressing, as well as tracking network throughput and data.
Container Metrics
Container metrics help you determine how close you are to the limits you’ve configured. You’re interested in monitoring metrics such as CPU, memory, and network usage. They also allow you to detect containers stuck in a CrashLoopBackoff.
Application Metrics
Application metrics measure the performance and availability of applications running inside your Kubernetes cluster and are usually exposed by the applications themselves. The available metrics depend on the business scope of each application. Say you use a database application, then you’ll likely be interested in data related to tables, relationships, and indices’ state. If you work with an e-commerce application, you’ll want to keep an eye on the number of users online, for example.
How to Monitor Kubernetes
Even though you’re dealing with a complex and multilayered system, you should have a consistent monitoring strategy over the entire cluster. That means that metric collection should happen the same way and with the same reliability, no matter whether your nodes are deployed in the same location, in the cloud, across clouds, or in a hybrid cloud.
That said, there is one standardized approach you take to collect and extract metrics that help you assess the state of your Kubernetes clusters and all their resources in production.
Collecting metrics using DaemonSets
This method consists of running metric-collection software usually, called an agent as a pod called a DaemonSet. DaemonSets ensure that every node in the cluster has a copy of the DaemonSet pod. Similarly, as nodes are terminated, the pod is removed as well.
Remember this, a DaemonSet makes sure one Pod with the agent is running on each Kubernetes node.
With a DaemonSet you can deploy an agent that monitors each node, and all the resources on that node, across the whole Kubernetes cluster. Many monitoring solutions use this method to deploy their agent to each node. Then, their agents collect and expose metrics.
Here’s an example. You can use the Helm chart for Sematext Agent and deploy both metrics and logs collection as well as shipping it all to Sematext Cloud.
helm install --name st-agent \
  --set infraToken=<INFRA_TOKEN> \
  --set containerToken=<CONTAINER_TOKEN> \
  --set logsToken=<LOGS_TOKEN> \
  --set region=<US/EU> \
  stable/sematext-agent
As simple as that, and you have full insight into your Kubernetes cluster and its resources.
Find out about other essential Kubernetes commands from our Kubernetes Tutorial or download our Kubernetes commands cheat sheet.
Kubernetes Cheat Sheet
We’ve prepared a Kubernetes Cheat Sheet which puts all key Kubernetes commands (think kubectl) at your fingertips. Organized in logical groups from resource management (e.g. creating or listing pods, services, daemons), viewing and finding resources, to monitoring and logging. Download yours.
Best Kubernetes Monitoring Tools: Free, Open-source & Paid Comparison
Now that you know what metrics to keep an eye on when working with Kubernetes clusters, let’s see what tools can you use to collect and expose them.
We made a list of the most popular monitoring tools in the Kubernetes landscape, both open source, and commercial, to help you get started. Due to the complex nature of Kubernetes, we included solutions with various functionalities – some tackle logs, others just metrics; some are Kubernetes-native, other general-purpose; and some act as data collectors, while others as the interface.
Let’s start with the best fully-featured tools for monitoring Kubernetes in production.
Rolling your own monitoring solution is great if you have the time and resources for it. Many do not. Instead, you can use hosted SaaS monitoring tools. Let the people who have years of experience in managing monitoring tools do it for you, while you focus on building your own product and creating value.
Sematext
Sematext offers a unified solution to monitor both traditional and microservice-based applications deployed on Kubernetes, capturing logs, metrics, and events in real time. You can then structure, visualize and analyze this data.
Our cloud monitoring solution allows you to set up alerts on both logs and metrics, built log analytics reports and customizable monitoring dashboards, thus making it easier and faster to point out problematic pods. Also making sure you get notified through email, Slack, or any other notification hook of your choosing.
Sematext takes care of logging and monitoring in Kubernetes, without running any storage or monitoring infrastructure yourself.
All you need to do is install the metrics and logs shipper provided by Sematext, or use any existing tool. With Sematext’s Elasticsearch API you can send data with any tool of your choice.
It’s easy to install the Sematext Agent as a Helm chart, DaemonSet, or Kubernetes Operator.
Pros:
- Easy to install
- Auto-discovery
- Custom monitoring dashboards
Recommend
-
28
As shown in Part 1 Solr Key Metrics to Monitor , the setup, tuning, and operations of Solr require deep insights into the performance metrics such as r...
-
11
Java Monitoring Tools & Metrics Dive into Java monitoring and learn how to keep peak application performance To keep your users happy – and business going – your Java app needs to be up and running...
-
10
15 Best Website Performance & Speed Testing Tools [2022] This website uses cookies to ensure you get the best experience on our website. For more information visit our
-
7
Apache Monitoring: Best Tools and Key Metrics to Track Web Server Performance [2022] Sunny Srinidhi on January...
-
9
Frontend Performance Monitoring: 8 Tools & SaaS to Improve Application and Website User Experience [2022] John Demian on
-
14
10 Best Linux Monitoring Tools and Software to Improve Server Performance [2022 Comparison] Ehab Qadah on Jan...
-
17
20+ Best Log Management Tools for Monitoring, Analytics & More: Pros & Cons Comparison [2022] Radu Gheorghe on
-
9
Top 10+ Best System Monitoring Software & Tools [2022] This website uses cookies to ensure you get the best experience on our website. For more information visit our
-
11
11 Best API Monitoring Tools & Services [2022 Review] This website uses cookies to ensure you get the best experience on our website. For more information visit our
-
7
HAProxy is one of the most popular software around when it comes to load balancers and reverse proxies. When you’re using it for these purposes, it’s especially important to monitor for both availability and performance, which will impact you...
About Joyk
Aggregate valuable and interesting links.
Joyk means Joy of geeK