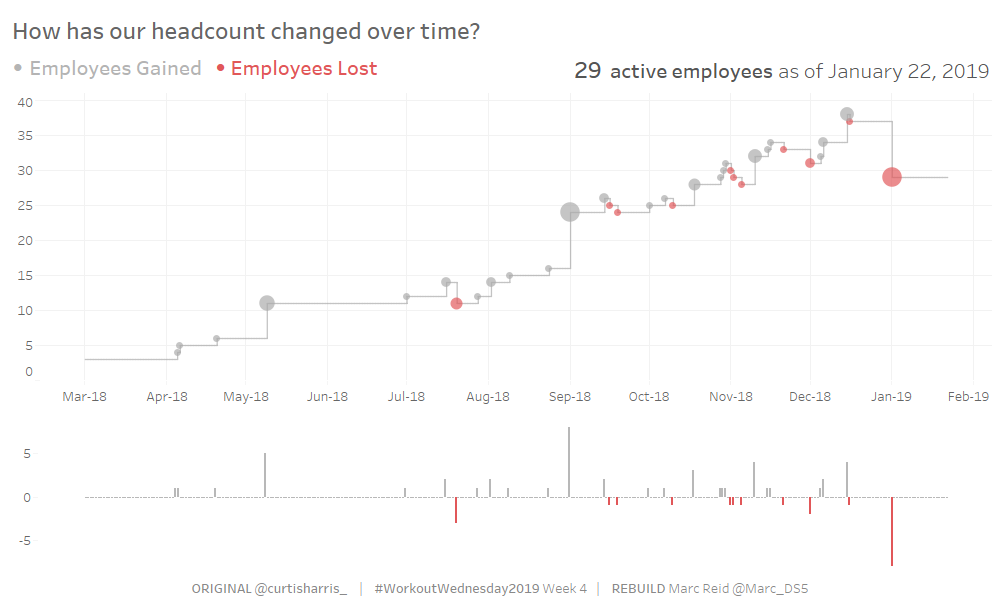

Workout Wednesday 2019 Week 4 – Tracking Headcount
source link: https://datavis.blog/2019/01/25/wow2019w04/
Go to the source link to view the article. You can view the picture content, updated content and better typesetting reading experience. If the link is broken, please click the button below to view the snapshot at that time.
Workout Wednesday 2019 Week 4 – Tracking Headcount

One of the main focus areas for this week’s challenge from Curtis Harris was data preparation, which I enjoyed as I haven’t needed to do so much prep directly within Tableau due to usually using tools like Alteryx, so it was great practice.
The End Goal
Data Preparation
Curtis provided a link to two tables. The first was an Employees table with Hire Date and Term Date (a few rows of the table below):

The second was a scaffold table of dates that could be used (by joining the two tables) to create rows for all dates between each employees’ Hire Date and Term Date (a few rows below):

I wanted to join the tables where – for each employee – two conditions were met:
- the Date value (in the scaffold table) was greater than or equal to the Start Date (in the Employee table)
- The Date value was less than or equal to the Term Date (or today’s date if the Term Date was Null)
I first tried this in Tableau, but it wasn’t happy having the same field used in two join conditions:

So I switched to using a calculation, which I then filtered to True and applied the filter to all worksheets.

With that in place, I was showing the magic number of 5,947 records, which was in the specification, so I seemed to be on the right track.
Partial results of the join with the filter in place can be seen below with the rows for employee 38 highlighted. There is now one row for every day of that person’s employment, i.e. between their Hire Date of 10th Nov 2018 and their Term Date of 30th Nov 2018.

To learn more about data scaffolding, take a look at this blog post and this blog post, both of which have additional links within them.
Calculations Needed for the Charts
With the data prep complete, I needed a couple more calculations to be able to build the required charts:
Daily Total – to return the total number of employees for a given date
COUNT([Employee Id])
Daily Change – the change in number of employees per day
COUNT([Employee Id]) - LOOKUP(COUNT([Employee Id]),-1)
Building the Charts
First I built the step line chart with this setup:

Then copied the measure as a dual axis to make the circles:

For sizing the circles I wrapped the Daily Change calc in an ABS() function to make the negative changes positive, such that a change of +5 or -5 would appear the same size.
I wasn’t keen on the dots being prominent along the lines where there was a zero daily change, so I amended the Daily Total calc to check for zeros and return NULL in those cases so no circle would be drawn:
IIF([Daily change]=0,NULL,COUNT([Employee Id]))

The daily change chart was a fairly simple one with the below setup:

I wrapped the Daily Change calc in a SIGN() function so it returns 1 if the value passed to it is positive, 0 if the value is zero, or -1 if the value is negative.
Because I have restricted the palette to only two stepped colours, the colour for 0 becomes the same as the colour for 1 (grey in this case).

The header, showing the number of employees on the most recent day in the data was created on a separate sheet, shown below. I filtered the data to the last day in the data.

The final thing of note was to use a custom number format when making the tooltips so a “+” or “-” would show in front of the daily change:

Thanks for reading!
Recommend
About Joyk
Aggregate valuable and interesting links.
Joyk means Joy of geeK
