

Container Performance Analysis at DockerCon 2017
source link: http://www.brendangregg.com/blog/2017-05-15/container-performance-analysis-dockercon-2017.html
Go to the source link to view the article. You can view the picture content, updated content and better typesetting reading experience. If the link is broken, please click the button below to view the snapshot at that time.

Container Performance Analysis at DockerCon 2017
15 May 2017
At DockerCon 2017 I gave a talk on Linux container performance analysis, where I showed how to identify three types of performance bottlenecks in a container environment:
- In the host vs container, using system metrics.
- In application code in containers, using CPU flame graphs.
- Deeper in the kernel, using tracing tools.
The talk video is on youtube (42 mins):
And the slides are on slideshare:
This talk was a tour of container performance analysis on Linux. I included a quick summary of the necessary background, cgroups and namespaces, as well as analysis methodologies, before digging into the actual tools and metrics. An overall takeaway is to know what is possible, not necessarily learning each tool in detail, as you can look them up later when necessary.
I included many performance analysis tools, including basics including top, htop, mpstat, pidstat, free, iostat, sar, perf, and flame graphs; container-aware tools and metrics including systemd-cgtop, docker stats, /proc, /sys/fs/cgroup, nsenter, Netflix Vector, and Intel snap; and advanced tracing-based tools including iosnoop, zfsslower, btrfsdist, funccount, runqlat, and stackcount.
Reverse Diagnosis
I'm a fan of performance analysis methodologies, and I discussed how my USE method can be applied to container resource controls. But some controls, like CPU shares and disk I/O weights, get tricky to analyze. How do you know if a container is currently throttled by its share value, vs the system?
To make sense of this, I came up with a reverse diagnosis approach: starting with a list of all possible outcomes, and then working backwards to see what metrics are required to identify one of the outcomes. I summarized it for CPU analysis with this flow chart:
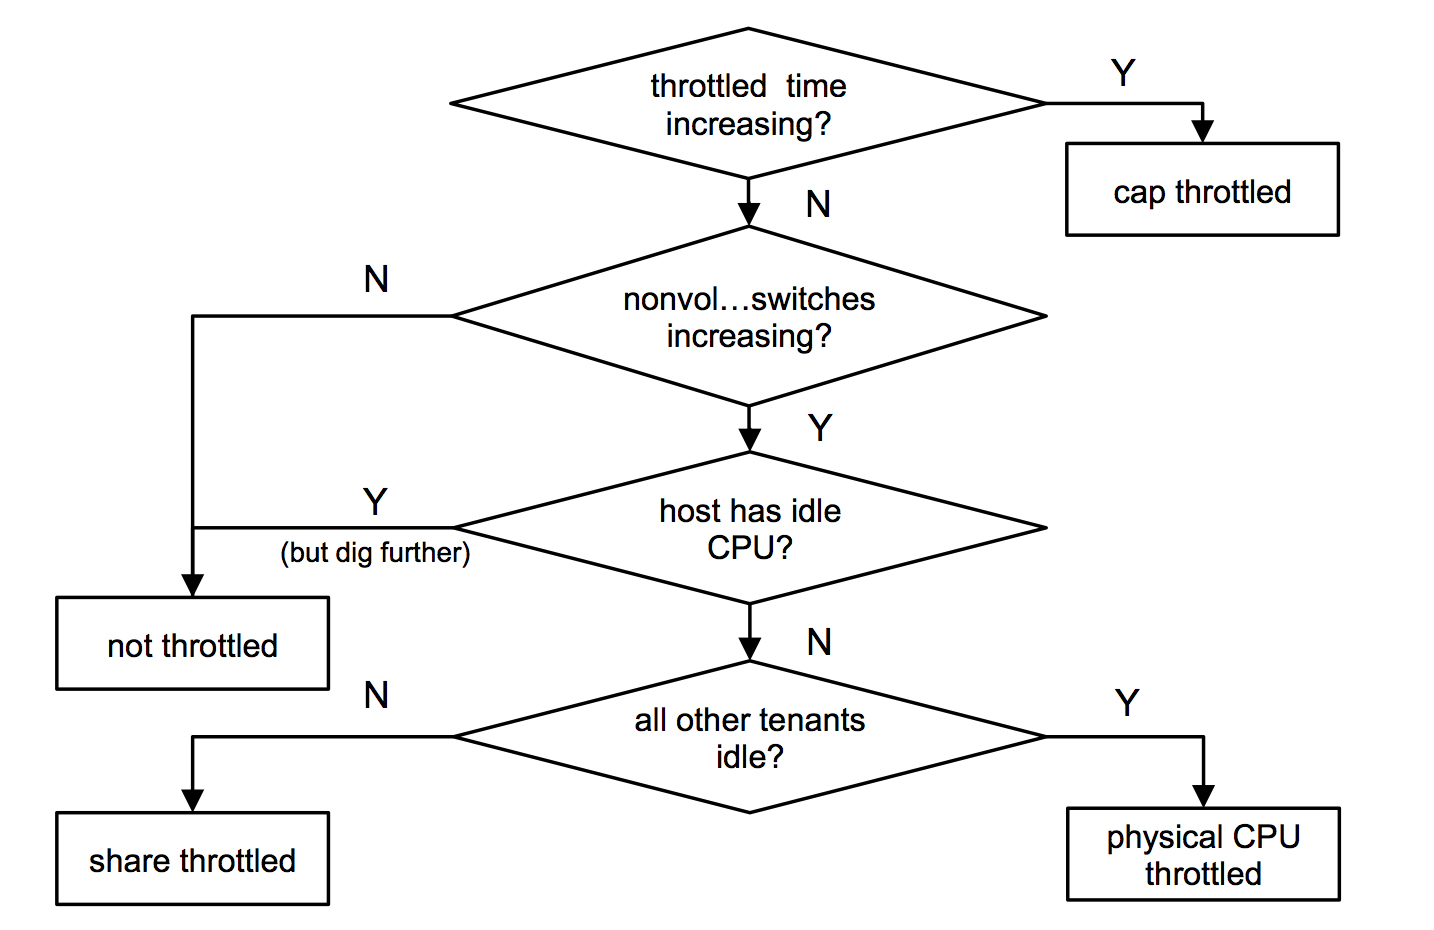
The first step refers to /sys/fs/cgroup/.../cpu.stat -> throttled_time, which indicates when a cgroup (container) is throttled by its hard cap (eg, capped at 2 CPUs). Since that's a straightforward metric, we check it first to take that outcome off the operating table, and continue.
See the talk for more details, where I also included a few scenarios beforehand to see if the audience could identify the bottleneck. Try it yourself: it's hard (then try it with the above flow chart!). This may become easier over time as more metrics are added to diagnose states, and time in states, so also check for updates to cgroup metrics in the kernel.
Netflix Titus
The environment I've been analyzing is Netflix Titus, which I summarized at the start of the talk. It was covered in a post published just before my talk: The Evolution of Container Usage at Netflix.
DockerCon was fun, and a big event: 6,000 attendees. My talk won a "top speaker" award, which also meant I delivered it a second time for those who didn't catch the first one. Thanks to the Docker staff for putting on a great conference, and for everyone for attending my talk.
Recommend
-
7
DockerCon LIVE 2021: One Month Before Lift Off William Quiviger Apr 26 2021
-
4
10 Reasons to Attend DockerCon LIVE 2021 David Oro Apr 30 2021
-
13
DockerCon LIVE 2021 Keynotes David Oro May 10 2021 Join us fo...
-
7
Recapping DockerCon 2021 with Snyk: Red Ventures, Docker container security, and more
-
6
Velocity 2017: Performance Analysis Superpowers with Linux eBPF22,127 viewsSep 29, 2017 Talk for...
-
11
Kernel Recipes 2017 - Performance Analysis with BPF - Brendan Gregg2,403 viewsOct 11, 2017 The in-ker...
-
3
EuroBSDcon 2017 System Performance Analysis Methodologies 1. EuroBSDcon 2017 System Performance Analysis Methodologies Brendan Gregg Senior Perform...
-
7
OSSNA 2017 Performance Analysis Superpowers with Linux BPF 1. Performance Analysis Superpowers with Linux BPF Brendan Gregg Sep 2017 ...
-
4
Velocity 2017 Performance analysis superpowers with Linux eBPF 1. Performance Analysis Superpowers with Linux eBPF Brendan Gregg Senior Performance Ar...
-
4
All articles
About Joyk
Aggregate valuable and interesting links.
Joyk means Joy of geeK